Environmental Geology Midterm Review (WIP)
1/42
There's no tags or description
Looks like no tags are added yet.
Name | Mastery | Learn | Test | Matching | Spaced |
|---|
No study sessions yet.
43 Terms
Residence Time Equation
Volume of Reservoir / Input or Output
Assumes steady state, such that I ~ O, and the reservoir is neither filling nor emptying
Exponential Growth Equation
N = New population/amount
N0 = Original population/amount
e = Euler’s number (constant)
k = Rate of change coefficient
REMEMBER THIS HAS UNITS OF PER UNIT OF TIME
t = Time

How to Calculate Doubling Time
Once you know “k” in the exponential growth equation, make “N” double “N0” and solve for “t”
You will always end up with ln(2) / k = t
Conservation Equation and Typical Lake Inputs and Outputs
Change in S = Inputs - Outputs
Inputs for a Lake:
Precipitation
Flow in
Groundwater in
Outputs for a Lake:
Evaporation
Flow out
Groundwater drainage
Main Flooding Fatality Events in US (1959-2022)
1969 — Hurricane Camille
1972 — Hurricane Agnes
2005 — Hurricane Katrina
Evaporation and Precipitation Tendencies on Continents and Ocean
Ocean — Evaporation dominates
Continents — Precipitation dominates
Global Energy Cycle — Albedo
102 watts/m2 is reflected and is known as Earth’s albedo
The majority of this is cloud cover (79 w/m2)
Thus, the water cycle is important
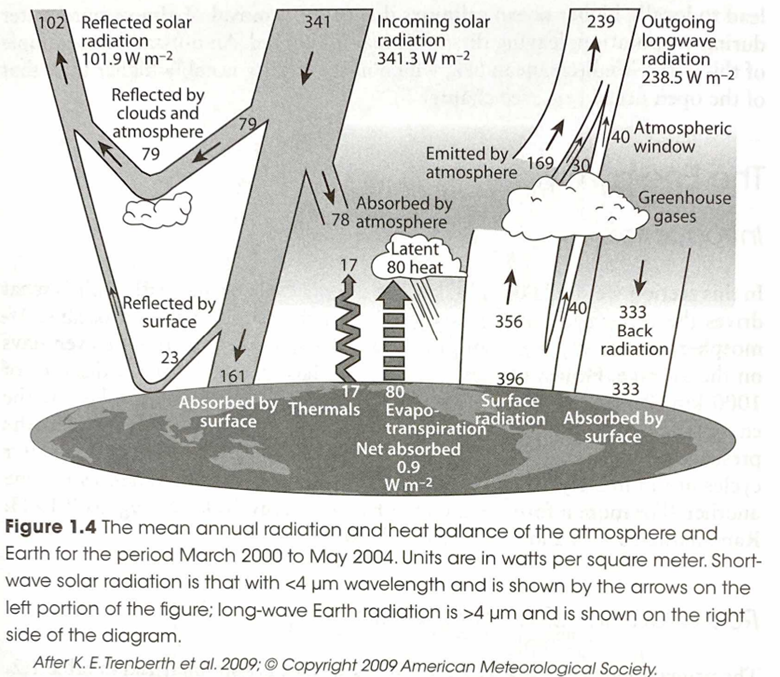
Global Energy Cycle — Latent Heat Flux
Latent Heat — Heat absorbed when water evaporates
80/161 of w/m2 reaching surface used to evaporate water
Drives the water cycle
Released upon condensation of water
Latent Energy Flux — From lands/ocean to atmosphere
Used to determine global rate of evaporation
522000 km3/yr evaporation rate globally
Global Cycles — 2 Ways the Transport Heat from Equator to Poles
Ocean currents carrying warm water (thermohaline circulation)
Warm air movement (major source at 10N-10S tropics) and Latent heat movement (water vapor)
Subtropics inject much latent heat of this due to high PPET
Release of latent heat in 30-50 N&S warms atmosphere
Vitousek et. al. — What percentage of the Earth’s Surface has been degraded or transformed
39-50%
Vitousek et. al. — Measurements Examples
Carbon
Air bubbles (ice cores) in Antarctic and Greenland
Sources traced isotopically (before nuclear testing)
Direct measurements in atmosphere and tree rings
Land Transformation
Satellite Remote Imagine
% of cropland, pastures, urban-industrial, and generally impacted areas
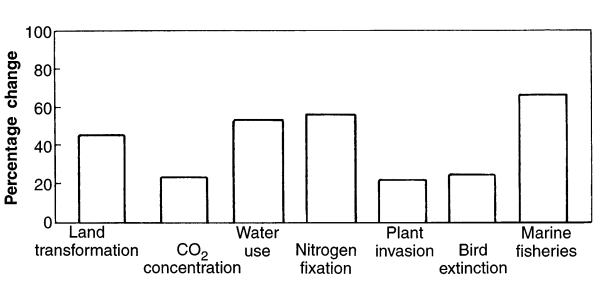
Vitousek et. al. — Important Percentage Change Chart
Percentage of land surface transformed
Percentage of atmospheric CO2 resulting from humans
Percentage of accessible fresh surface water used
Percentage of N terrestrial fixation caused by humans
Percentage of plant species in Canada introduced from elsewhere
Percentage of bird extinction in past 2 millennia
Percentage of major fisheries fully exploited, overexploited, or depleted
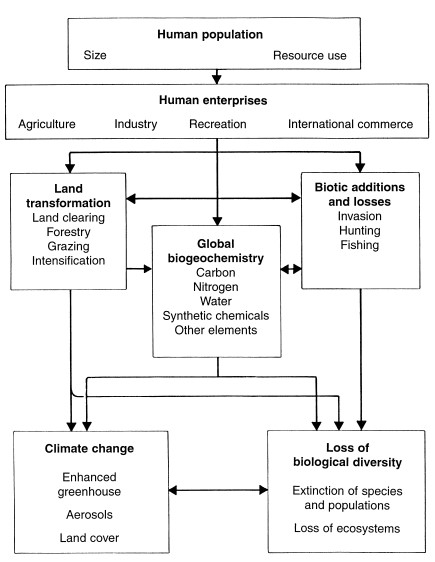
Vitousek et. al. — Main Arguments
Human changes in the environment are not a future problem, but currently impacting at a large scale now
Wholistic approach; considers basically every system to be damaged
All problems traced to growing human population/”enterprise”
Our fate depends on how we handle this situation
Current PPM of CO2 in Atmosphere
425 ppm
Basic 3 Soil Horizons according to the Soil Formation paper by Hans Jenny
Horizon A — Material has presumably been leached from here
Horizon B — Substances from A have been deposited
Horizon C — Parent material
O Horizon, if used, addresses organic layer on the surface
Two main soil former kinds
Passive — This is the source of mass that makes up the soil
Parent material
Age
etc.
Active — This is the energy that acts upon this soil mass
Biosphere
Atmosphere
Partly hydrosphere
The Definition of Soil Used in Class
“Upper portion of the earth’s surface that is naturally formed from chemical and physical weathering of regolith; it is layered and contains living and non-living matter.”
The 5 Main Soil Forming Factors
Climate
Organisms
Relief/Topography
Parent Material
Time
CLORPT
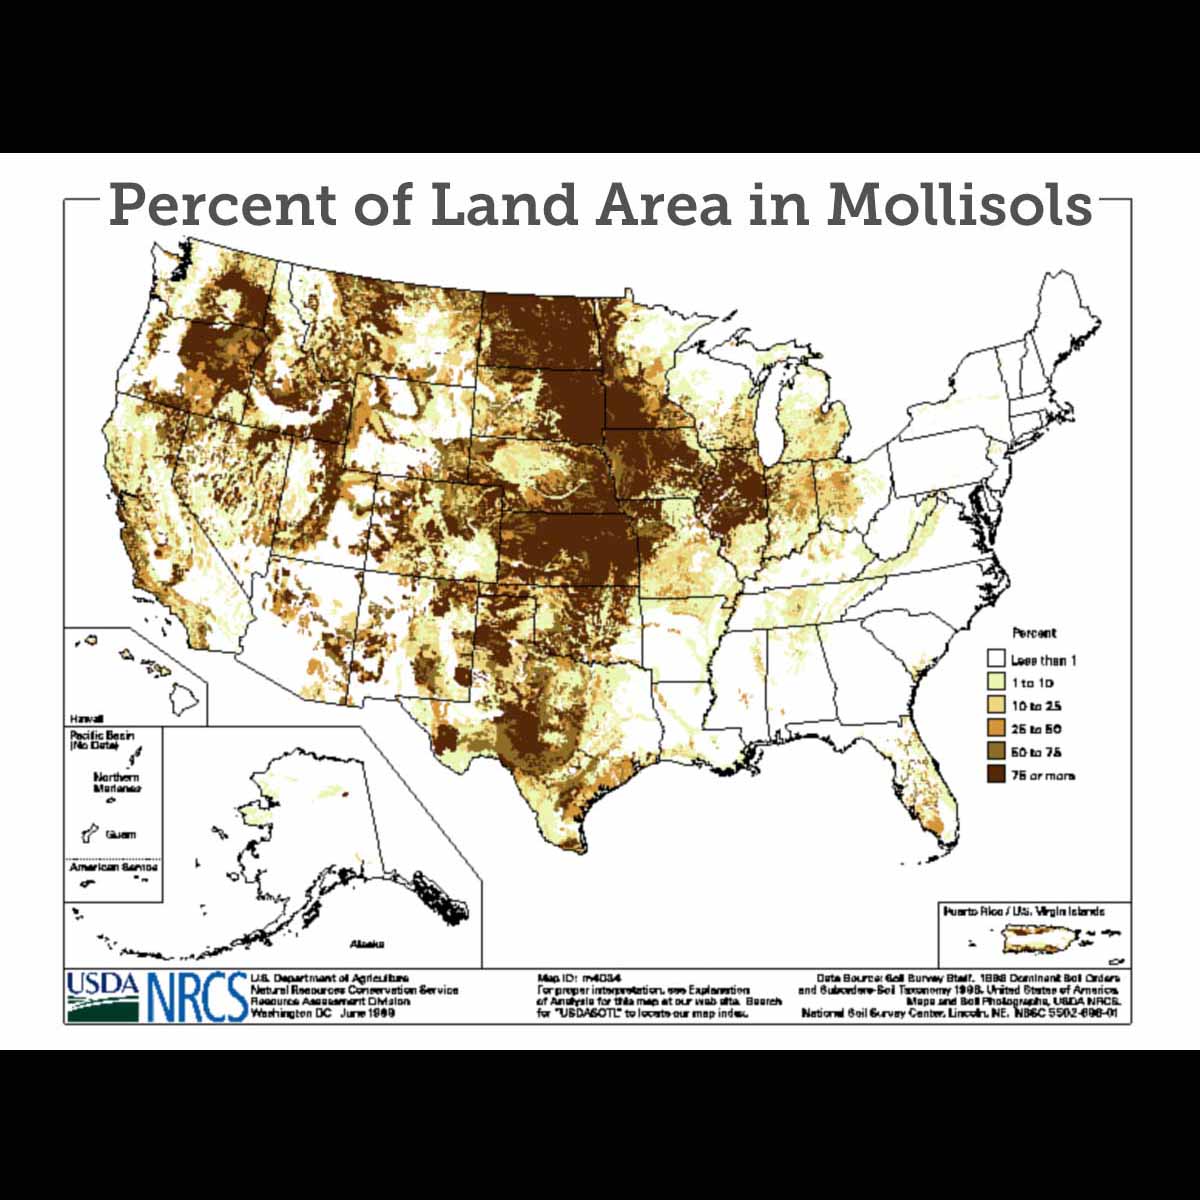
What are the 2 best soil types
Mollisols — The BEST
Mainly in the Midwest, rain provides enough for grasses to grow without leaching soil
Grass life and death over many years deposits nutrients
Alfisols — The (second) BEST
Near Great Lakes area primarily
Loess from glaciers (I think formed much of it around the Great Lakes…)
How much of the US land area is Mollisol?
22%
Rate of Soil Formation
Age of Soil / Thickness
Chronosequencing
Finding an area of a similar climate, but different soil ages; a constant needed to determine soil formation
Glacial regression
Glaciers strip soil as they move forward, so regression allows formation to begin anew
Island Formation
As a plate slides over a hot spot, new bare islands are made, while old islands have older soil to compare with
Wilkinson et. al. — Major Findings
Deposition of postsettlement alluvium most important geomorphic change currently
Farmland erosion (~600 m/m.y.) 3x river sediment loads
Per unit area, rate of postsettlement alluvium deposition > cropland erosion loss
Mean rates of Phanerozoic denudation:
16 m/m.y.
Agricultural practices are primary source of continental erosion now, concentrated in lowland areas
Before, elevation was main driver, as it is the main predictor of natural erosion rates
We are depleting the soil reservoir
Wilkinson et. al. — Measurements
Phanerozoic erosion rates
Deposited sedimentary rock in m/m.y and gt/y
How much would need to be eroded to create this thickness of rock
Modern erosion rates (???)
Cropland erosion in m/m.y. and gt/y
Assumed global farmland erosion rate of ~600m/m.y. based on past estimates; order of magnitude
Spatial variation determined by Universal Soil Loss Equation (at least in US figure)
What is the farmland process that leads to its devastating erosion?
Tilling
In what PPET is most agriculture done?
Semi-arid
0.2 < PPET < 0.5
Remember, ratio of precipitation to evapotranspiration
Context of the Climate of Dust Bowl Midwest
Semi-arid, grasses acclimated to drought, drought that caused the Dust Bowl was not out of the ordinary
Tree ring records in the area gives this context of drought history
Causes of the Dust Bowl
Grasses ripped up by farming practices; deep prairie grass roots vs. shallow crops
La Nina caused drought to arrive; Gulf of Mexico water did not reach area
Trade winds stronger than usual
“Great Plains Low Level Jet” affected
Government encouragement; homestead act and “Dry Farming” movement
One way disk plows and dust mulch; improper use of land
Easily eroded, bare, exposed land
“Rain follows the plow” pseudoscience
El Nino rose confidence in farming
Degraded soil
Positive feedbacks
Dust storms + lack of plants + lack of moisture and moisture retention + lack of soil fertility
El Nino ended Dust Bowl
Recurrence Interval of a Dust Bowl level drought
33 years
( solved with an RI that doesn’t factor in magnitude
RI = #years / #events )
Booth & Jackson — What percentage of effective impervious area results in onset of readily observable aquatic ecosystem degradation?
10%
Booth & Jackson — What were two metrics of degradation
Channel Width — How much had eroded; increased runoff
Observed fish habitat, measured by degradation as by observed erosion, sedimentation, and biological function
Booth & Jackson — Causes of degraded watersheds
Surface flow regime as opposed to subsurface regime caused by:
Vegetation clearing — Less riparian vegetation to inhibit flow and channel widening
Impervious surfaces — Surface flow; no percolation
Soil compaction — Similar to impervious surfaces
Gutters — Focused runoff
Leads to increased sediments and much faster and higher peak discharge in streams.
Booth & Jackson — Difference between Total Impacted Area and Effective Impacted Area
Total Impacted Area
Fraction of watershed covered by constructed, impermeable surfaces
Ignores compacted surfaces
Includes impervious surfaces that don’t contribute to the problem
Ex. Impervious gazebo next to soil
Effective Impacted Area
Impervious surfaces with a direct, hydraulic connection to downstream drainage
Booth & Jackson — Difference between peak standard and duration standard
Peak Standard:
Maintain postdevelopment peak discharges at predevelopment levels
Duration Standard:
Maintain postdevelopment duration of all sediment-transporting discharges at predevelopment levels
Better standard
Booth & Jackson — Problems with retention/detention ponds
It is much too costly to make an optimized pond according to the right standard — Restrictive and costly
Difference between retention and detention ponds
Wet retention ponds
Always have water in them
Supposedly helps water quality and allows chemicals and sediments to settle
Detention ponds
Dry until a storm comes
Hancock — Specific design goal of James City County retention ponds, and how many achieved it?
24 hour inflow-to-outflow centroid lag time for a 1 hour, 24-hours storm
Only 1/5 achieved it; 4/5 failed
Hancock — Problems with retention ponds
Use of “Kerplunk” method
States all water from storm drops at once
Leads to ponds that can handle water for 24 hours, but centroid lag time occurs at 12 hours
Underprediction of rainfall intensity and runoff curve numbers in determining peak and total runoff from design storms
Storm intensities observed were more intense
May have underestimated partially pervious surfaces
Didn’t account for piggybacking of storms
Back-to-back storms
OVERALL, RETENTION AND DETENTION PONDS ARE NOT BUILT TO STANDARDS, AND WHILE THEY WORK HYPOTHETICALLY, LOOPHOLES HAVE ALLOWED THEM TO BE BUILT UNDER STANDARD ACROSS THE NATION, AND IT IS TOO COSTLY TO MAKE THEM WORK AS INTENDED.
Mekonnen — How did they measure water scarcity, and what was the main finding
Monthly basis using 30 × 30 arc min cells
Ratio of blue water footprint to blue water availability
WS > 2 : Severe
Identified seasonal trends for water scarcity, and that 4 billion, or 2/3 of the current population of the study, experienced severe water scarcity at least 1 month of the year
Mekonnen — Causes of differences in water scarcity
Hadley Cells
Wet at equator, subtropical/desert at 30 degrees N/S
Rain Shadow Effect
Block precipitation
Large Continental Interiors
Cold water
Less evaporation
Human consumption
Agricultural irrigation use
Mekonnen — Why does this data have low variability (4 billion people suffer water scarcity point)
Demand and availability usually magnitudes apart
Either very high demand and low availability
Very high availability as opposed to relatively low demand
Environmental flow requirement parameters also do not shift much
Mekonnen — Why did past studies fail to capture these spatial and temporal trends
Did not account for environmental flow requirement in rivers
Assumed people could take more water than they could
Did not account for monthly trends, just annual
and/or
Did not examine at a high enough resolution
Just river basins
What metric do they use to determine how much available freshwater there is?
Streamflow to ocean
Counts for evapotranspiration
46000 km2/yr
Convert with 1000 m cubed to determine how much each person gets