EMF 3 - Statistical Inference
1/40
There's no tags or description
Looks like no tags are added yet.
Name | Mastery | Learn | Test | Matching | Spaced | Call with Kai |
|---|
No analytics yet
Send a link to your students to track their progress
41 Terms
What does a probability distribution describe?
how uncertainty is spread across possible outcomes of a random variable
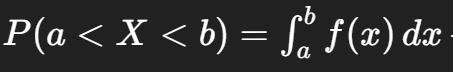
For a continuous variable, how do we compute the probability that it lies between two values a and b?
P(a<X<b) = f(x)dx
the area under the probability density function between a and b
Why can a probability density be greater than 1?
Because it’s a density, not a probability — only the area under the curve equals 1; height alone isn’t constrained
What is a percentile?
The value below which a given percentage of observations fall
e.g., 95th percentile means 95% of data are smaller
What is a z-score?
the number of Standard Deviations (σ2) an observation lies from the mean:
z = (x−μ)/σ
What is P(|Z|>1.96)?
5%
It’s the total probability in both tails beyond ±1.96, defining the 5% significance region for a two-tailed test.
Why do financial returns often approximate a normal distribution (at least roughly)?
many small independent influence aggregate to form approximately normal behavior (Central Limit Theorem)
What is an unbiased estimator?
One whose expected value equals the true parameter, E[β^] = β
Under MLR.1–5 (including homoskedasticity), what is Var(β^1)?
Var(β^1)=σ2/SSTx
What two factors make estimates more precise =» Smaller Variance?
Lower error variance (σ2)
More variation in x
Larger sample size in x
What assumption is MLR.5?
Homoskedasticity: the error term u has constant variance
Var(u∣x)=σ2
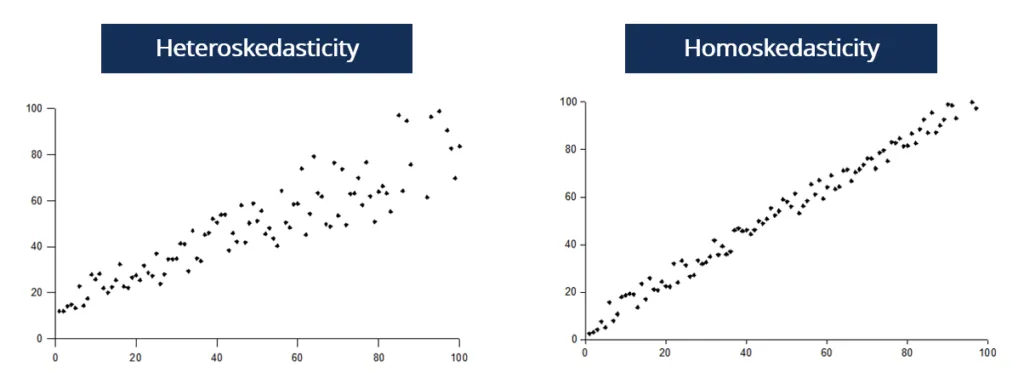
Homoskedasticity vs Heteroskedasticity
Homoskedastic: constant error variance across x
e.g.: Test scores (Y) vs. study hours (X)— variance stays constant
Heteroskedastic: variance of errors changes with x
e.g.: Age (x) vs. Income (Y) — young people earn similarly low amounts, but as people age, income differences grow widely
Why can’t we use true errors ui to estimate σ2?
because true errors are unobsorved
Hence we estimate them through residuals u^i=yi−y^i
What is the unbiased estimator of error variance?
n = num. of observations
k = num. of regressors
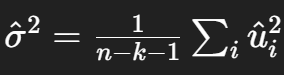
Why divide by n−k−1 instead of n?
Because we lose k+1 degrees of freedom when estimating parameters (intercept + slopes); this correction makes σ^2 unbiased
What does a standard error measure?
It shows how much an estimated value (like a sample mean or regression coefficient) would vary if you repeated the sample many times
How precise your estimate is
What happens to SE when you double N?
It shrinks roughly by 1/sqrt(2)
What are the null and alternative hypotheses in regression?
Null hypothesis (H₀): The coefficient equals zero → the variable is statistically insignificant (no effect on Y)
Alternative hypothesis (H₁): The coefficient is not zero → the variable is statistically significant (has an effect on Y)

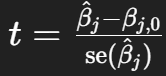
What is the t-statistic?
It measures how many standard errors (SE) the estimated coefficient is away from zero.
In other words, it shows how strong the evidence is against the null hypothesis.
👉 Formula:
t = (β̂ − 0) / SE(β̂)
👉 Interpretation:
Large |t| → coefficient likely significant (real effect)
Small |t| → coefficient likely insignificant (random noise)
What does a p-value represent?
The probability, assuming H0 true, of observing a t-statistic as extreme or more extreme than the one obtained
Rejection rule using p-values?
Reject H0 if p-value < significance level (α)
1%, 5% (most common) or 10%
Rejection rule using critical values?
Reject H0 if ∣t∣>cα/2, df, where c is the critical t-value
Typical significance and confidence levels?
1% (99% confidence), 5% (95%), and 10% (90%)
Difference between statistical significance and economic significance?
Statistical significance measures how unlikely a result is under H0
Economic significance measures whether the effect size matters in real terms
What extra assumption (MLR.6) is needed for exact t-tests?
Normality of errors: ui∼iid N(0,σ2)
What happens when sample size increases?
t-distribution converges to Normal
Normality of Errors becomes less critical
What’s the connection between confidence intervals and hypothesis tests?
If a 100(1−α)% confidence interval for βj excludes βj,0, we reject H0 at significance level α
If β^SAT = 0.0057 and se=0.0027, what is t?
t = 0.0057 / 0.0027 = 2.16
Difference between unbiasedness and statistical significance
Unbiasedness: The estimate is correct on average across many samples
Statistical significance: The estimate in this sample is unlikely due to chance (large t, small p-value)
👉 Unbiased = long-run accuracy
👉 Significant = strong sample evidence
What are Type I and Type II errors?
Type I: rejecting a true null (false positive)
Type II: failing to reject a false null (false negative)
Significance level = probability of Type I error.
What is the relationship between an F-statistic and a t-statistic in a regression with one restriction?
F=t2
For a single-parameter test, the F-test and t-test are equivalent and yield identical p-values
What does the F-statistic test in regression output?
It tests whether a set of coefficients (often more than one) are jointly zero
whether the included regressors explain significant variation in y
How do you interpret a large F-statistic?
A large F means the null hypothesis (that all tested coefficients equal zero) is unlikely given the data
Indicating at least one regressor in the group is statistically significant.
What is the null and alternative in an F-test for overall significance?
H0: β1 = β2 =...=βk = 0 vs 𝐻𝐴: at least one 𝛽𝑗 ≠ 0
What does the homoskedasticity assumption (MLR.5) state?
The variance of the error term is constant across all levels of the explanatory variables: Var(u∣x)=σ2
What does the Breusch–Pagan (BP) test check for?
It tests whether the squared residuals are systematically related to the explanatory variables — evidence of heteroskedasticity
How do you interpret the BP test?
If the p-value is small (e.g., <0.05), reject the null of homoskedasticity ⇒ evidence of heteroskedasticity
If the p-value is large, we fail to reject constant variance
What are the consequences of heteroskedasticity for OLS?
OLS estimates remain unbiased and consistent, but no longer efficient (not minimum variance), and standard errors become biased, leading to invalid inference
When is an OLS coefficient unbiased?
When the regressor is uncorrelated with the error term: Cov(xj,u)=0
A p-value = 0.23 means that the null hypothesis is rejected with probability 23%. True or false?
❌ False. The p-value is the probability of observing data as extreme or more extreme than your sample result if the null hypothesis is true. It is not the probability that the null is true or false
What does a p-value of 0.23 actually tell you?
If H0 were true, you’d see a test statistic this large (or larger) about 23% of the time. This is not rare ⇒ fail to reject H0