Quiz 2 - t Tests
1/18
There's no tags or description
Looks like no tags are added yet.
Name | Mastery | Learn | Test | Matching | Spaced | Call with Kai |
|---|
No analytics yet
Send a link to your students to track their progress
19 Terms
what is a t-test?
what are the different types? (3)
an inferential statistics for determining if there is a difference between two means
dif types
one-sample t test
dependent-samples t test
independent-samples t test
what is a one-sample t test?
give some examples.
difference between sample mean and population mean, i.e., a different between M and u
examples:
Is there a difference in SAT scores between Californians versus Americans?
Is there a different in conscientiousness between people in their 20s versus people in general?
Is there a difference in working memory capacity between those with ADHD versus the general population?
what is a dependent-samples t test?
give some examples.
Difference between 2 samples that are related to each other; also known as paired- or related-samples t test
Examples
Is there an increase in test performance from before to after an academic intervention?
Is there a change in depression from before to after psychotherapy?
Is there a difference between a group’s language and math GPA scores?
what is an independent-samples t test?
give some examples
difference between 2 samples that are unrelated to each other
examples:
is there a difference in test performance between those who did and did not have an academic intervention?
is there a difference in depression between those who did and did not receive psychotherapy?
is there a difference between two groups’ language GPA scores?
how do you calculate all the different degrees of freedom of the different t-tests?
one-sample t test df: n-1
dependent-samples t test df: n-1
independent-samples t test df": n-2
what assumptions are made related to t-tests?
all t tests assume normality in the population distrbution
t-tests are robust to a violation of thiss assumption, especially with samples sizes > 30. Values between -2 and +2 for skewness and kurtosis are acceptable for a normal univariate distribution
what is an additional assumption made by independent-samples?
t tests have an additional assumption — the assumption of homogeneous variances i.e, that the dispersion of scores for one population is equal to the dispersion of scores in the other population
Levene’s test evaluates the homogeneity assumption for t tests and ANOVAs in SPSS. When you have heterogenous variances (i.e., when p < .05), that t test gives you Welch’s solution on the SPSS output to use instead
what is effect size?
a measure of the magnitude of a relationship between variables
virtually any difference between groups is statistically significant with large enough samples but necessarily important
note: effect size informs if a statistically significant results is meaningful or important
what is cohen'‘s d?
what are the different effect size categories?
a common measure of effect size for t tests.
Guidelines
x < .2 = trivial effect size
.2 < x < .5 = small effect size
.5 < x < .8 = medium effect size
x > .8 = large effect size
what is a confidence interval?
a range with a probability that a parameter is included in that range
how can you use confidence intervals for one-sample t tests?
You can use confidence intervals to calculate the population mean if you don’t have it
ex. 95% CI [42.76,48.76]
Interpretation: There is a 95% probability that the interval 42.76 to 48.76 includes the population mean
how can you use confidence intervals for dependent t tests?
You can use confidence intervals to calculate the population mean change between samples
ex. 95% CI [1.22,3.65]
Interpretation: There is a 95% probability that the interval 1.22 to 3.65 includes the population mean change
how can you use confidence intervals for independent t tests?
You can use confidence intervals to calculate the population mean difference between samples
ex. 99% CI [.41,.88]
Interpretation: There is a 99% probability that the interval .41 to .88 includes the population mean difference
what factors affect significance?
DNA SAT
Difference between means
N
SD
alpha
one-versus two tailed test
how does the difference between means affect statistical significance?
the greater the difference between means, the more likely you’ll have statistical significance
e.g., a larger difference between means = larger numerator = larger t stat (more likely to exceed the critical value in the table of critical values and therefore more likely to be statistically significant
How does sample size affect statistical significance?
the greater the sample size, the more likely you’ll have statistical significance. Increasing sample size increases power.
e.g., larger N = larger t (larger test statistic). Again, a larger test stat is more likely to exceed the critical value in the table of critical values and therefore more likely to be statistically significant
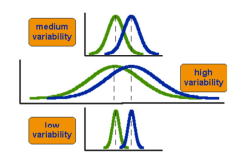
how does SD affect statistical significance?
the greater the standard deviation, the less likely you’ll have statistical significance
note: the bottom pair of distributions is most likely to statistically significant even though each pair has the same mean difference
how does the alpha affect statistical significance?
the larger the alpha (i.e., the larger the rejection region), the more likely you’ll have statistically significance
the more willing you are to make a T1 error, i.g., the higher the alpha, the more likely you’ll have significance
or, compare alpha .05 and alpha .01 critical values for any given df and you’ll see that the value for alpha 0.5 is smaller, i.e., easier for a test stat to exceed and be statistically significant
how does the difference between one tail versus two tailed test affect statistical significance?