AREC 365 (Exam 1)
 Call Kai
 Learn
Learn Practice Test
 Spaced Repetition
 Match
Match Flashcards
 Knowt Play
1/66

Earn XP
Description and Tags
lecture 3,
Name | Mastery | Learn | Test | Matching | Spaced | Call with Kai | Chat |
|---|
No analytics yet
Send a link to your students to track their progress
67 Terms
undernutrition: a four part problem
what is it, how much of undernutrition exists, what are its consequences on the invidivdual/society, how do we deal with it
what is it (defining the problem)
science
how much of undernutrition exists + what are its consequences
science and social science
how do we deal with it
policy
first thing to think about when asking “what is it”
substance obtained from food that contributes to mental or physical health or growth
6 categories fo nutrients
Carbohydrates
• Fat
• Protein
• Vitamins
• Minerals
• Water
overnutrition
person consumes too many calories (not a bug problem in developling countries)
dietary deficiency
micronutrient deficicency
vitamin A, Iodine, Iron and Zince
main focus of lecture 3
can be targetted with supplements, vitamins, etc.
micronutrient deficiency - problems that need to be addressed
a lot of people in the developing world grow their own food, so its difficult to get them the proper nutrients because they arent just buying foods injected with the supplements
people don’t know if their deficient
how can micronutrients be supplied ? what are the pros? is it a problem?
•Can be supplied through vitamin supplements
(“iodized” salt), food fortification
•Relatively inexpensive and EASY TO ADDRESS WITH SUPPLEMENTS
•Not a problem of “production and supply” of food
undernutrition (type 1)
macronutrient deficiency / protein-calorie deficiency
also known as PEM
links directly to the world food problem, because these are obtained through FOOD, PROTEINS AND CALORIES
undernutrition (type 2)
secondary malnutrition - cant absorb the food you eat
is it easy to tackle micronutrient deficiency?
it was thought so because they are cheaper to produce
but progress has not been smooth
energy and its involuntary functions
breathing, blood circulation, digestion, maintaining muscle
physcial and mental activity
fighting disease
growth
protein - what are the main sources, and what is the nutritional role of proetin
main sources: milk, meat, eggs
role:
building cells, antibodies
carry oxygen
carry nutrients
work as enzymes for digestion
HUMAN GROWTH
how are calories created?
via photosynthesis and are very available in plants
how are proteins created
harder to create than calories
nitrogren in the air is “fixed” by bacteria in the soil to create amino acids
amino acids - how many are there and how much are in food
20 amino acids
our body makes 11
9 we get from food
animal / plant products - what amino acids do they have
animal products - they have all 9 “complete proteins”
plant - missing some / low in concentration
not “complements” - we need all of them
diets in developing countries are more likely to fufill PROTEIN or CALORIE requirements?
protein! so to solve under nutrition, we need MORE FOOD
main source of energy/calories
carbohydrates (rice, bread)
fats (meats, oil)
proteins give use some energy
protein consumption vs heights
studies show that more protein - male heights increase acorss the world
does this imply a casual relationship?
what else could be going on here?
big question of lecture 3
how large are the society-wide impacts of better nourishment (the SECOND PART of the 4-part problem)
how to measure undernourishment
clinical assement (only useful for advanced undernutrition)
biochemical assessment (precise but $$)
dietary assessments - what are they and how are they completed and what can be a problem
done via SURVEYS (asks people about what they ate)
calorie/protein content of food is calculated
some loss of precision in conversion from food item to nutrient
subject to “recall bias” based on what people remember correctly
solution ot dietrary assessments
have an enumerator record what you eat (they watch you) - but may suffer from the experimenter demand effect
hawthorne effect / experimenter demand effect
people may change behavior because they are being observed
anthropometric assessment
“science of measuring the human body and its parts”
human body SIZE is linked to MACRONUTRIENT INTAKE
3 measures of undernutrition
wasting, stunting and underweight
wasting
low weight for height
Reflects current/acute undernutrition
• Think famines
stunting
low height for age
• Reflects long-run undernutrition (often maternal)
• Vietnam – children born during war are shorter
than those born before
underweight (low weight for age)
Reflects a little bit of chronic and a little bit of current
• Why?
• You could be short and thus underweight
• You could be in a famine and also underweight
why is anthropometry used so commonly?
Inexpensive to measure age, height, weight
• Does not require level of training required
for clinical diagnosis
• No recall bias or Hawthorne effect
Reflects both short-run and long-run undernutrition
heights: nature vs nurture
Bit of both!
• Nature – what is the maximum potential height of person?
• Nurture – how likely is it that a person will achieve that height?
How do we know what appropriate heights and weights are?
measurement is done as a comparison in 3 steps
step 1 of measurement
measure anthropometric indicator of invididuals
step 2 of measurement
Compare with a “reference group”:
• Averages across similar people (age, gender ethnic group)
• The reference group is our “standard”
• Make sure that these groups are correctly selected
step 3 of measurement
Determine based on the difference
• How do we determine how different is worth worrying about?
percentiles
if someone is in the 75th/100 group, that your in the 75th percentile (meaning you are ABOVE 3-quarters of the other people, or than 3-quarters BELOW her)
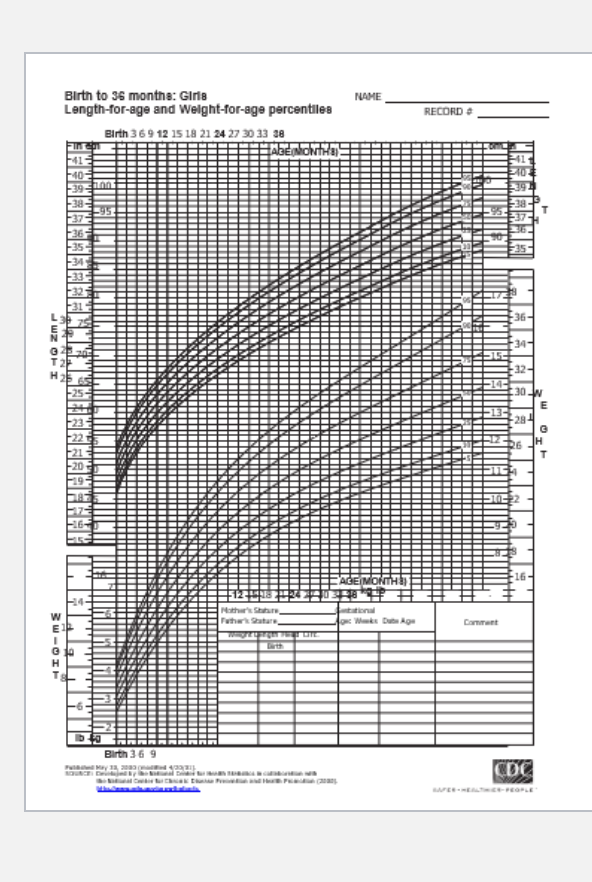
growth chart percentiles
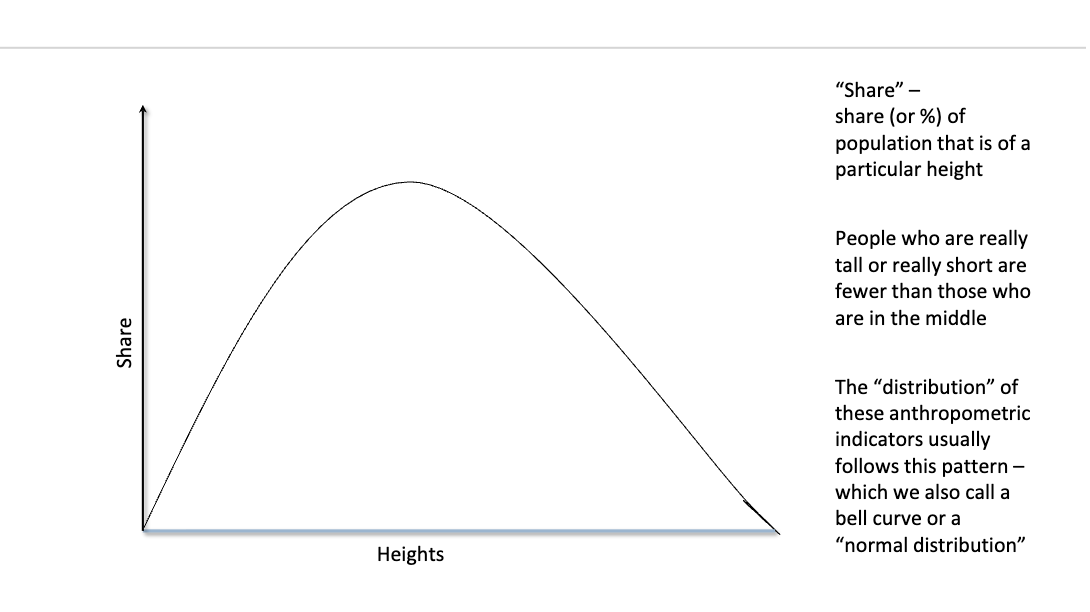
normal distribution between heights and % of people of that height
z-score slides
find the mean
find the standard deviation (Say its 2 cm)
flatter the curve, the higher the SD
1 sd = 2 cm away from the mean on both sides, etc.
z-score formual
[x-(Mean)] / (Standard Deviation)
normal distribution and standard deviations

who classifies for under nutrition in terms of z-scores
a) -1 to -2: Mildly undernourished
(b) -2 to -3: Moderately
undernourished
(c) -3 and beyond: Severely
undernourished

z-score changes

how much should we eat to be healthy?
measure how much you can eat
see what the reference population (aka healthy population) eats and see where you fall
how much you eat depends on:
What your current height/weight/age is
• How much you exercise
• How good your metabolism is
reference population variation
Different persons have different levels of each in the reference population
• Once more, we have a “distribution” of how much the reference
population eats
RDA
recommended dietrary allowance
the amount of food required to keep 97.5 of the population nutrition satisifed
how to calculate RDA
Basically, plot the distribution of how much reference population eats
• Pick the amount of food that will satisfy all but the top 2.5%
• If you are eating above that amount, you are likely to be
over-eating
EAR
estimated average requirement
the amount fo food required to keep half the population nutrition satifisfied
calculaing ERA
Calculate the mean food intake of the population
• If you are eating above this mean, you are probably eating enough
• If you are eating WAY below this mean, you may be undernourished
measuring nutritional status of large groups
nationally representative sample survyes
look at mass undernutrition indicators
create “food balance sheets”
“food balance sheets”
Look at the total supply of food items in a country
• Production, existing buffers, net imports
• Estimate calorie/protein supply per person per day
The main type of undernutrition to worry about from the food problem’s perspective is
protein- energy malnutrition
The best way to measure undernutrition is via
anthropometric measures
All measurement relies on defining
appropriate reference groups and then comparing with those