Lec 12 descriptive stats II
1/23
There's no tags or description
Looks like no tags are added yet.
Name | Mastery | Learn | Test | Matching | Spaced | Call with Kai |
|---|
No analytics yet
Send a link to your students to track their progress
24 Terms
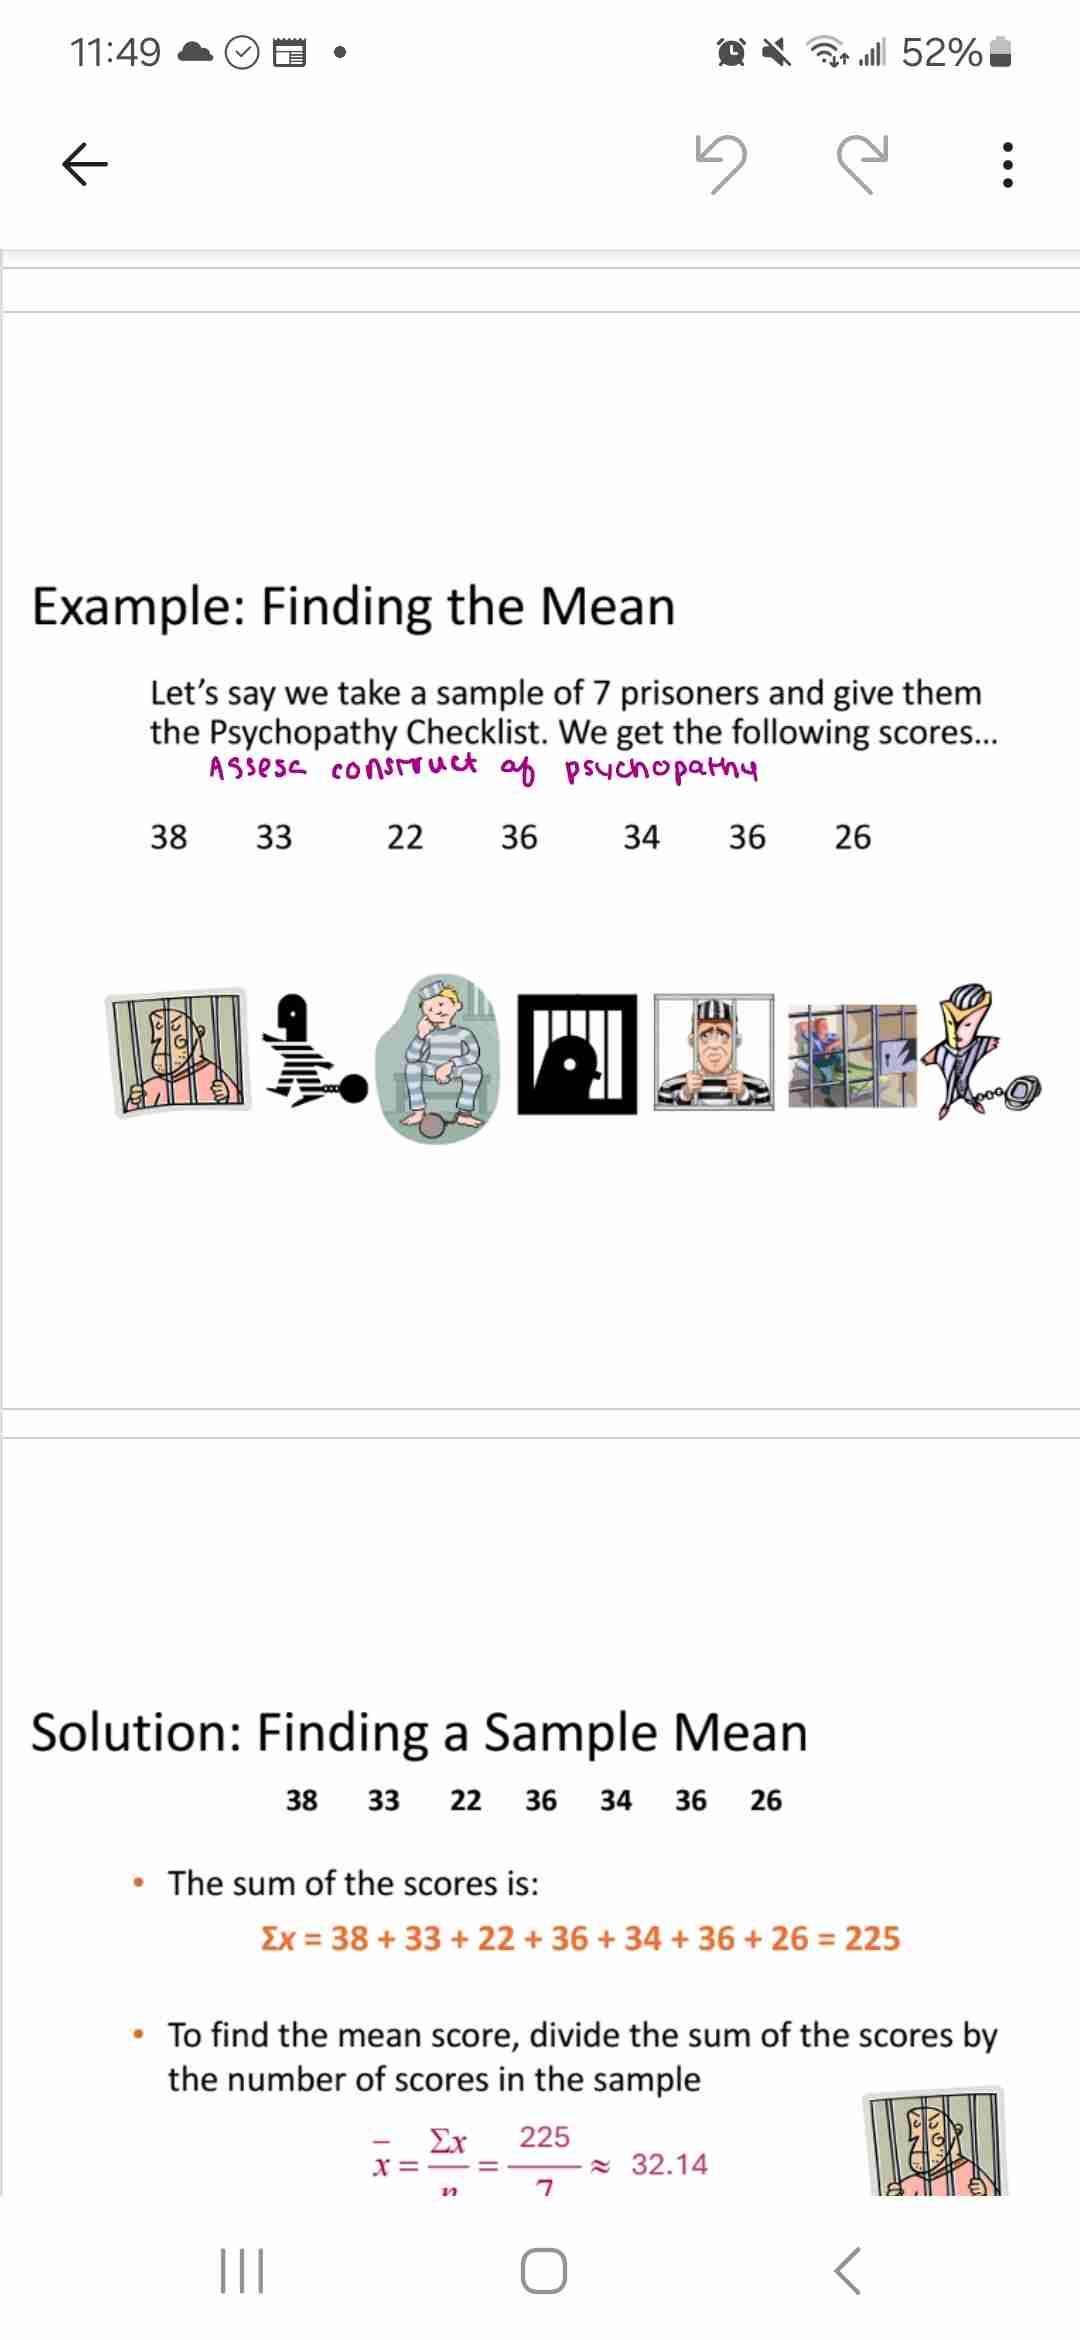
2 most common ways to summarize data
Central tendency and measures of variability
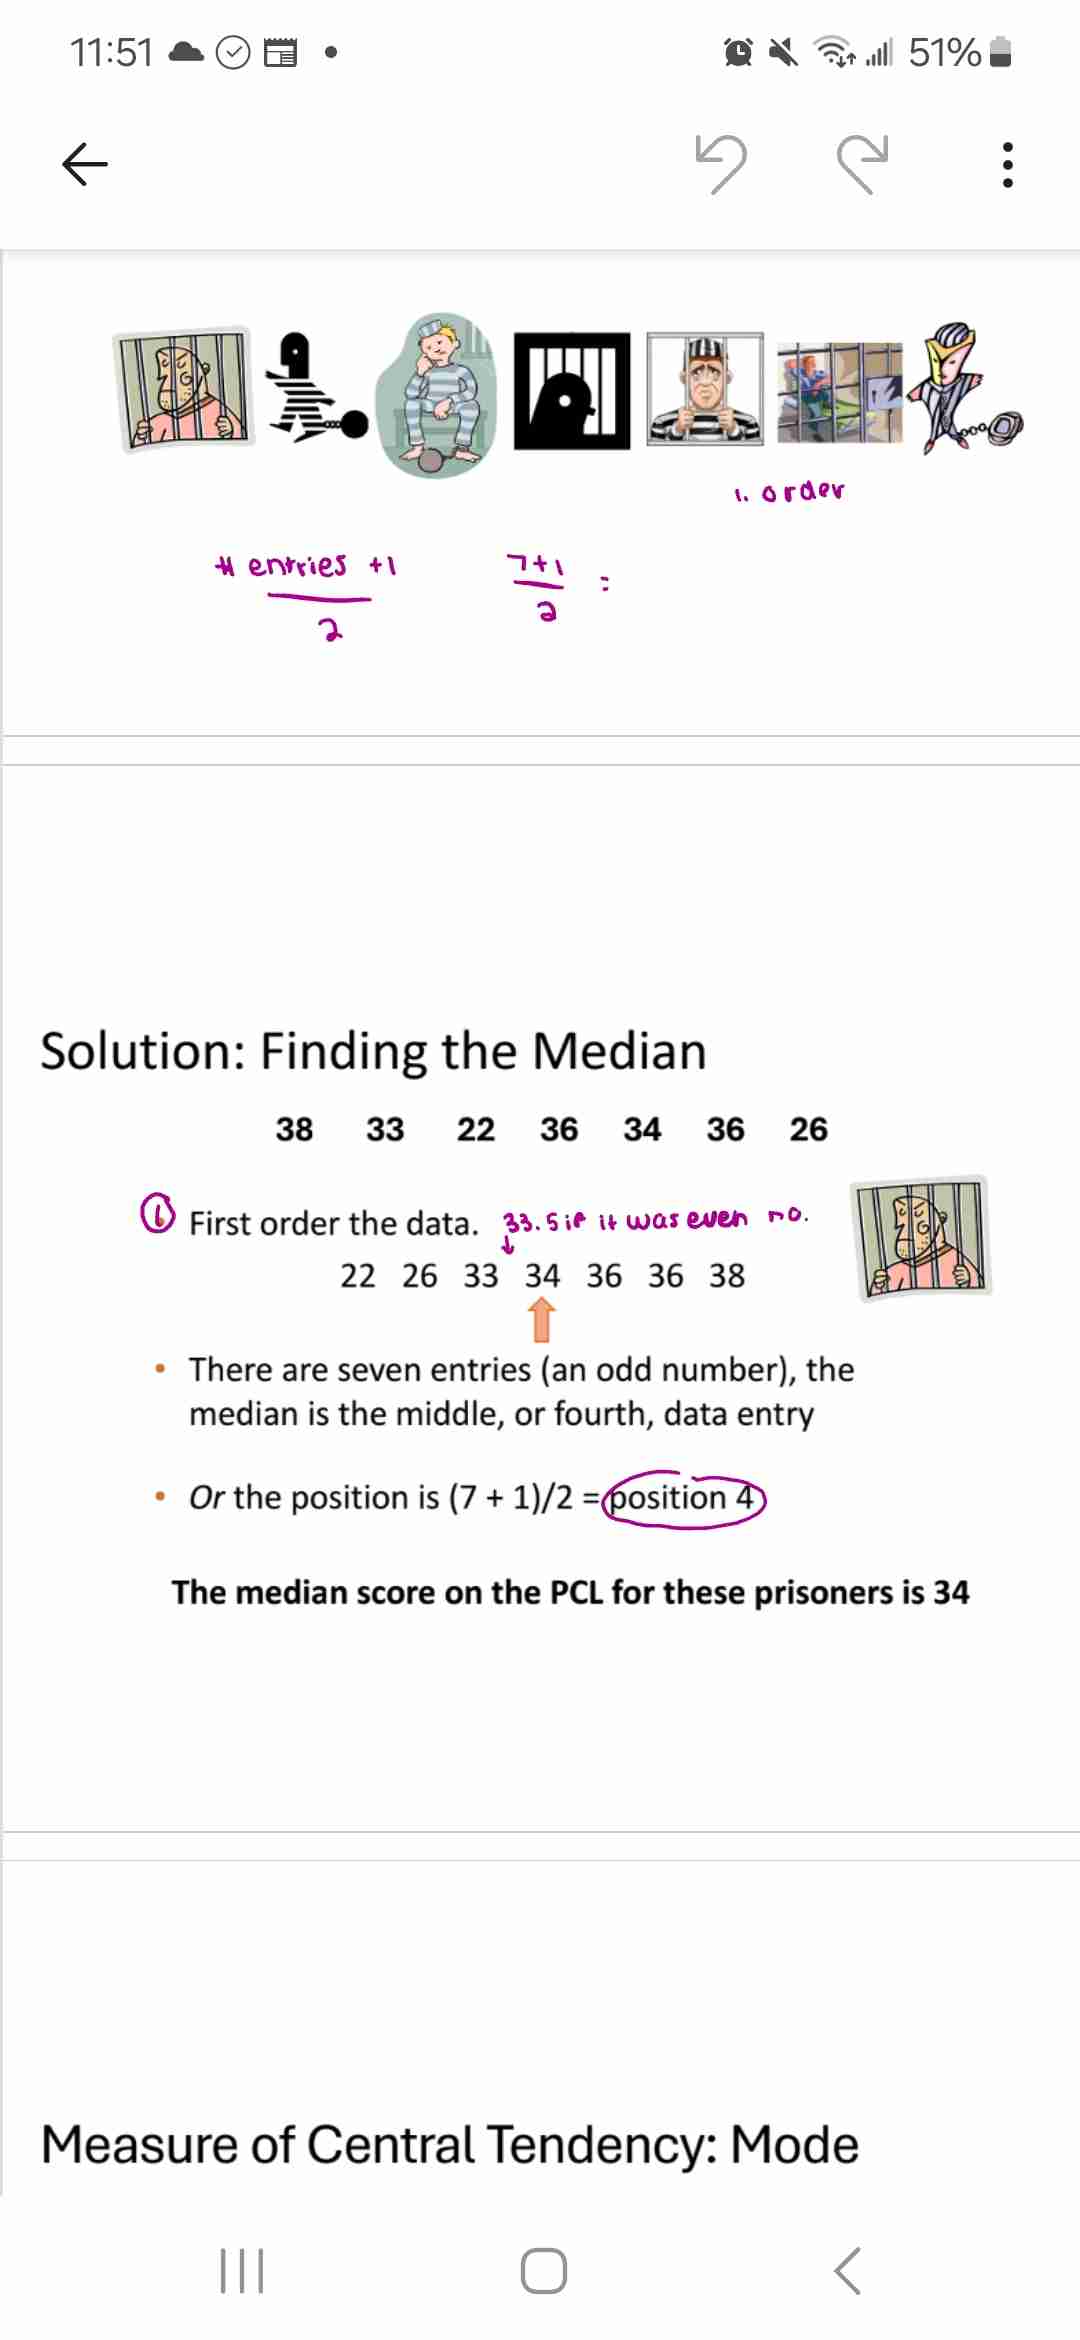
Median
Value in center of data when ordered
(No of entries +1)/2
If even no of entries, use mean of 2 enter ones
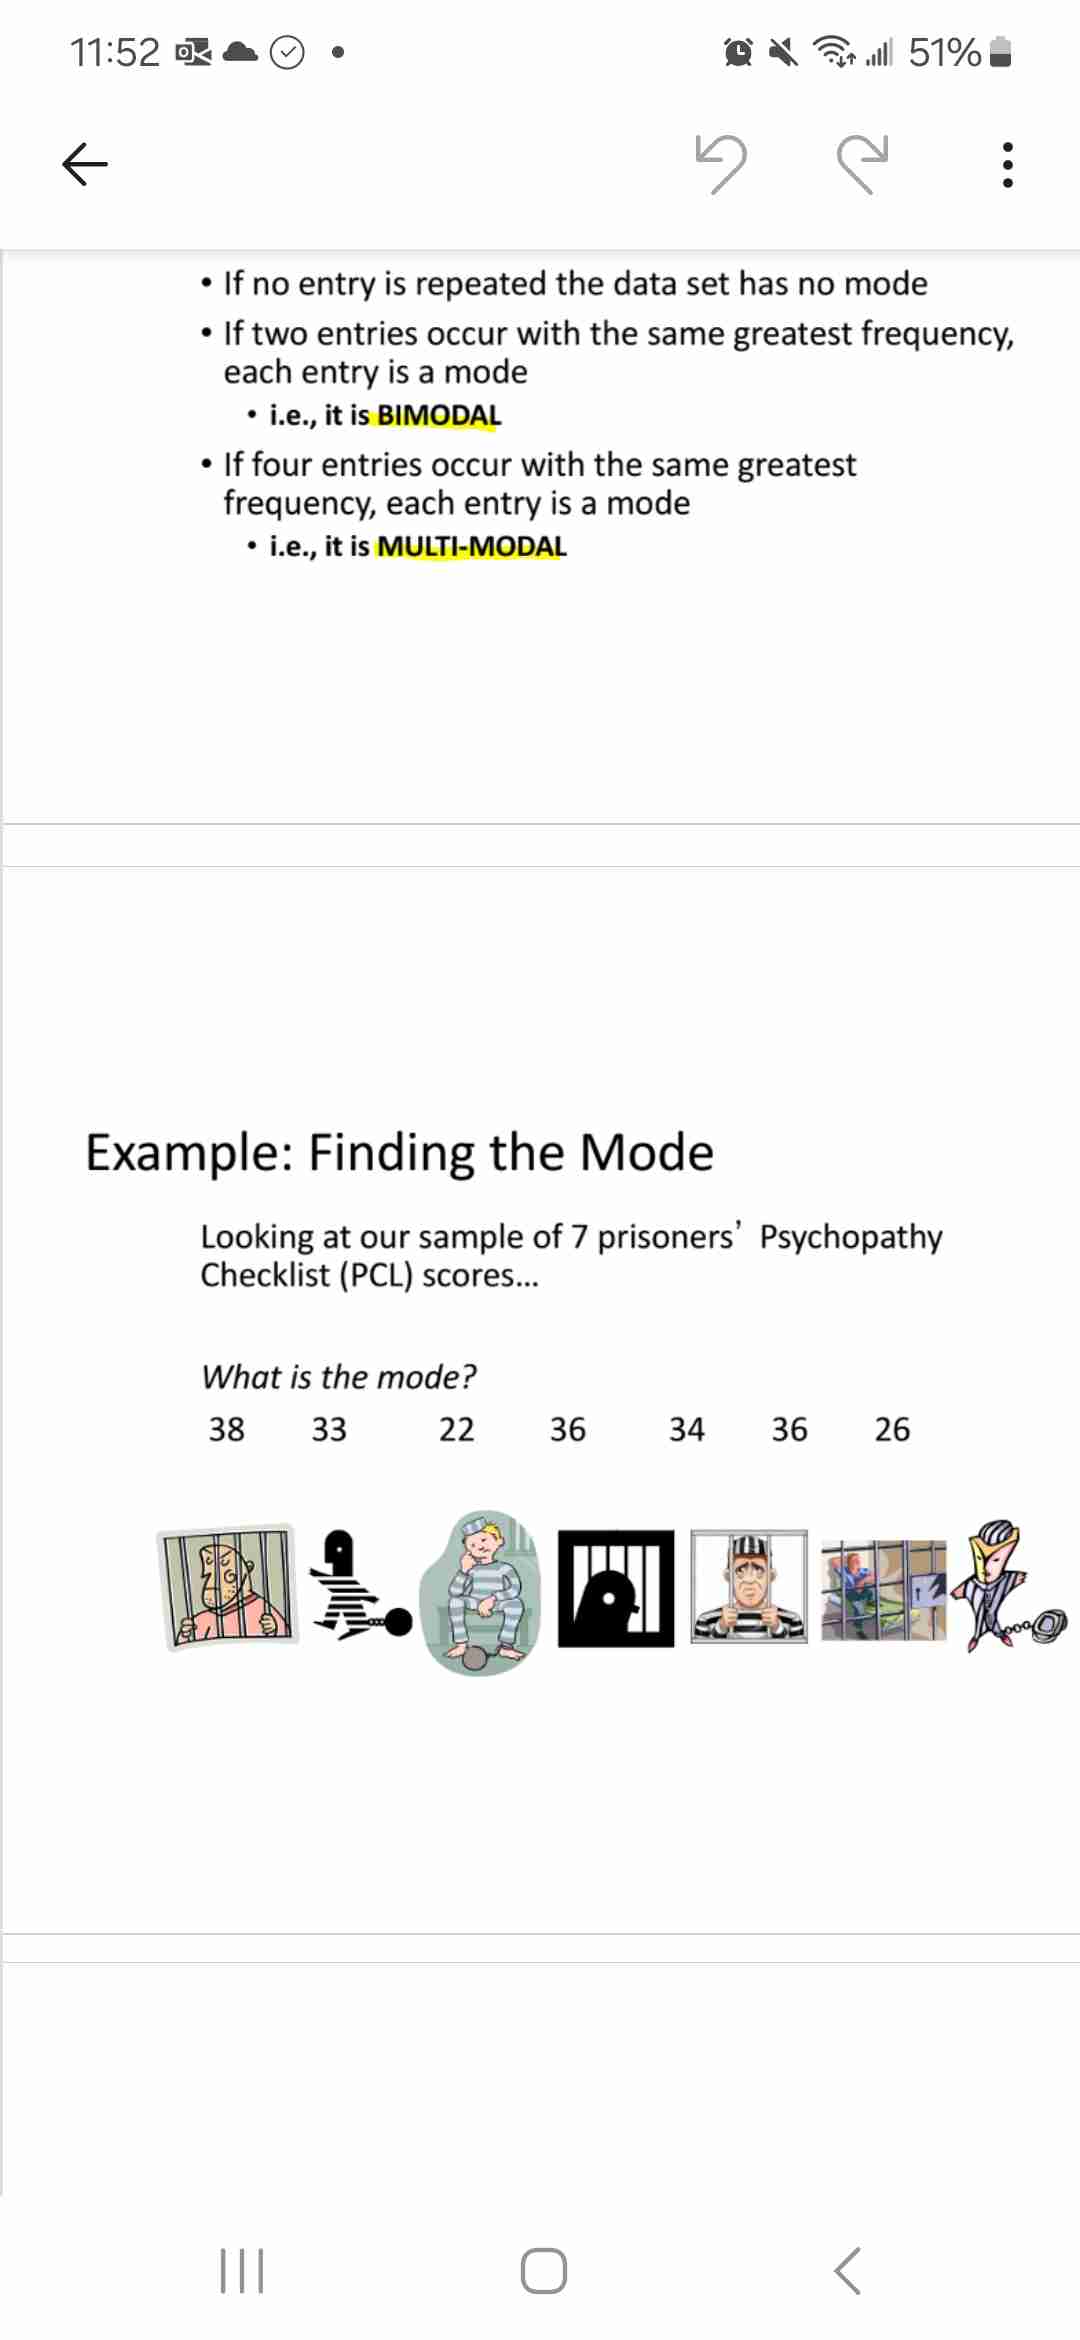
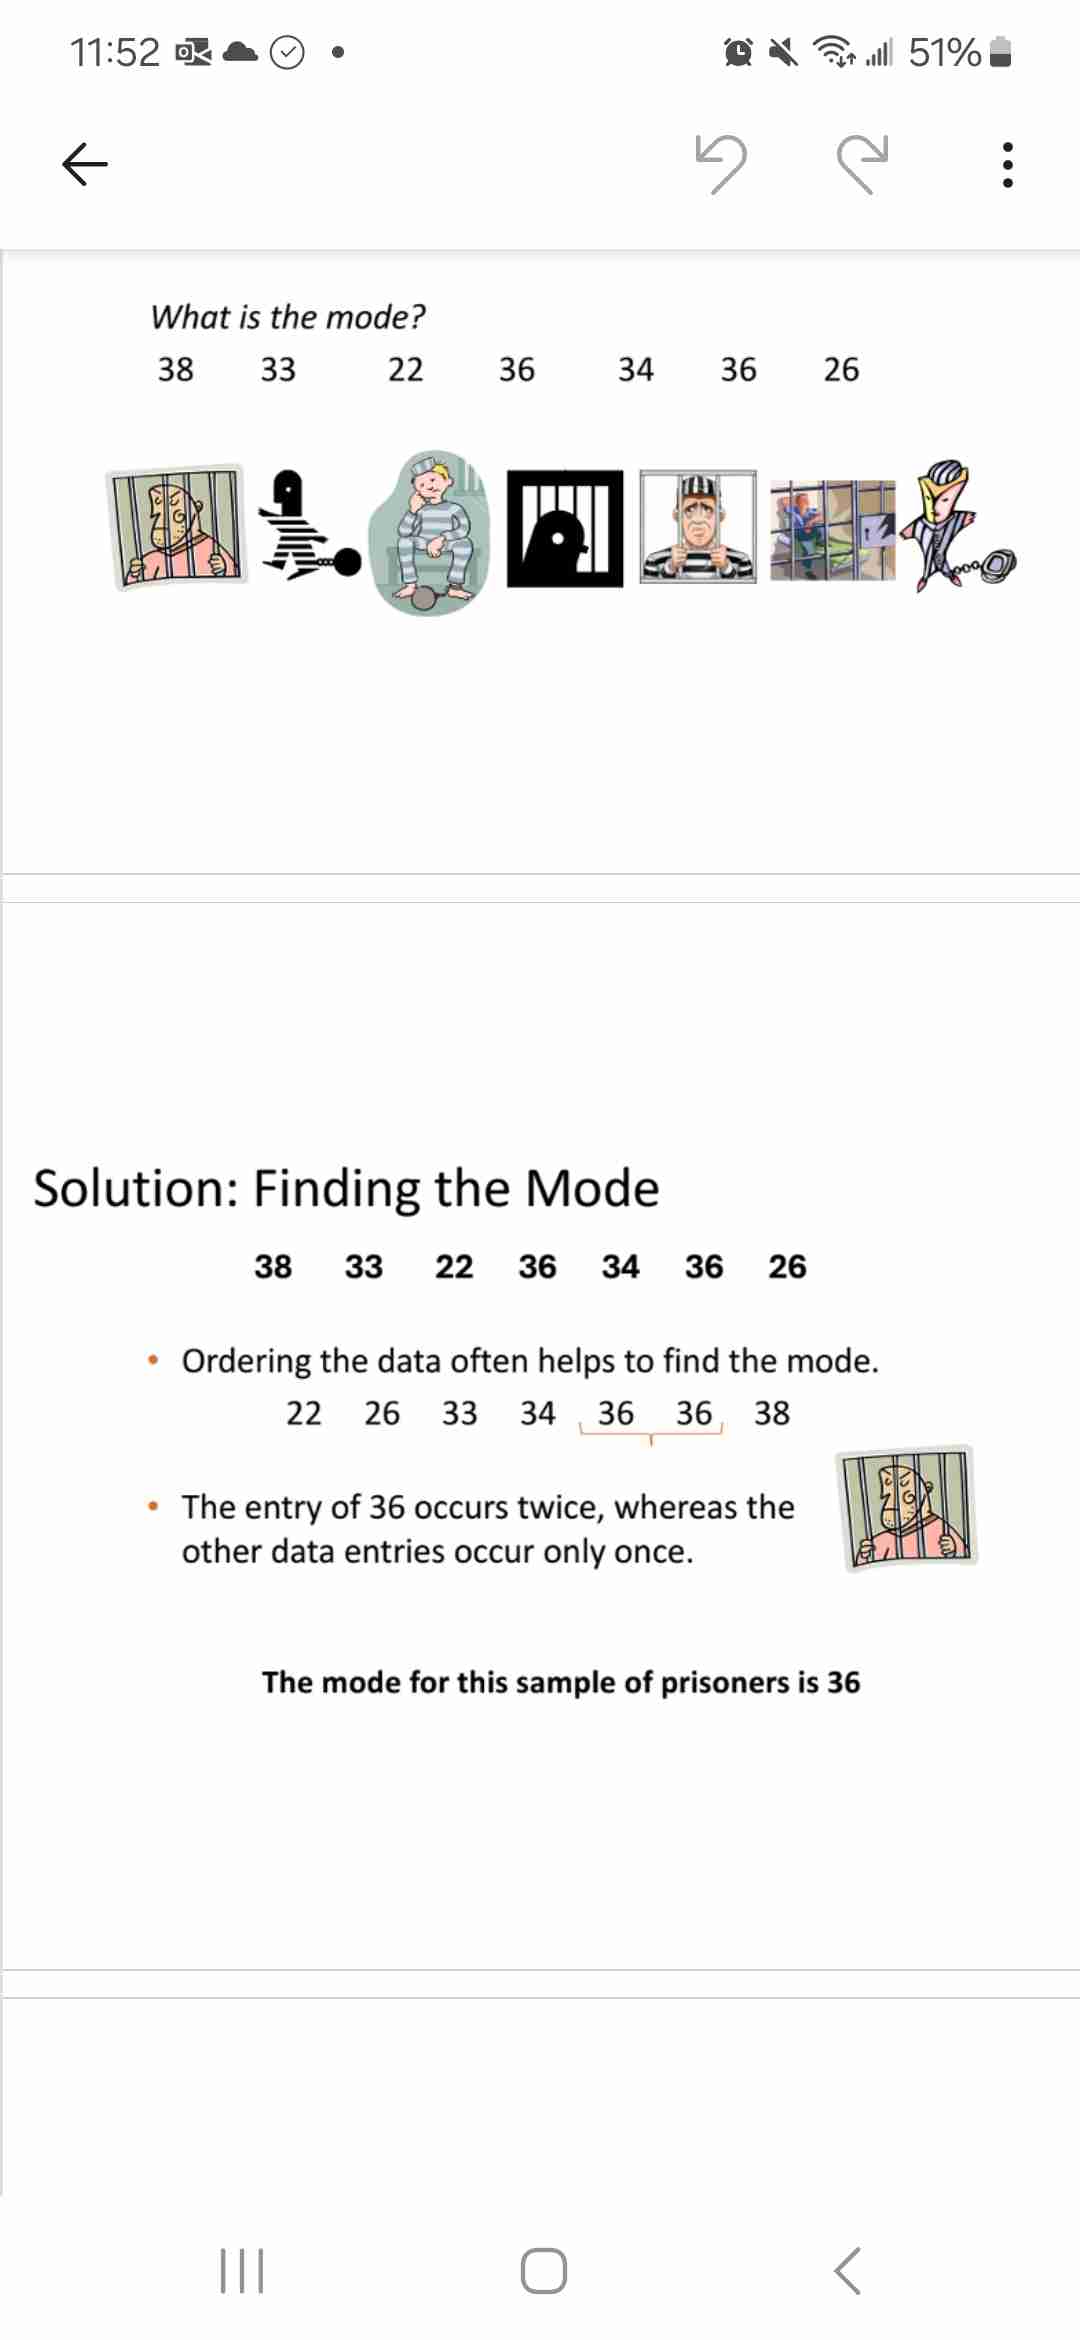
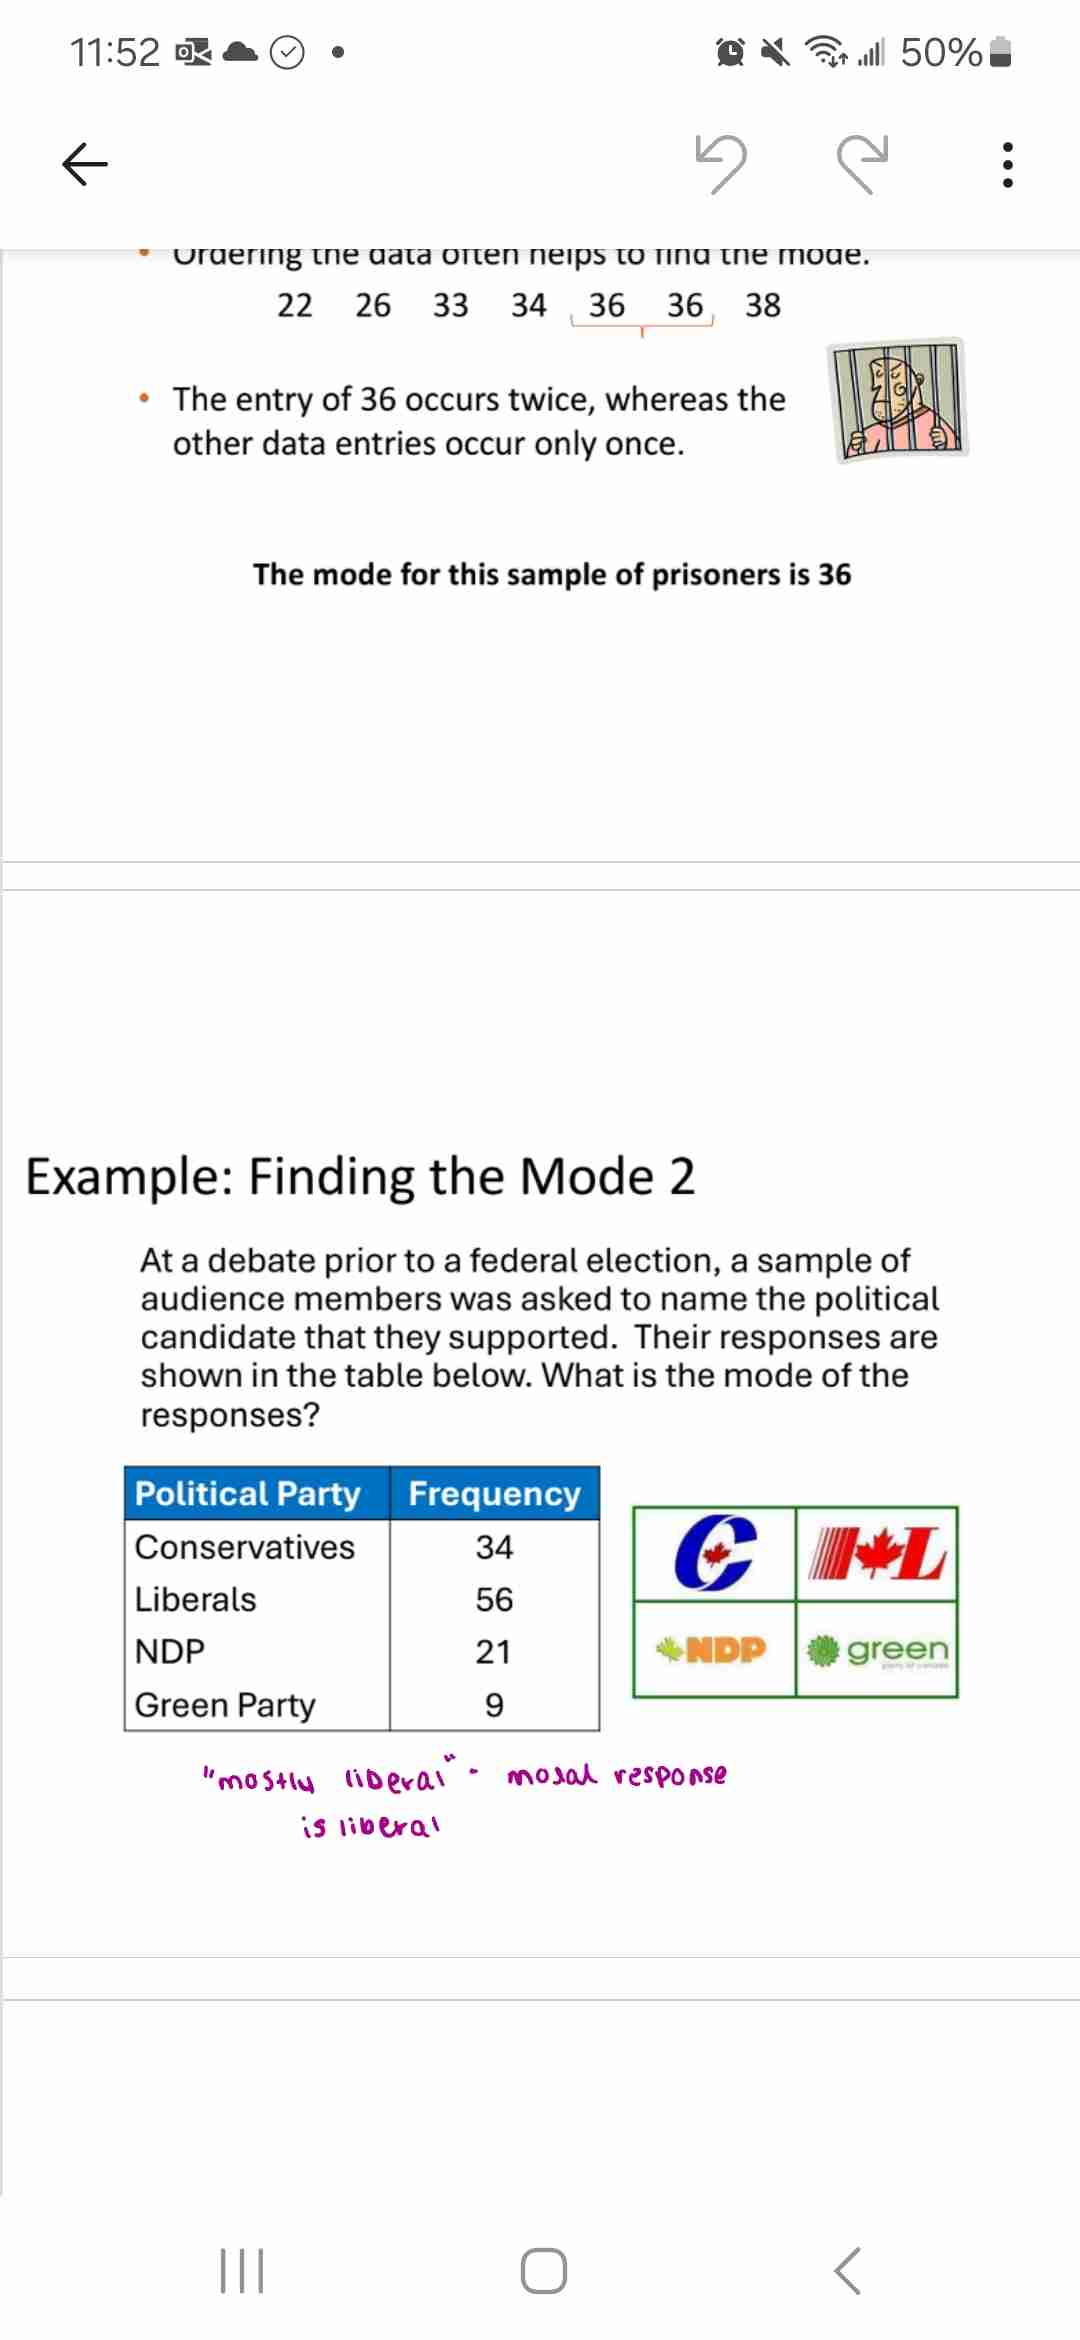
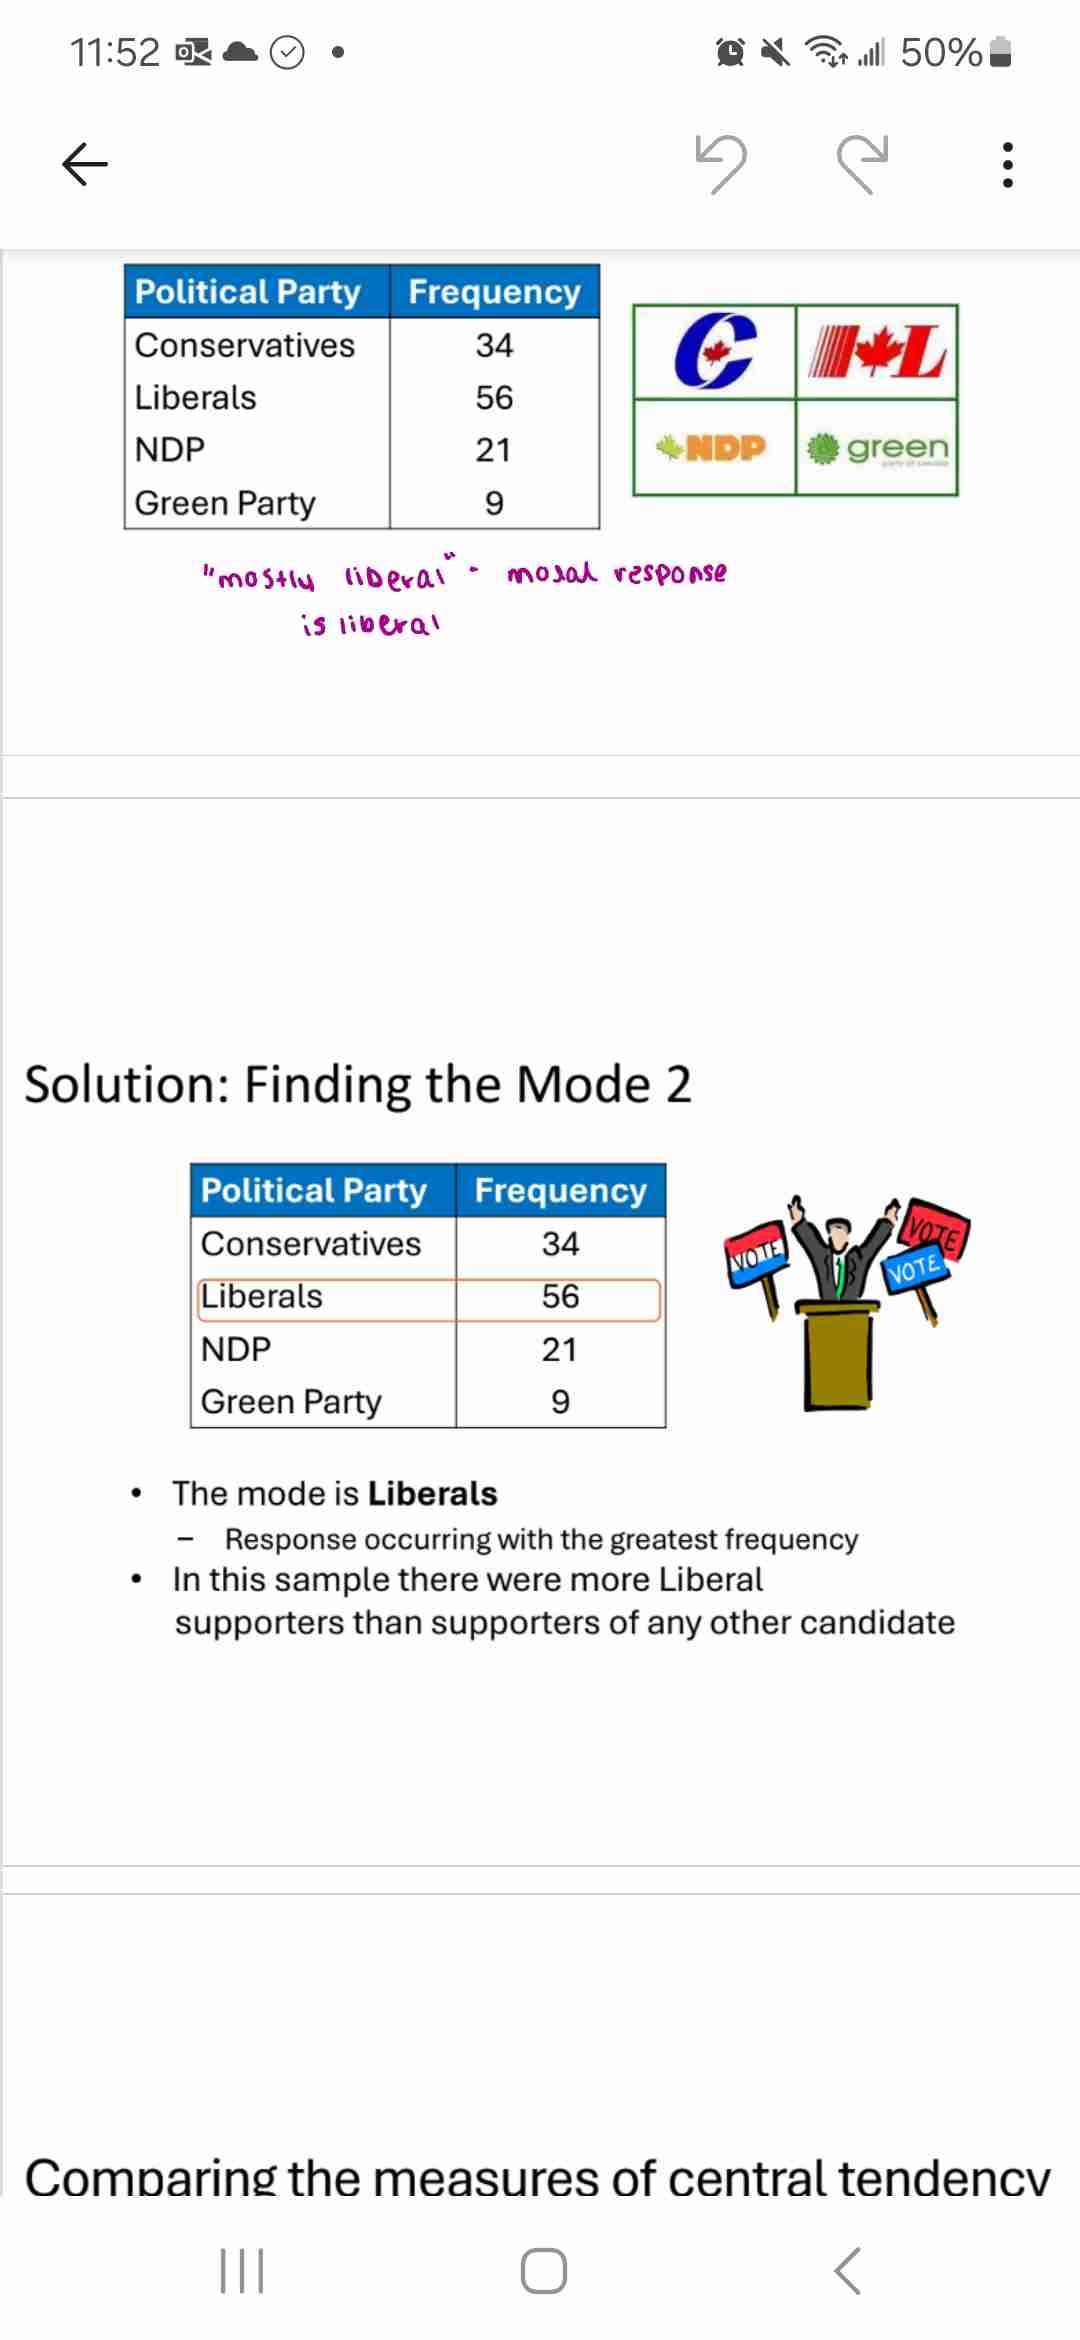
Mode
Most frequent value
If none repeat, 0 mode
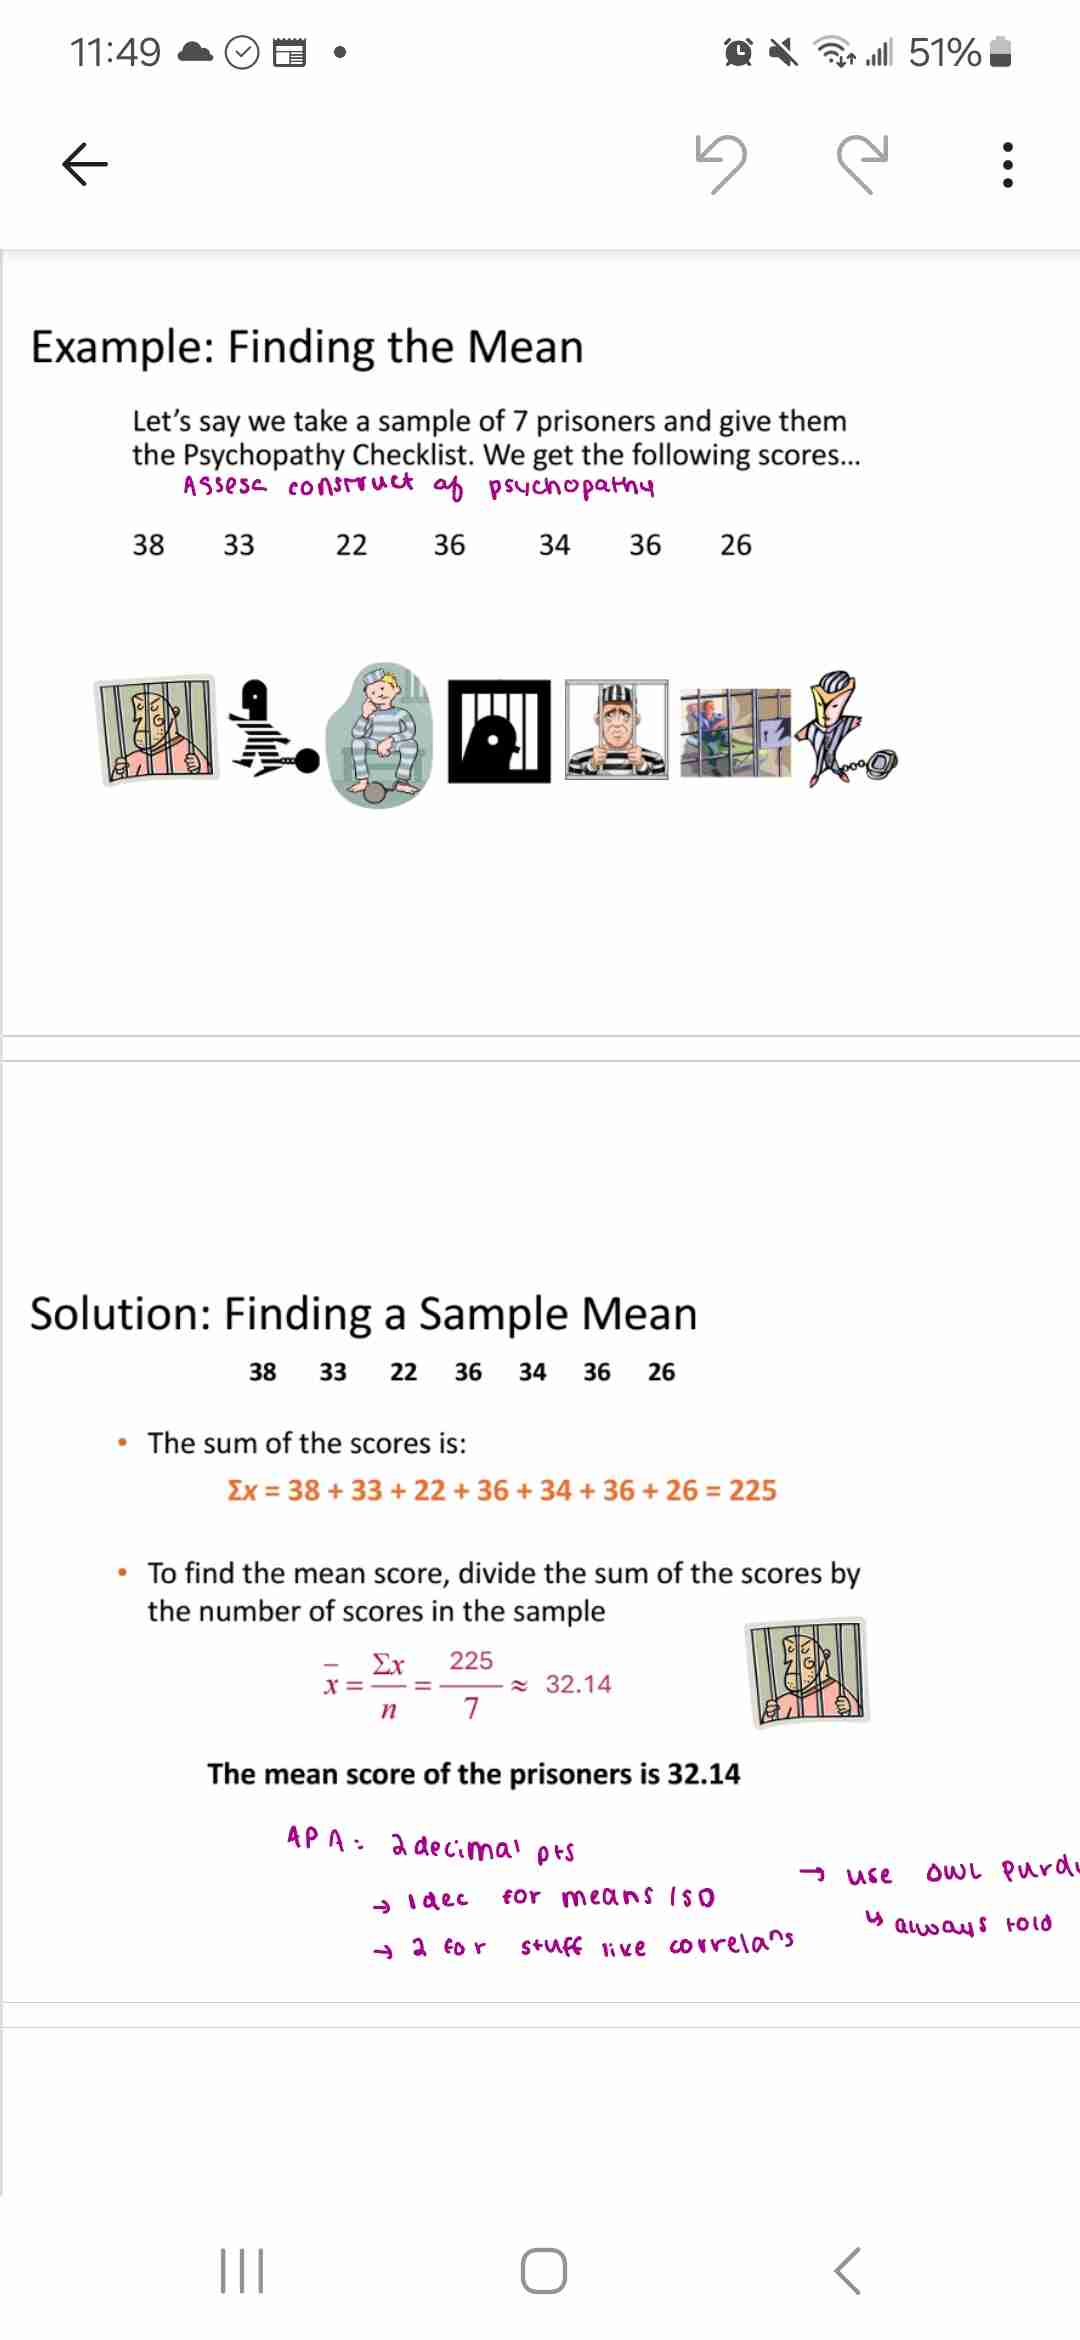
Dis/advantages of mean
+: common, account for every data set
- : affected by extreme scores and lose indiv data
Dis/advantages of median
+: little influence by extreme scores, realistic middle score
-: maybe bad to ignore extreme data
Dis/advantages of mode
+: freq obtained, not affected by extreme scores
-: may not rep whole of scores, ignore extreme data
Measures of variability and inclusions
How spread out data is
Range (iqr)
Deviation
Variance
Sd
Range
Biggest to smallest scores
Sensitive to
Sample size (smaller, less range)
Extreme scores
Inter quartile range
Dist btw 1st and 3rd quartile
Include just the middle 50% of values q3-q1
Positive: not affected by extremes
Median: 2nd quartile
75% scores fall above 1st quart, 25% below
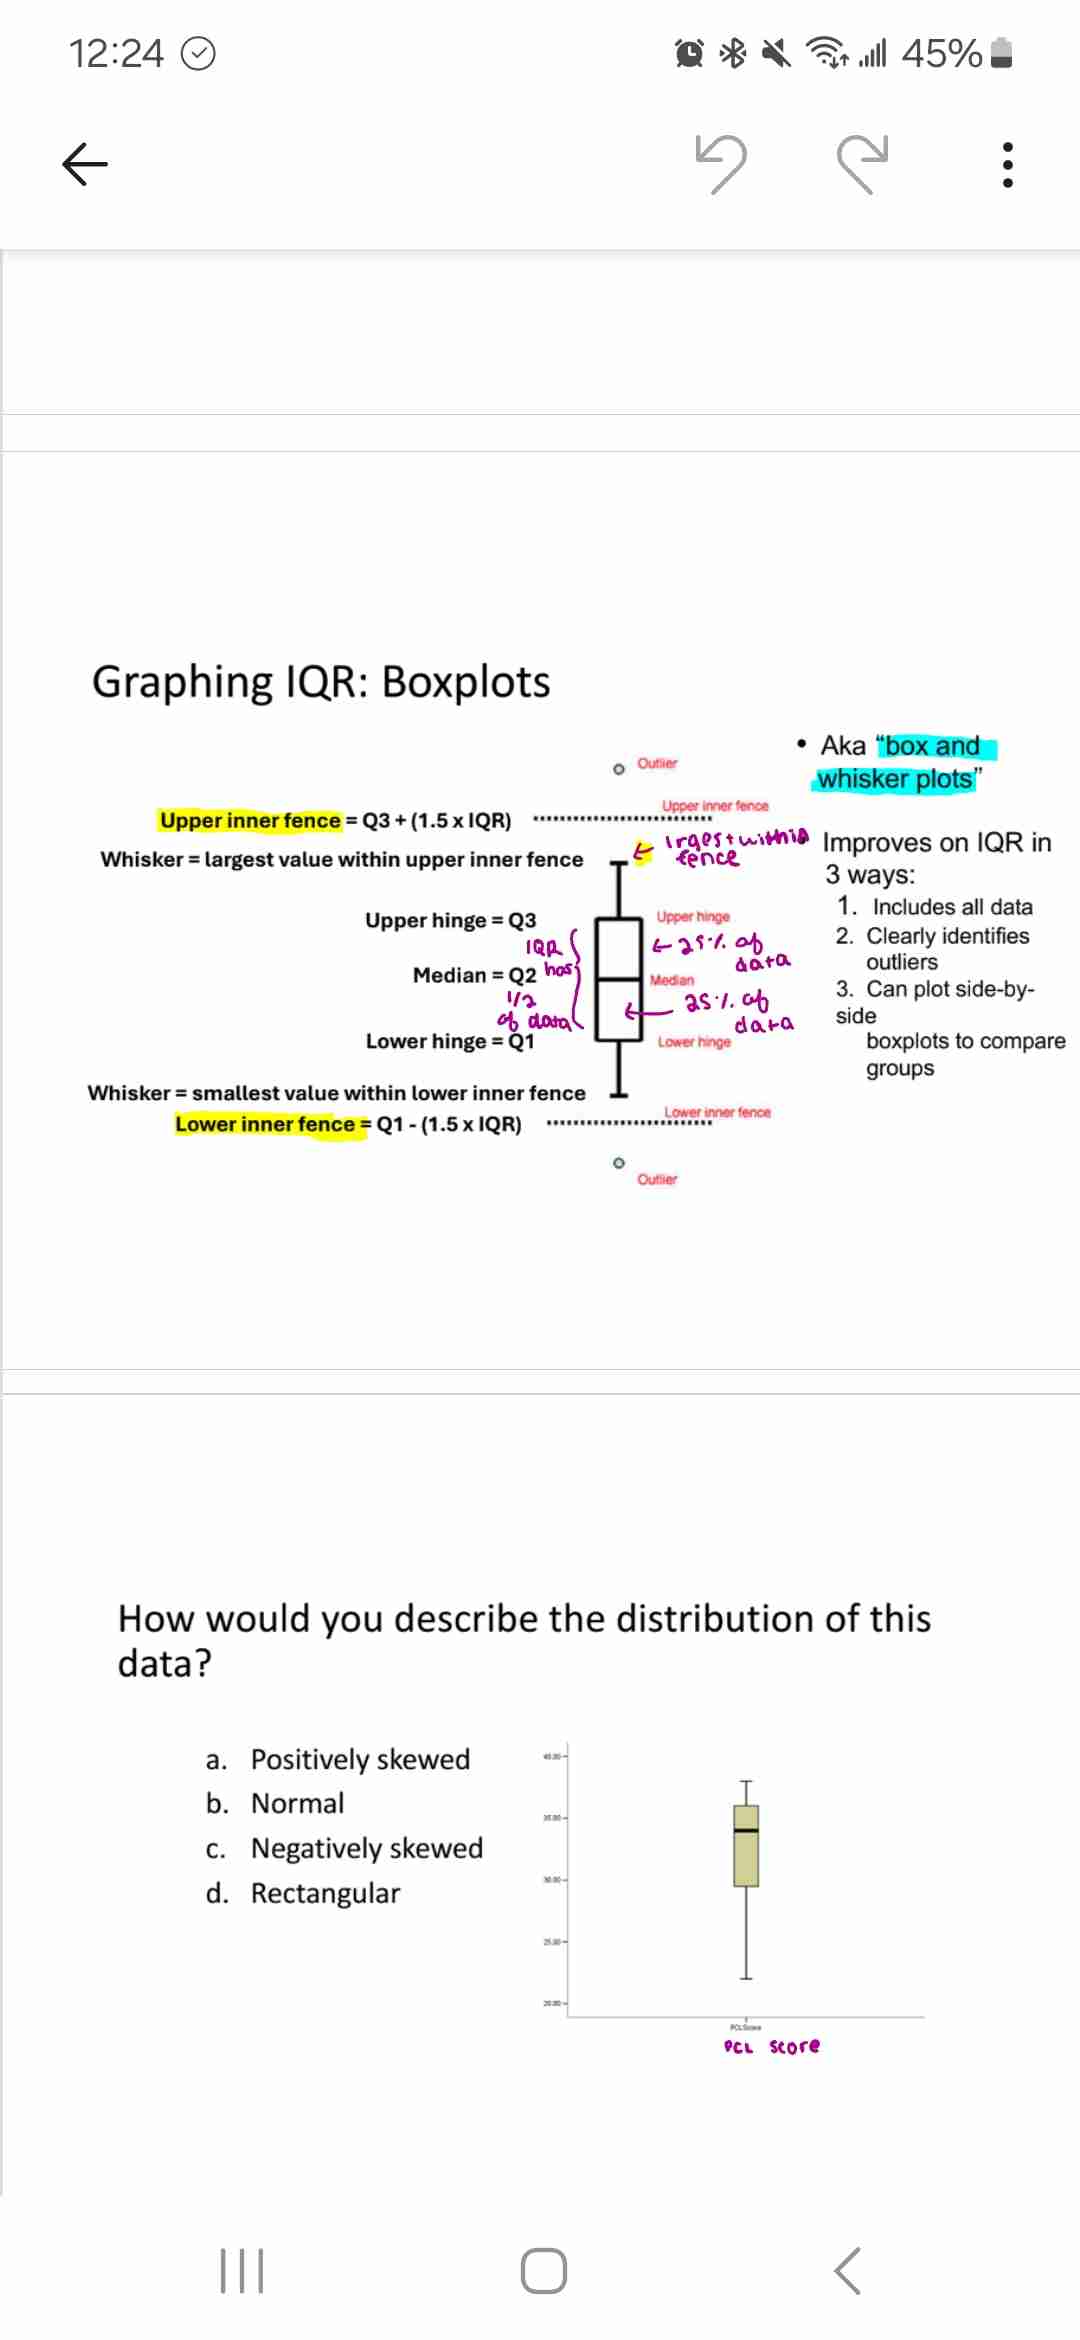
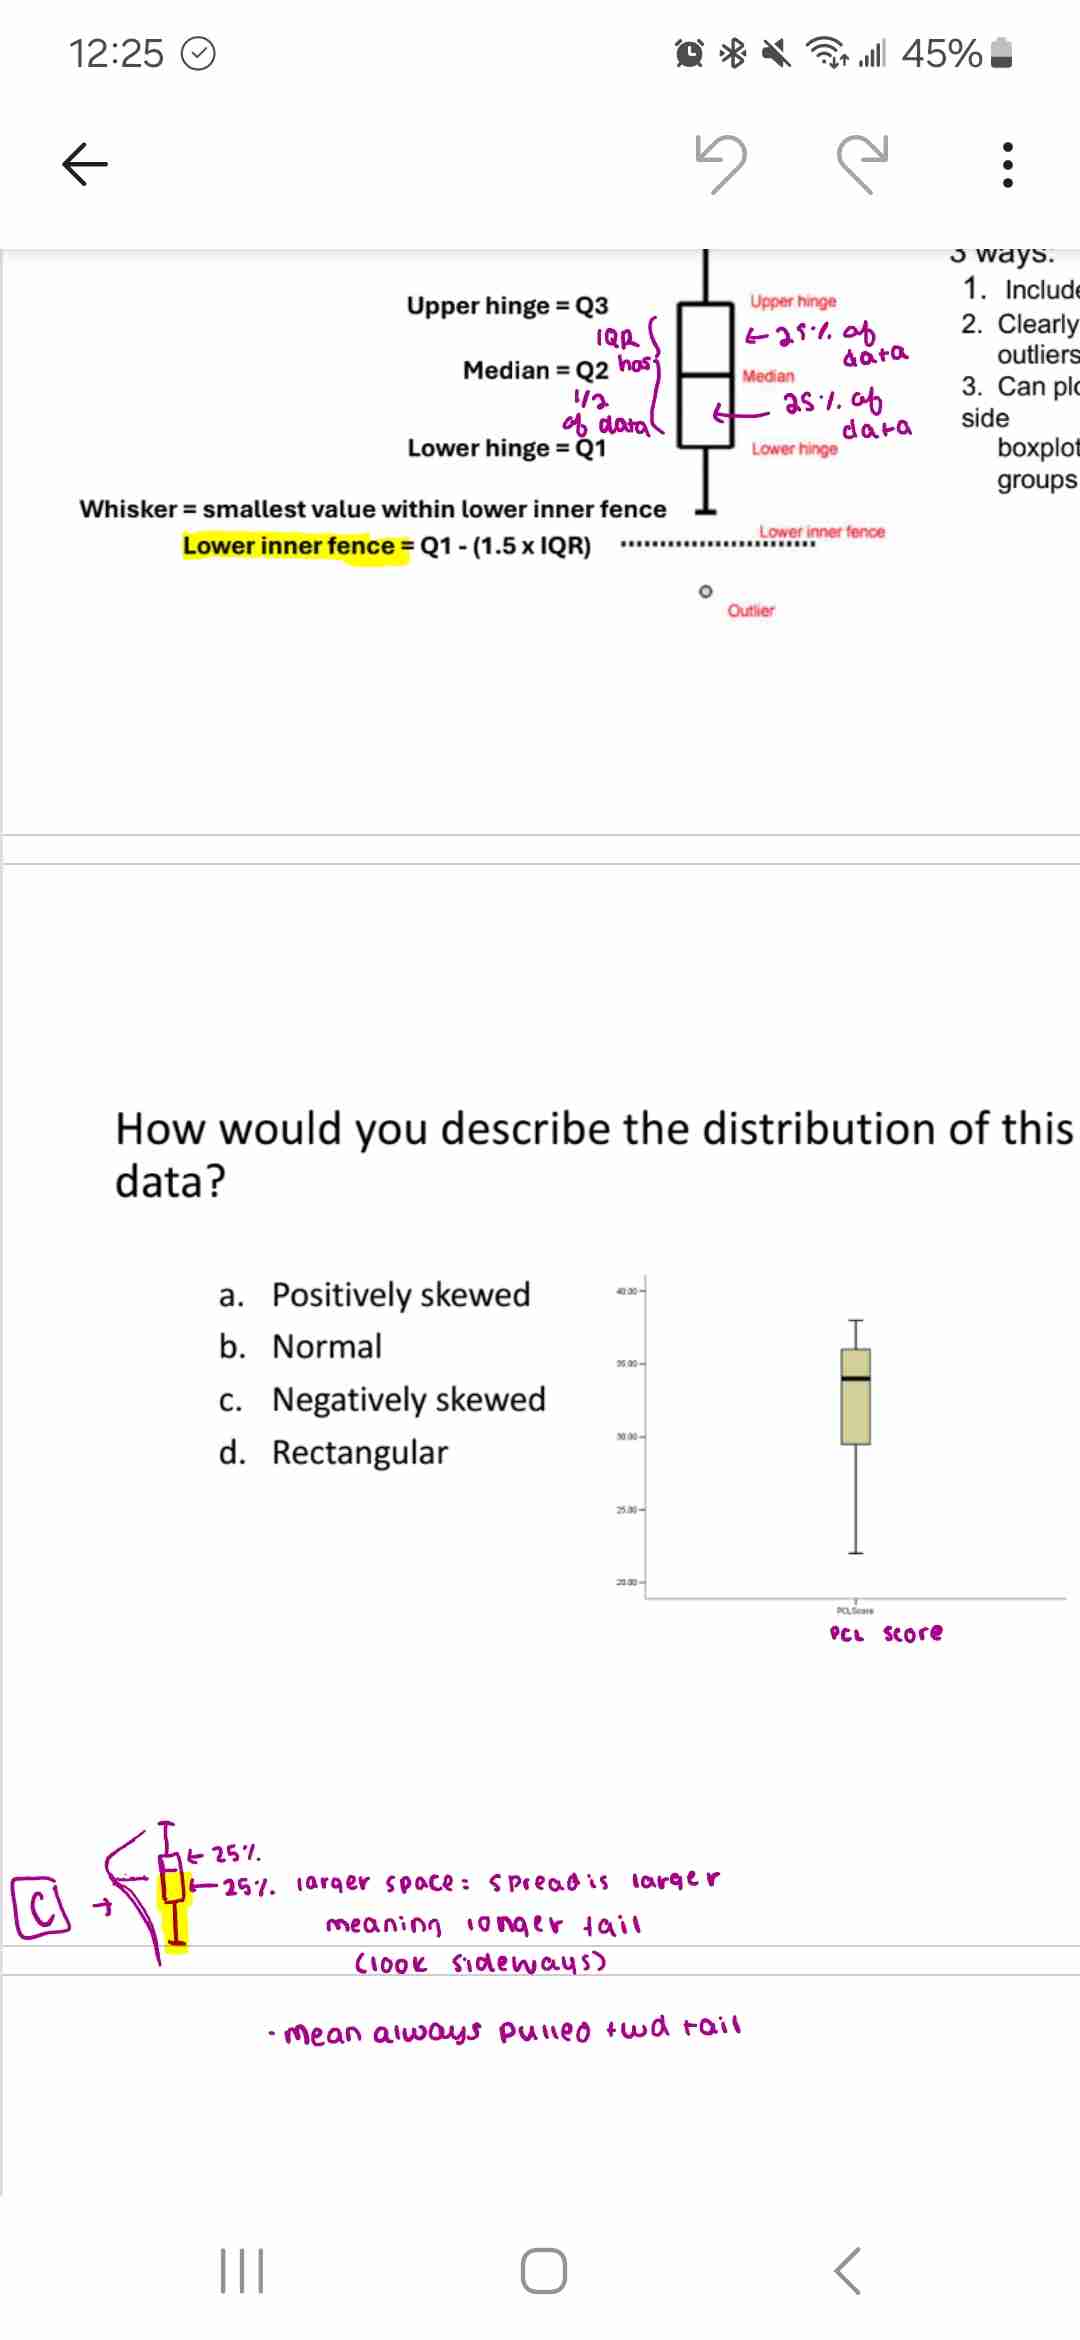
Iqr and outliers
Finding with iqr:
Scores > q3 + (1.5xIQR) are high end outliers . Anything outside this is outlier
Scores <Q1 + 1.5xIQR) are low end outliers
Box and whisker plot
How does it improve on iqr
C
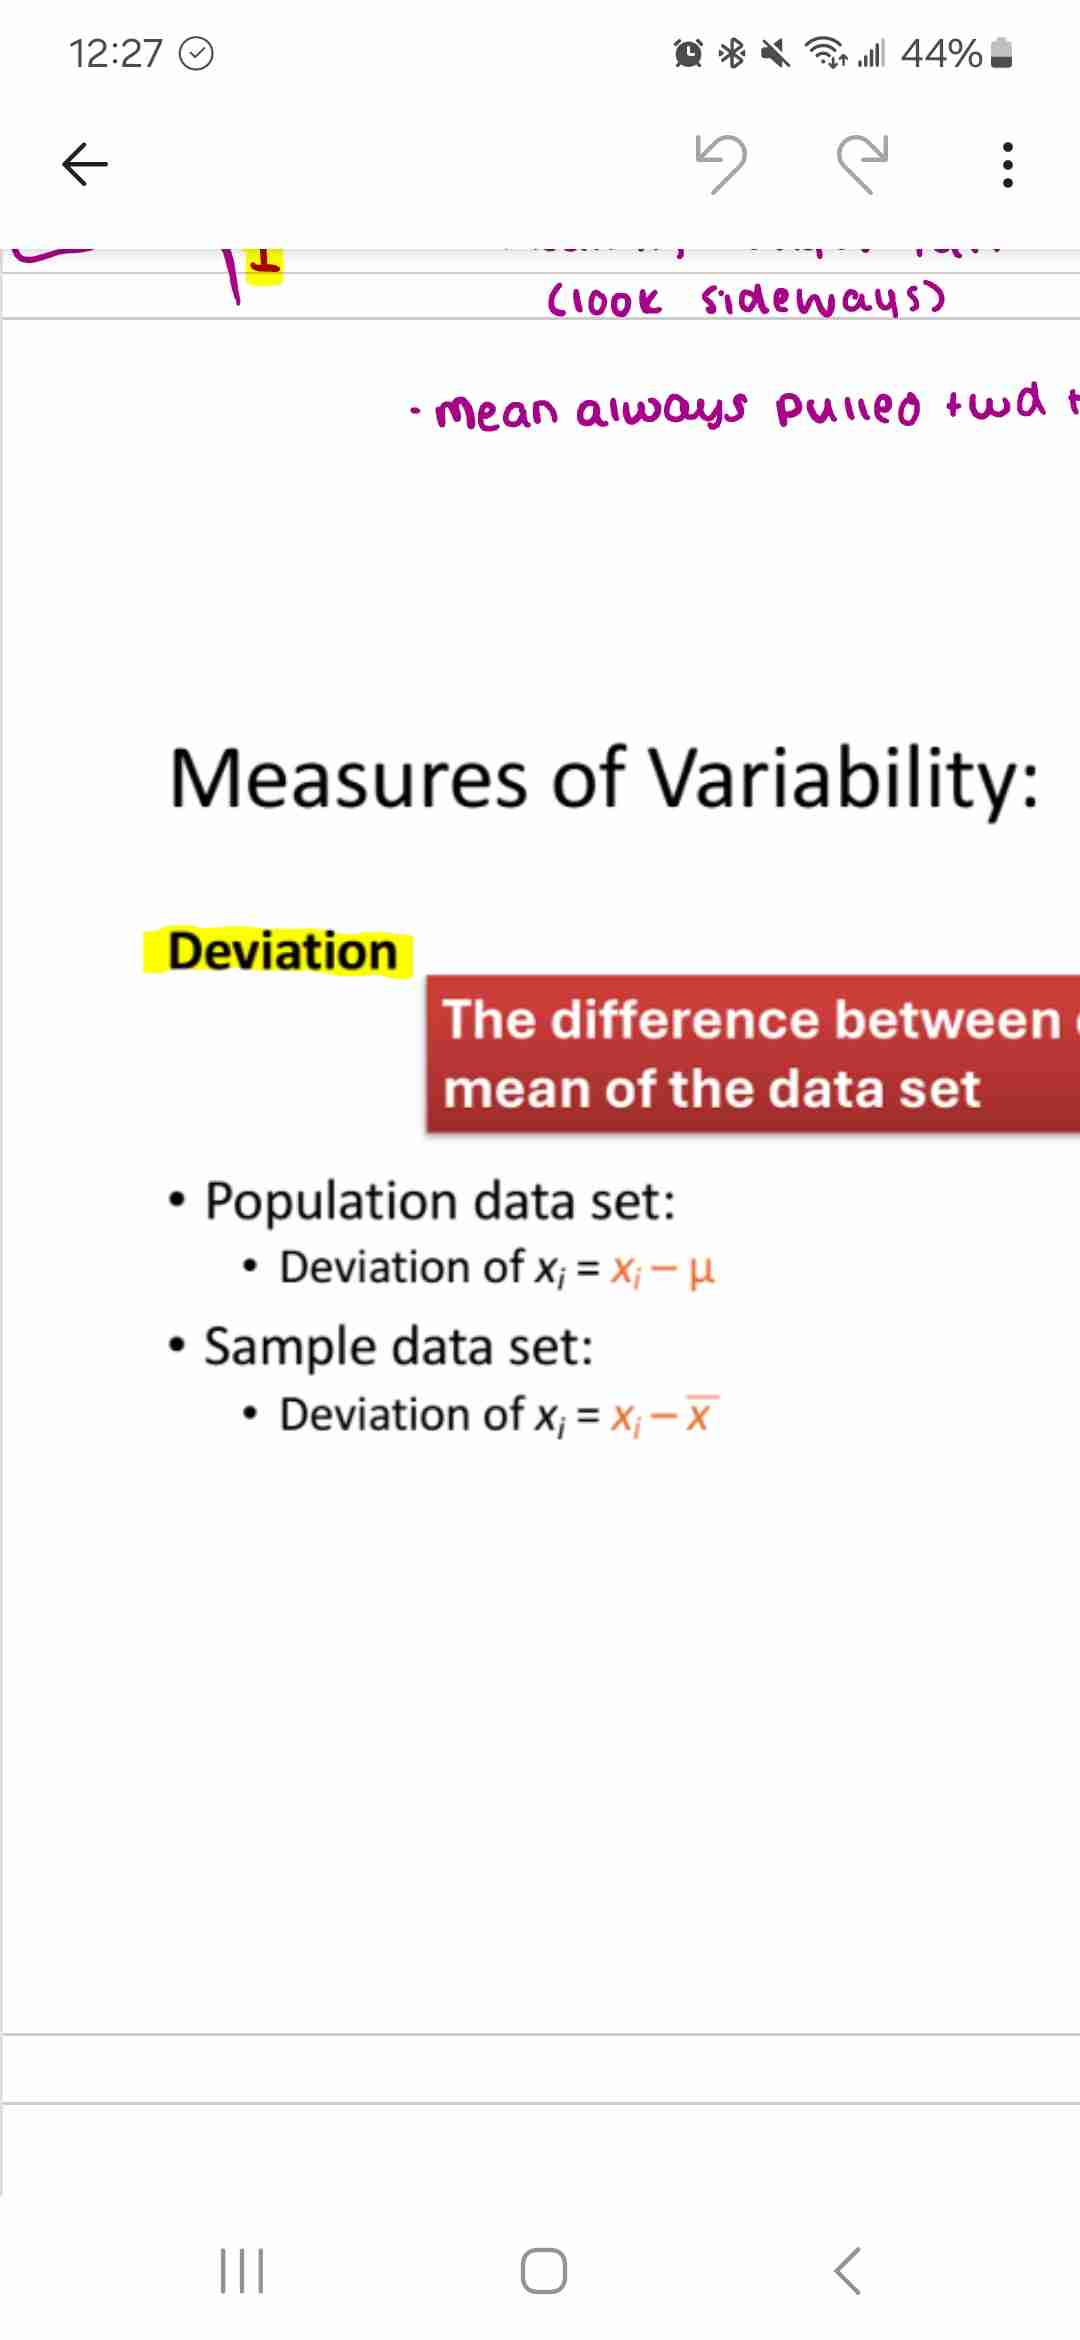
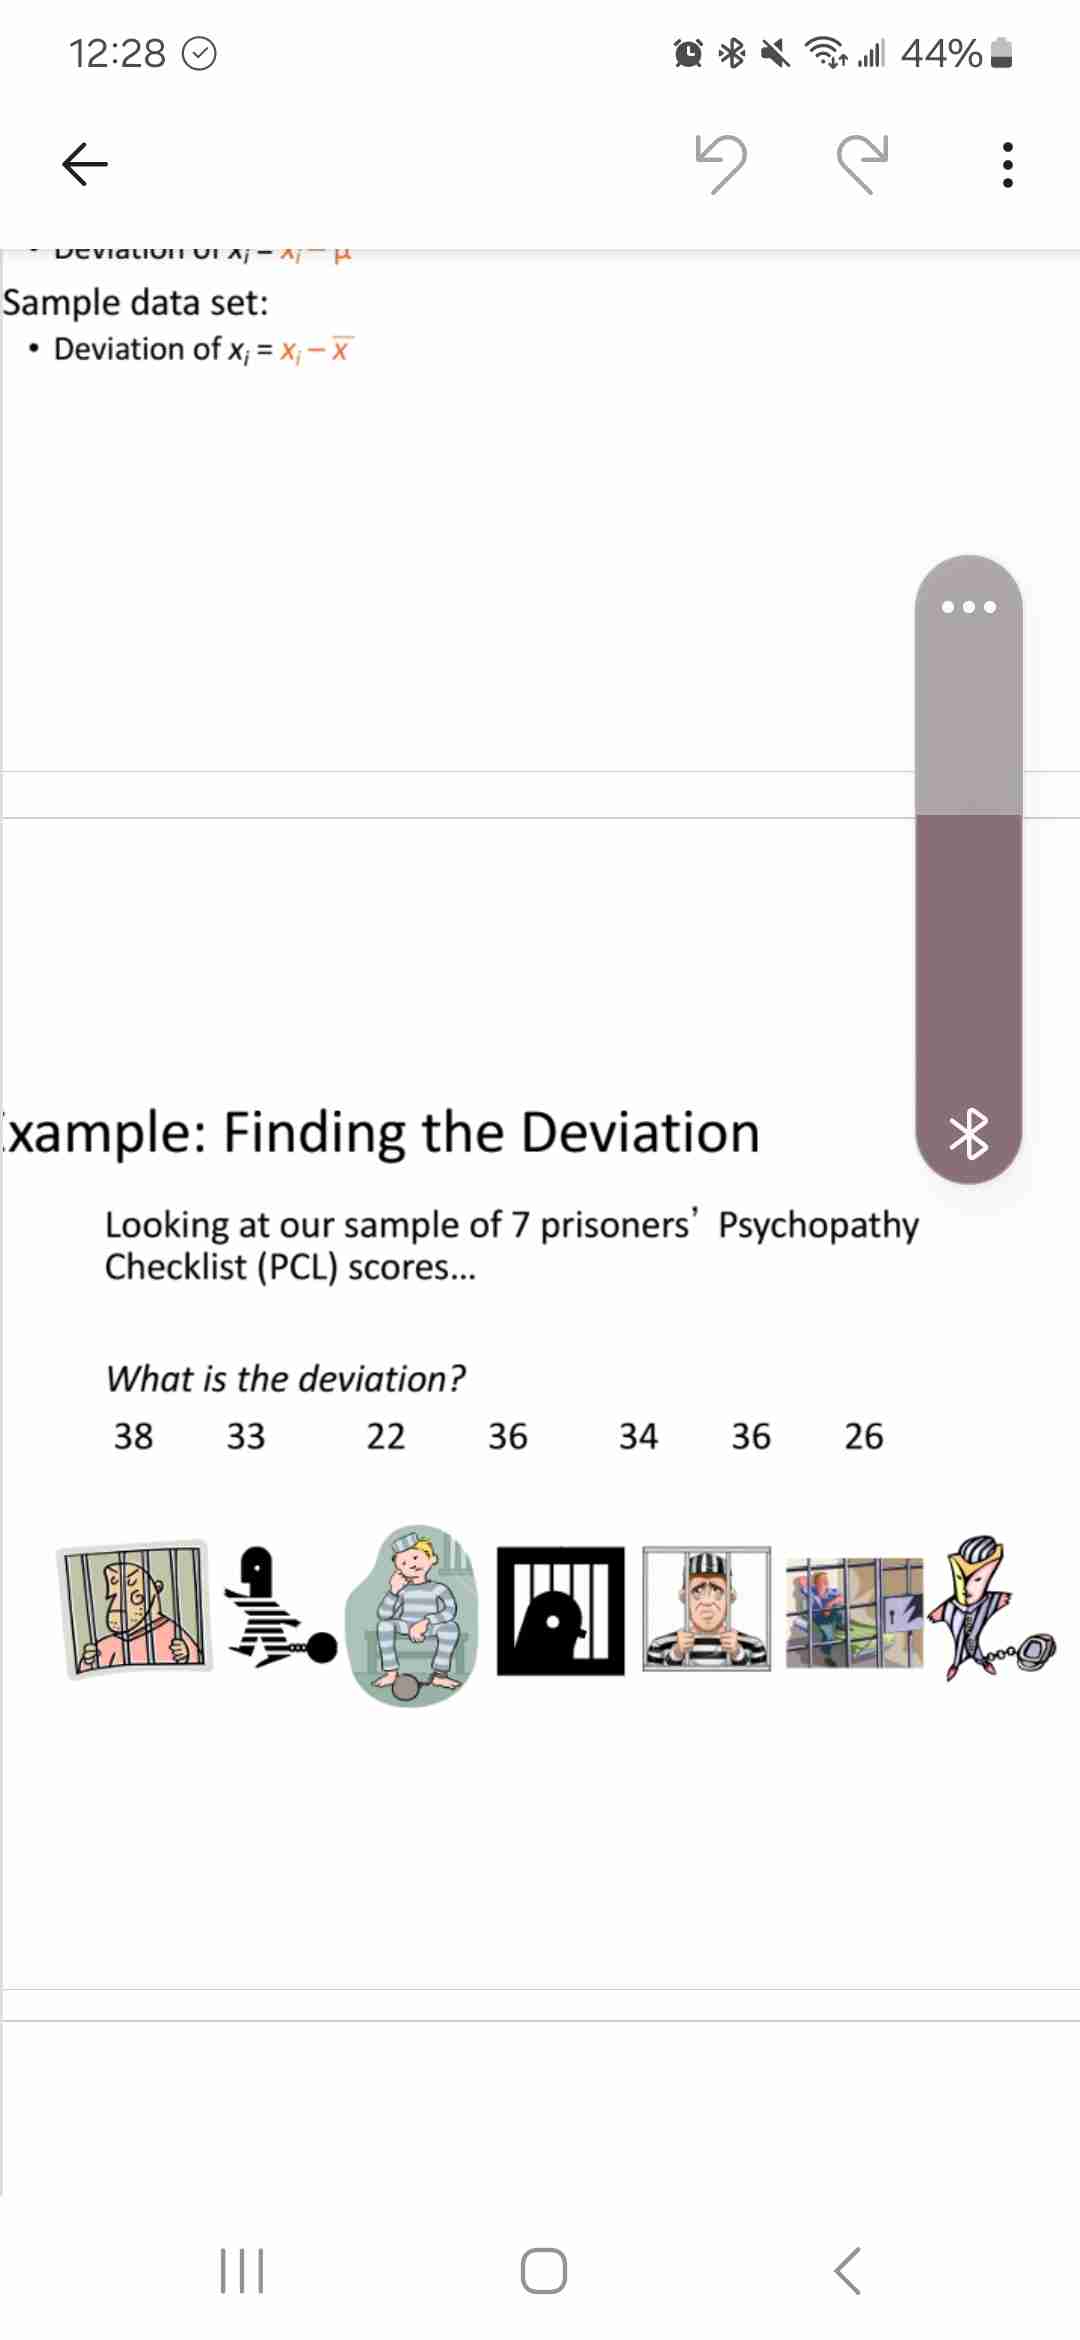
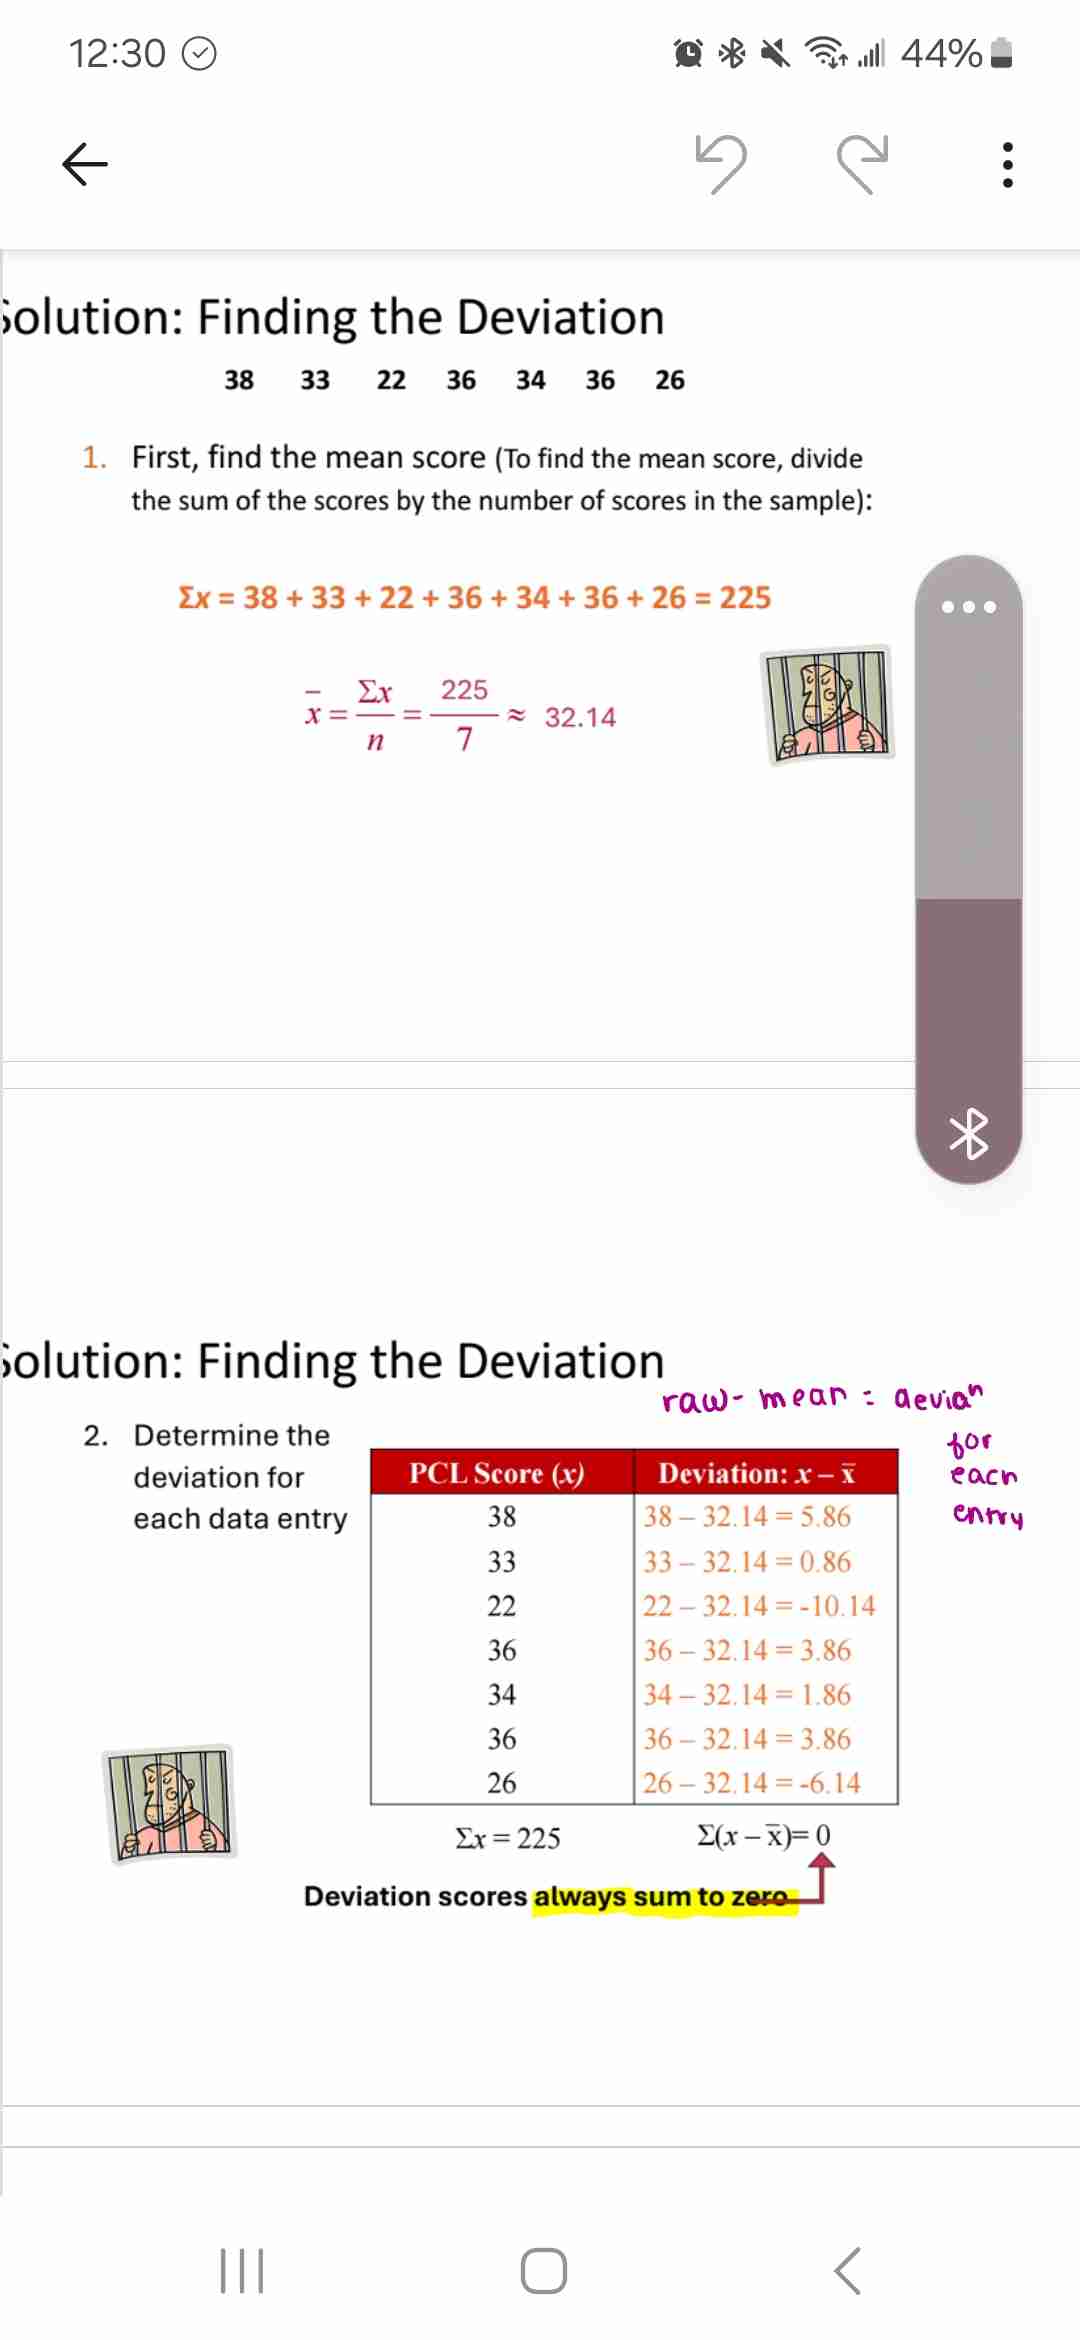
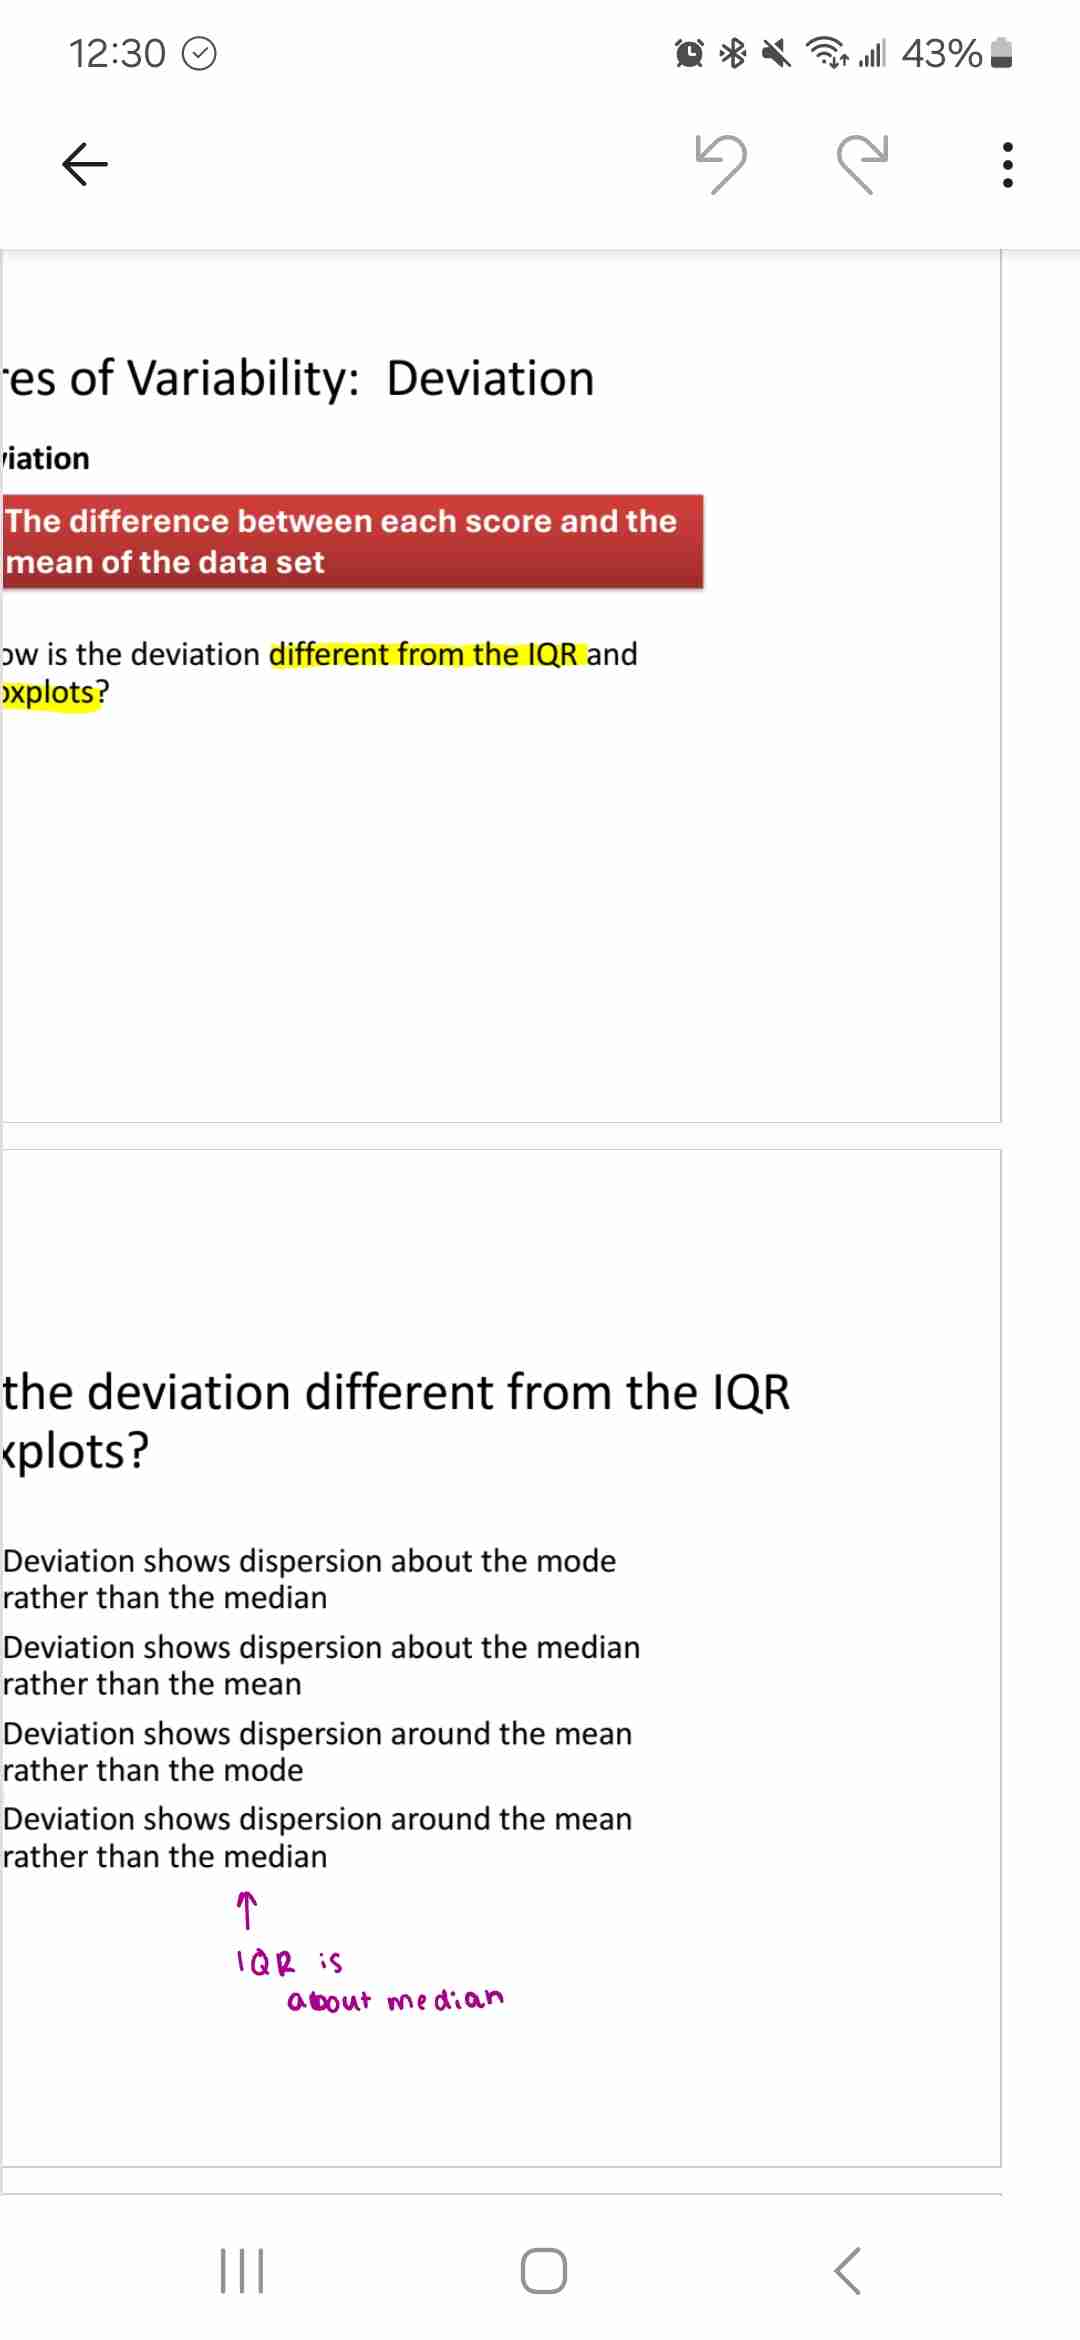
Deviation (variability measure)
Pop and sample dev
Diff btw each score and mean of data set
D
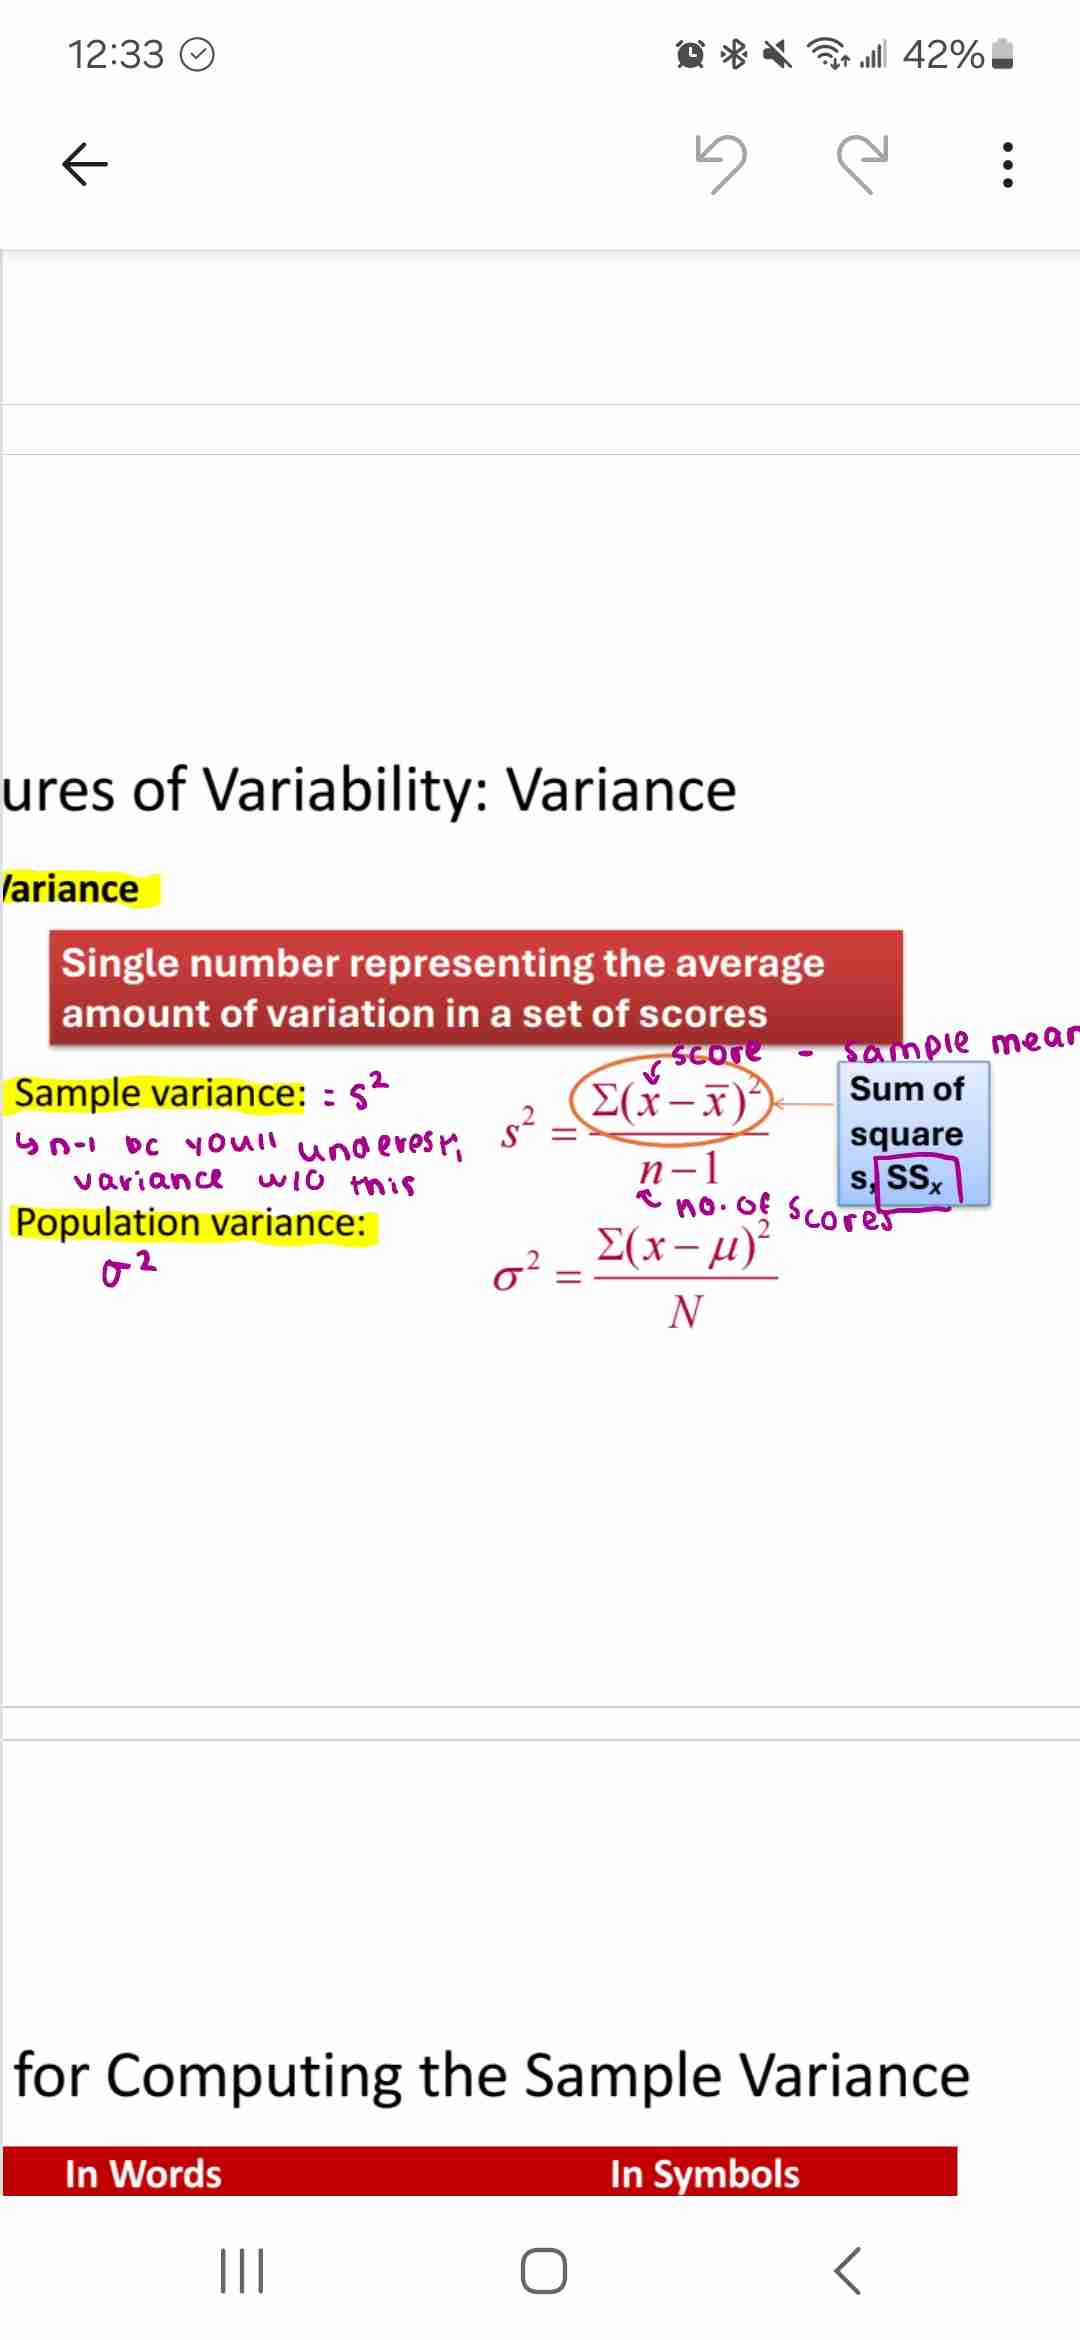
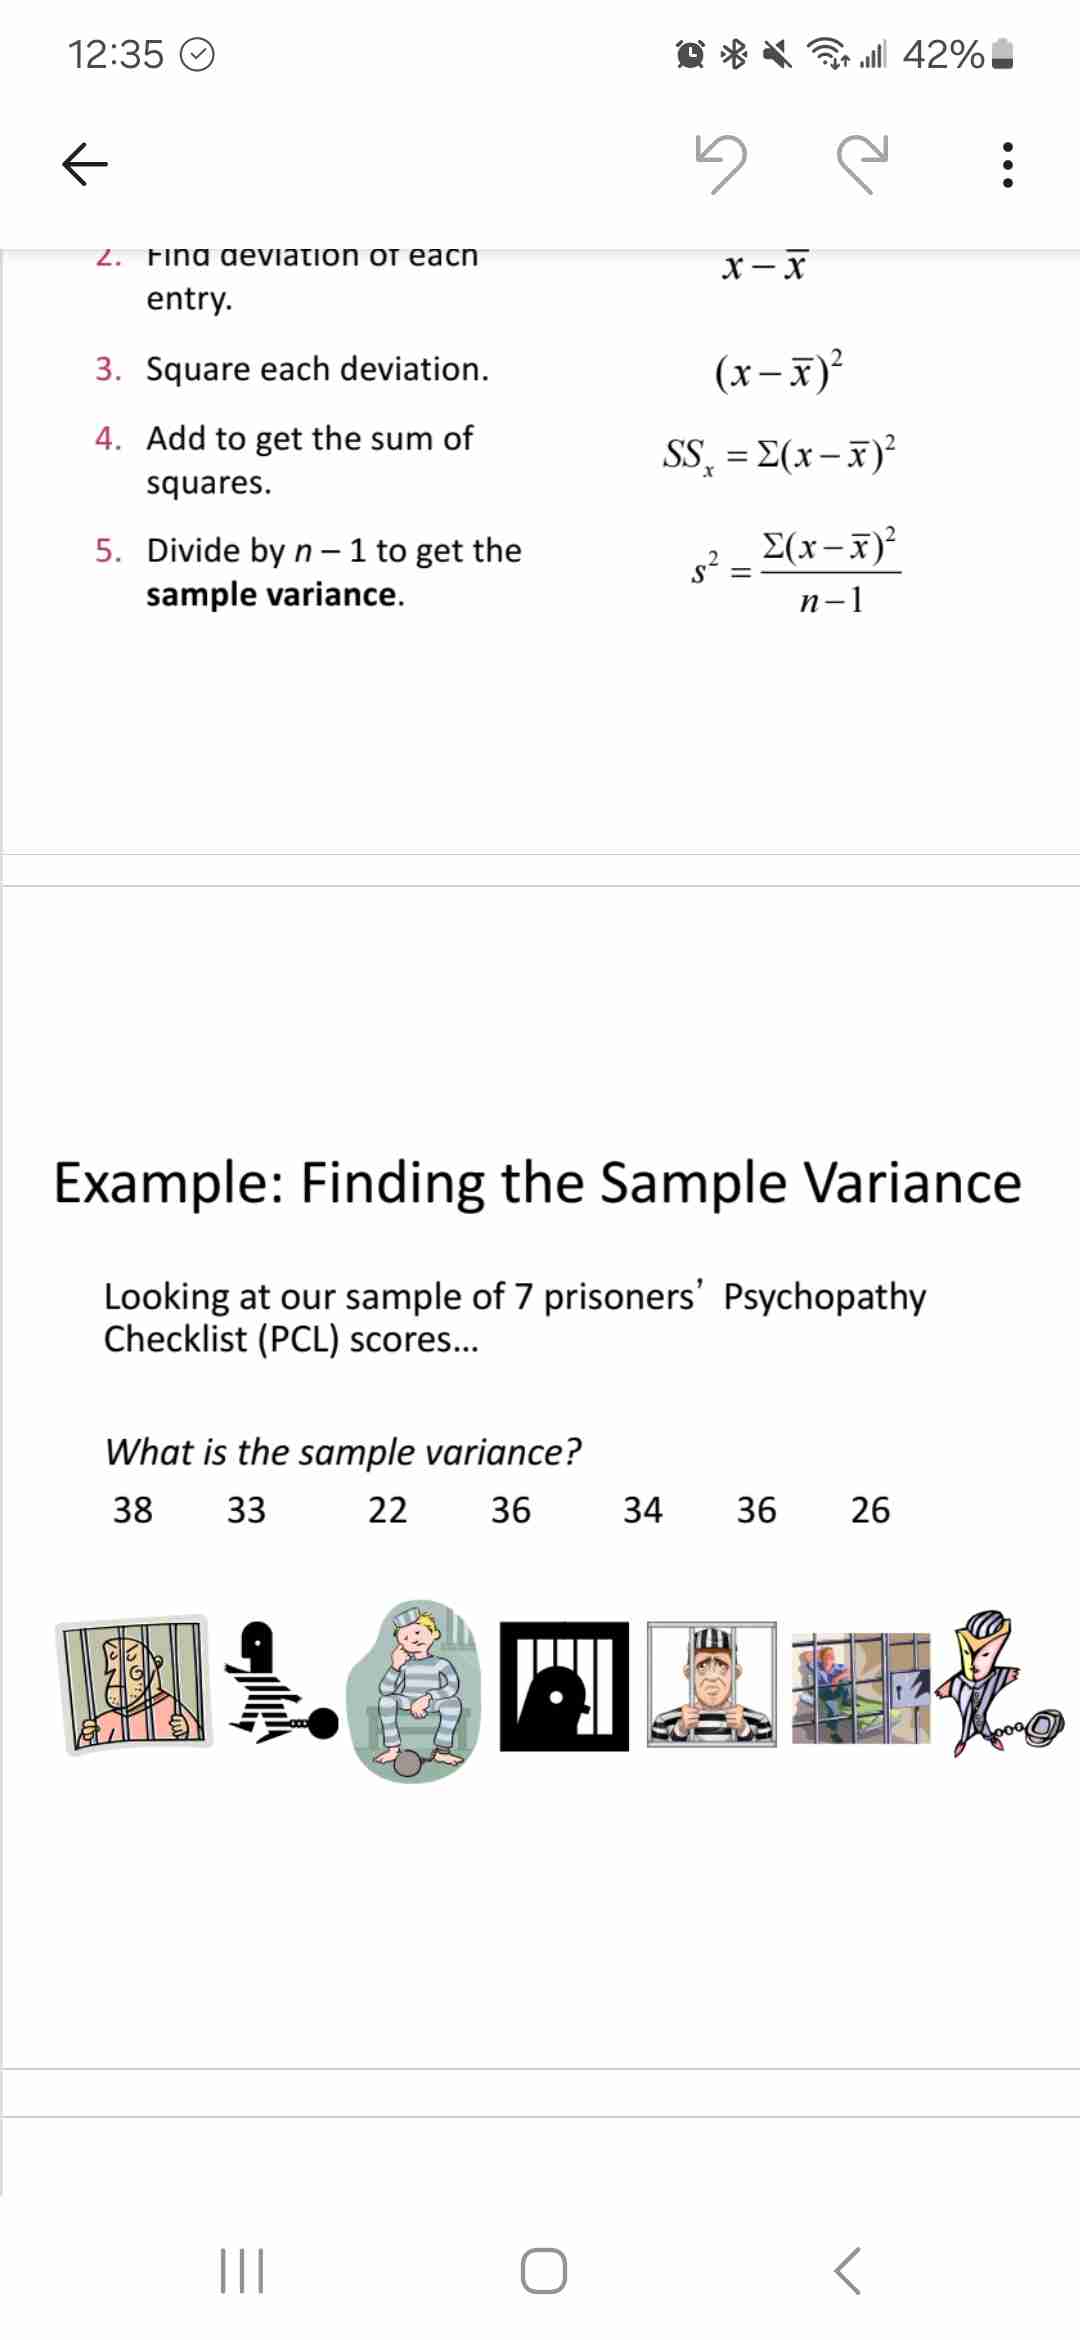
Variance and sum of squares
Single no representing avg amount of variation in set of scores
Sample variance: s² (n-1 otherwise underestimate variance efgect)
Population variance: o²
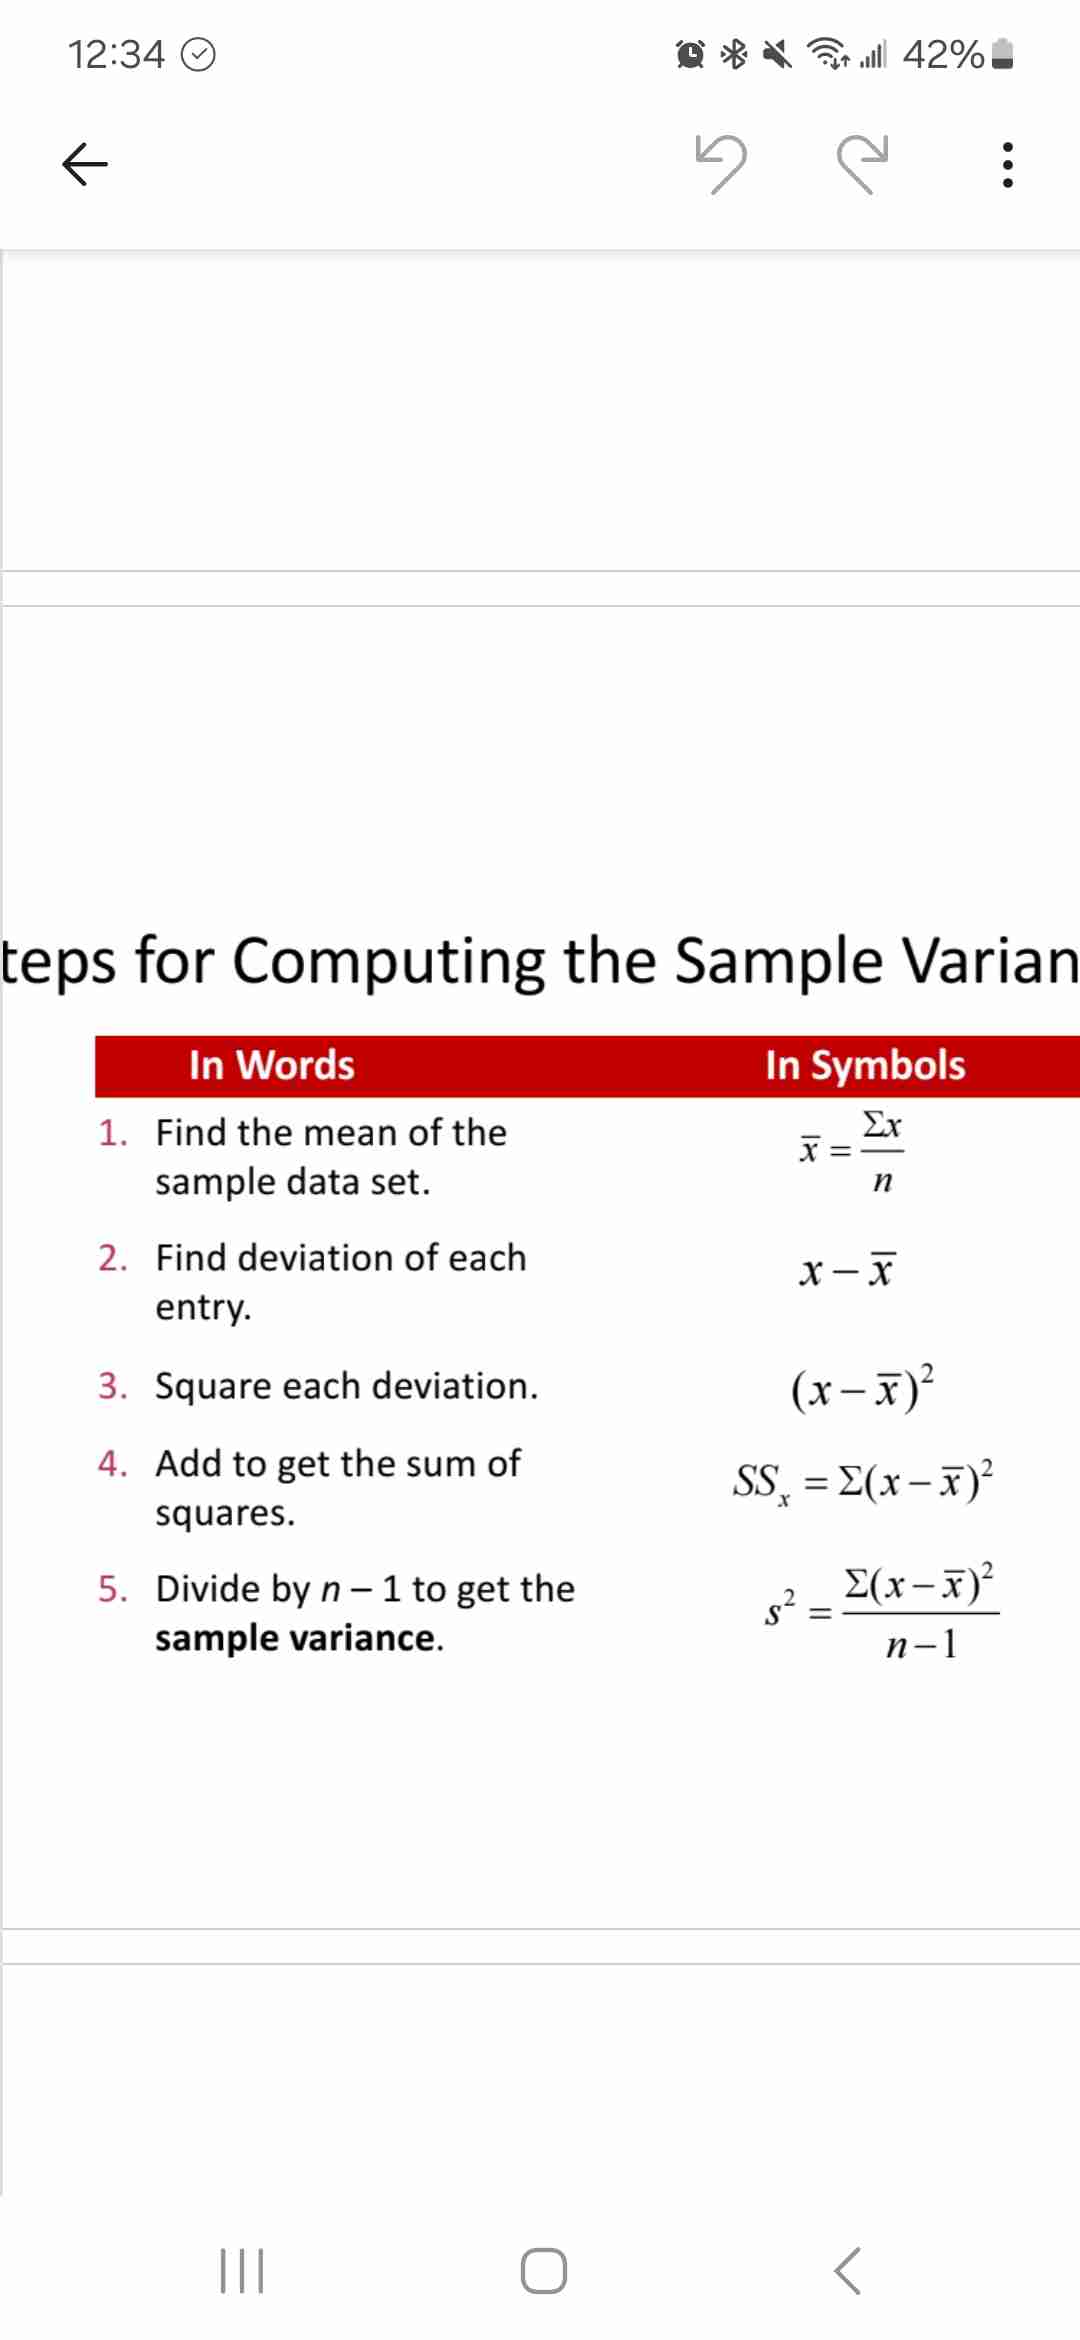
Steps to get sample variance

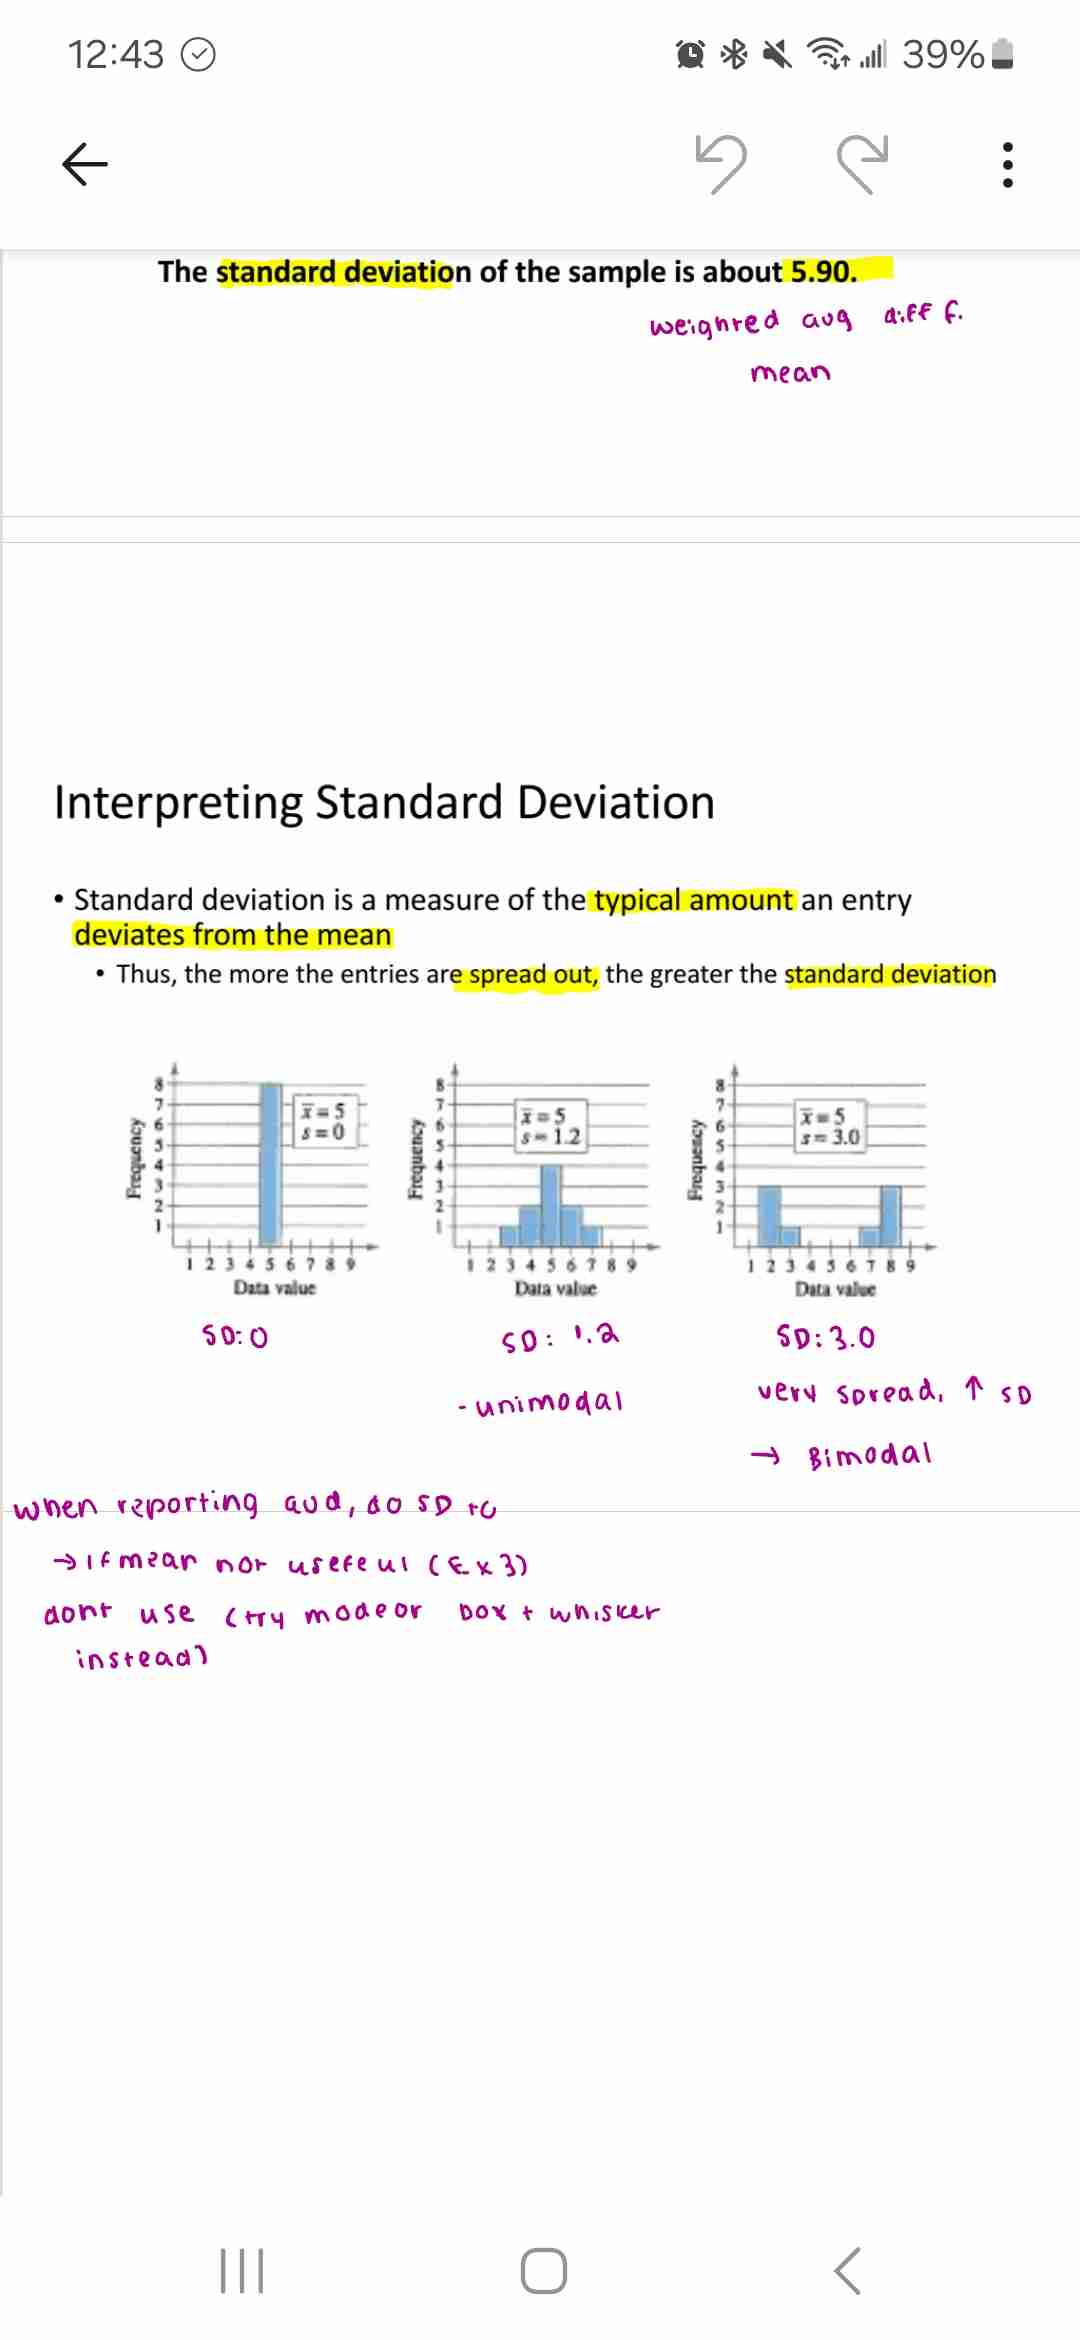
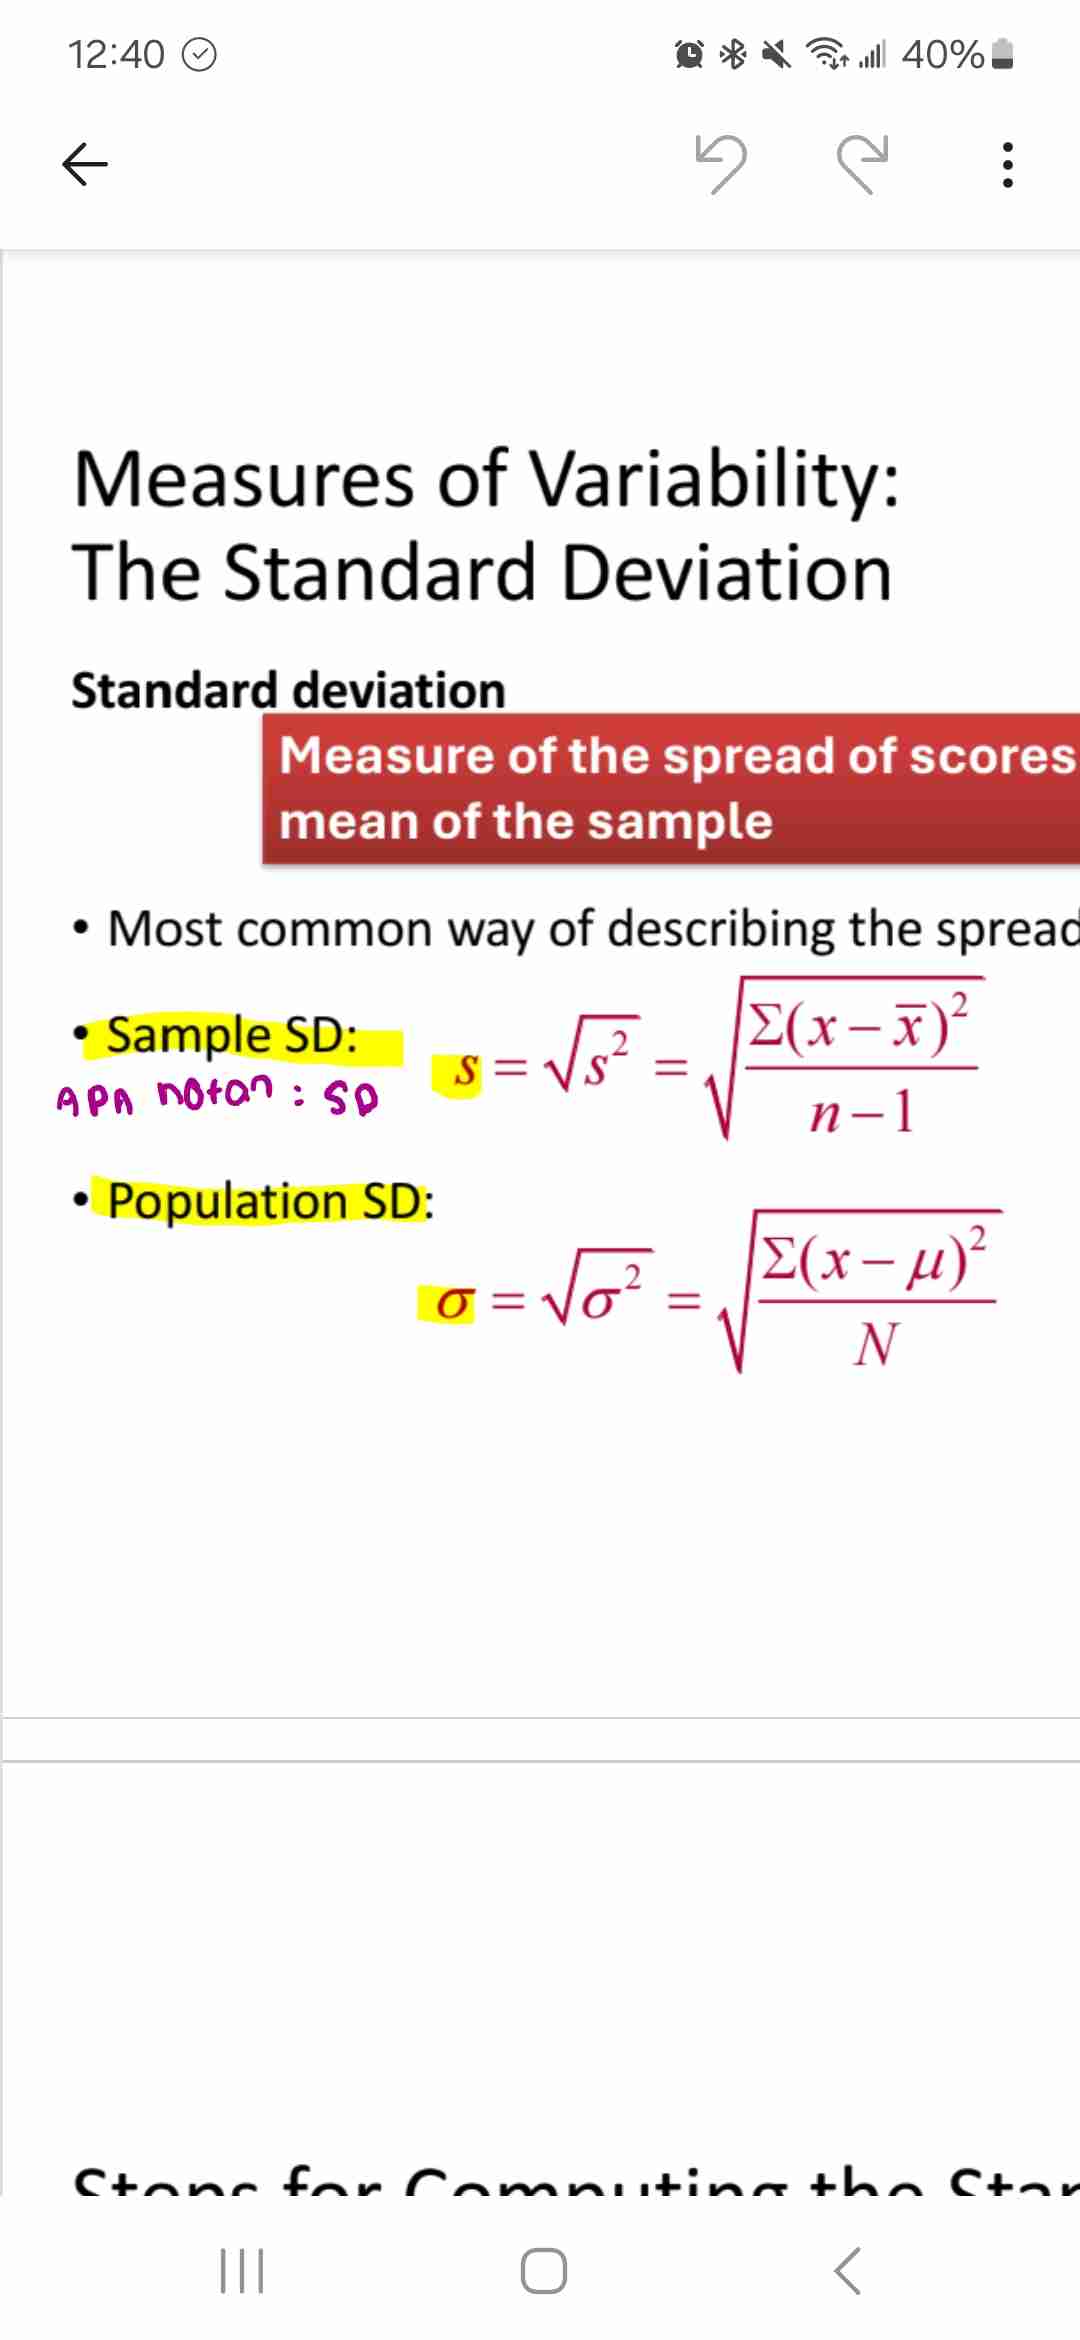
Standard deviation
Measure of score spread out from mean
Calculate variance the sqrt
Interpreting sd
More spread out data = higher sd