2.8 Using the photoelectric effect experiment, draw and explain graphs that show the number of electrons ejected vs. frequency or wavelength of radiation that shines on the metal.
0.0(0)
Card Sorting
1/3
There's no tags or description
Looks like no tags are added yet.
Study Analytics
Name | Mastery | Learn | Test | Matching | Spaced |
|---|
No study sessions yet.
4 Terms
1
New cards
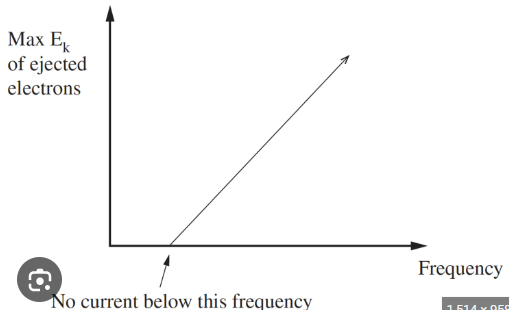
What does the graph of number of electrons ejected vs. frequency look like, and what does it show?
X-axis: Frequency of radiation (f)
Y-axis: Number of electrons ejected
Below Threshold Frequency: No electrons are ejected if the frequency is below the threshold (f₀), because the photons don’t have enough energy to overcome the metal's work function.
Above Threshold Frequency: Electrons are ejected once the frequency exceeds the threshold. The number of ejected electrons increases with light intensity (more photons hitting the metal).
2
New cards
.
.
3
New cards
.
.
4
New cards
.
.