3020 Measurements in Psychology
1/191
There's no tags or description
Looks like no tags are added yet.
Name | Mastery | Learn | Test | Matching | Spaced |
|---|
No study sessions yet.
192 Terms
Standardising scores into a z score is a ___ transformation
linear
Transforming z scores into a percentile rank is a ___ transformation
non-linear
If someone scores between ±/- 1 SD of the mean on a test, what percentage and fraction of the population are they the same as?
68% or middle two-thirds
If someone scores between ±/- 2 SD of the mean on a test, what percentage of the population are they the same as?
95%
Distinguish interval and ratio scales (giving examples of each)
Interval = interval between levels is meaningful but there is no absolute zero e.g., temp. C, time of day. Ratio = ratio between things is meaningful because there IS an absolute zero e.g., distance in cm, timing in seconds
“An interval scale is the only scale where twice the score is actually meaningful” - true or false?
False, this is only true of ratio scales
Are most psychological scales ordinal or interval? Give an example
Most are ordinal over interval. An example is IQ where an IQ of 140 is NOT twice that of 70
How is cognitive impairment defined in terms of IQ?
An IQ 2 SDs below the mean so an IQ less than 70
“Normal distributions are convenient because we can do more powerful statistical tests and make scales comparable” true or false?
True, and this is why we may do a non-linear transformation to make scales normally distributed
Describe a non-linear transformation and when it is used compared to a linear transformation
Non-linear transformation = when data is not normally distributed so you stretch out bits of scale more than others to make it normal. Linear transformation = raw scores are converted into standard scores but distribution shape isn’t changed e.g., z scores
“Z-scores are an example of a non-linear transformation” - true or false? Why?
False, z-scores are an example of a linear transformation because they standardise raw scores but do NOT change the shape of the distribution
If someone gets a raw score of 30 which equates toa percentile rank of 60, what does that mean compared to the rest of the cohort?
It means that 60% of the cohort scored 30 or less
With a positive z score, you look at the ___ portion, with a negative you look at the ____ portion
larger, smaller
Converting a z score into a percentile rank is an example of what kind of transformation?
Non-linear as it does change the distribution
“Correlation coefficients show us whether a relationship is statistically significant” - true or false?
False, they only show the strength and direction
The smaller the degree of scatter of scores, the ___ the correlation efficient
greater
“The slope of a correlation demonstrates the magnitude of the relationship” - true or false?
False, the spread of scores demonstrates the magnitude
“Linear transformations can change the correlation between two variables” - true of false?
False
Are significant outliers a problem in correlations?
Yes, they can skew understanding of relationship between two variables
What type of test is used to measure significance of a correlation?
T-test comparing significance to zero
What values are deemed a Large, Medium, and Small correlation?
L = .50, M = .30, S = .10
Distinguish Pearon’s r from Spearman’s Rho
Pearson’s = parametric, variables must be normally distributed, on an interval scale, sensitive
Spearman’s = non-parametric, variables don’t need to be normally distributed and can be ordinal, interval, or ratio, less sensitive
Why is Spearman’s Rho less sensitive than Pearson’s r?
Because it uses rank order rather than raw scores
What are the three fundamentals of measurement?
Standardisation = ensuring different measurements are in equivalent units before comparing them. Reliability = the extent to which a measurement tool gives consistent measurements each use. Validity = extent to which a measure actually measures what you’re intending
What distinguishes achievement form aptitude tests?
Achievement = previous learning; Aptitude = general ability
Psychometrics is the ___ of psychological measurement
science
Achievement and aptitude tests are both examples of ___ tests
ability
When we standardise a raw score we do is relevant to the average population - true or false?
False, it is to the RELEVANT population, not population as a whole, specific to context
The normative sample when standardising are the whole population - true or false?
False, it is the specific norm population needed e.g., using a sample of children to generate the norm for reading standards
What is ‘stratified sampling’?
Selectively choosing particular ratios of groups within a sample if true random sample is not possible/helpful
“A pro of percentile ranks is that they have a linear relationship with raw scores” - true or false?
False, they have a NON-linear relationship with raw scores, this is one of their cons
Percentile ranks are more bunched up around ___% and more spread out towards ___ and __%
50%, 0 and 100%
If we assume a normal distribution, then the number of people between the 50th and 55th percentile rank is the same as between the 90th and 95th - true or false?
True
In a normal distribution, percentile bands occupy a larger range of raw scores closer to the mean - true or false?
FALSE, occupy a SMALLER range of raw scores closer to the mean (bunching)
T scores have a mean of ___ and an SD of ____ and are calculated by taking the z score and multiplying by ___ and adding ___
mean = 50, SD = 10. Formula = z score x 10 and adding 50
What is the benefit of T scores over Z scores?
T scores avoid negatives, Z scores are messier
Transforming Z scores into T scores changes the distribution as it is a non-linear transformation - true or false?
FALSE, it does NOT change the distribution and is a LINEAR transformation
To convert any score into an IQ score, calculate the __ score then multiple by [] and add []
z score, 15, 100
If someone has an IQ of 85 that is 1 SD below the mean, 84% of people are more intelligent and 16% are less intelligent - true or false?
True
If someone has an IQ of 70 (-2SD), what % of people are more and less intelligent?
98% more intelligent, 2% less
Stanine scale is often used in ___ tests and has ___ divisions where each division is ___ SD wide
school tests, 9 divisions, .5 SD
What is the percentile rank of a 5 Stanine, the standard deviations it encompasses, and % of people?
41-60 percentile rank, -2.5 to 2.5 SD, 20%
Distinguish norm-referenced to criterion-referenced scoring
Norm-referenced = individual’s score calculated relative to others. Criterion-referenced = individual’s score unaffected by others and only by criteria being assessed.
Give examples of norm-referenced vs. criterion-referenced scales
Norm = IQ, Stanine, percentiles, z and t scores. Criterion = UQ exams, driving test, competency tests
What are pros and cons for norm vs. criterion referenced scoring?
Norm = pro is you’ll get a good distribution, con is scores are affected if norm changes (e.g., your’e disadvantaged if you happen to be in a smart year). Criterion = pro is unaffected by norm changes, con is more likely to have floor/ceiling effects.
What are the elements of the “egg” in classical test theory?
Observed score = whole egg. Measurement error = egg white. True score = egg yolk.
In classical test thoery, reliability is the ratio between ___ variability and __ variability
true, total
Lower measurement error = higher reliability OR validity?
Reliability
Reliability refers to the degree to which test scores are free from errors of ___
measurement
What is the Spearman-Brown formula correction used for?
It’s used when calculating Cronbach’s alpha to account for the fact that you’ve halved the test
Why may internal consistency not be appropriate to measure in a speed test e.g., answering as fast as you can?
Because it may give a spurious correlation because people tend to get all questions they attempt correct but don’t have time to attempt all
What can the Spearman-Brown prediction formula used for?
It can be used to estimate how reliable a test is based on its items.
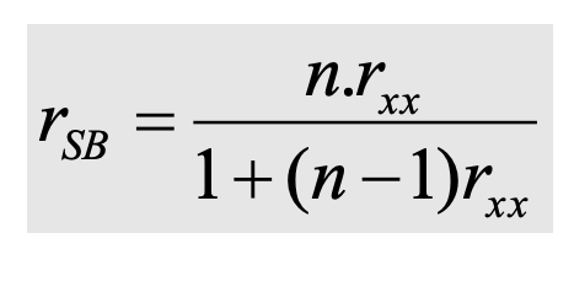
What is this formula? Break it down.
This is the Spearman-brown prediction formula. n = the number of items in new test divded by number of items in old test. rxx = reliability of original test before adjustmnet.
Does doubling the length of a test double its reliability?
No, due to the law of diminishing returns.
“Validity is an all or nothing assessment of the appropriateness of a test” - true or false?
False, it is not all or nothing but a matter of degree of validity
What is the bit of a construct not captured in a measure?
Construct underrepresentation
What is the variance not related to the construct that a measure captures?
Construct irrelevant variance
Construct underrepresentation refers to the variance in a construct that does not covary with test scores - true or false?
True
Construct irrelevant variance refers to the variance in a test that does not covary with the construct of interest. - true or false?
True
What is content validity and how do we ascertain if a test has it?
Content validity is whether the items in a test appear to cover the whole domain. It is tested based on opinion, maybe by recruiting experts in the area to give their opinion.
What forms of validity need empirical evidence and give their definitions
· Criterion validity: does it map onto criterion as expected? Can it distinguish between experts and novices?
· Convergent Validity: correlates with similar things? Correlate with previous iterations measuring same construct?
· Discriminant/Divergent Validity: doesn’t correlate with dissimilar things e.g., trying to measure anxiety, don’t want it to correlate with depression
· Construct validity → does the test measure the construct?
Can a test have high empirically based validity without content validity? Give an example.
Yes it can, for example, there may be a test that finds a strong correlation between certain personality attributes and performance in 3020, but may not encompass any 3020 content.
Can a test be valid but unreliable?
No, because it’s essentially then not measuring anything.
Can a test be reliable and not valid?
Yes! You can get consistent responses that are not valid for the construct you are trying to measure.
What two factors may restrict range of scores, affecting a validity coefficient?
1) Non-random attrition e.g., certain types of people dropping out of longitudinal study 2) Self-selection e.g., only certain people in the sample in the first place such as only safe drivers choosing to volunteer for a driving study
How big does a validity coefficient have to be?
There’s no strict rule and it depends on the context.
If a test can distinguish experts and novices, it has high ___ validity
criterion
What are examples of criterion measures?
University admission tests with a GPA, depression inventory with clinician’s ratings of depression severity
What is criterion contamination and an example?
It is where the criterion being used to assess validity has been pre-determined. For example, Zuckerman claiming a test can predict risk-taking behaviours, but the test itself asking how often participants engage in risk-taking, so a circular logic.
If you give a test at point A and give criterion at a later date and find a significant correlation, this demonstrates __ validity
predictive
If the reliability of both a test and a criterion measure is high, then this means the correlation between
them should also be high. - true or false?
False, it raises your chances but both can be reliable and completed unrelated.
When a test and criterion are administered in the same session, this is done to determine ____ validity
concurrent
Incremental validity is how much each individual predictors adds to predicting the criterion in isolation - true or false?
False, it’s about the new item alongside the others, not in isolation
If test scores correlate with other measures of the same thing, we can say that it has high ___ validity
convergent
If test scores do not correlate highly with measures you would expect them not to, this demonstrates ___ validity
discriminant
Examining whether developmental changes occur as expected is one way of evaluating the content validity of a test - true or false?
False, content validity is about covering the whole domain of a topic, not developmental changes
If a test is a valid reflection of a construct, we’d expect it to be multi-faceted as the construct is, and we can test this using ___ ___
factor analysis
If you find that participant Jeff scored highly on items 1-3, but low on items 4-7 and the inverse for Sarah, is the test invalid or unreliable?
No, it could be just that the test is measuring two independent things and is heterogenous in nature e.g, Big 5
____ validity is essentially an umbrella term for all types of validity except face validity
construct
If we’re creating a norm-referenced test, then items with a reduced spread of scores may be a problem - true or false?
True, we want a wide spread of scores in a norm-referenced test to tell participants apart/create a normal distribution
For ‘item-rest’ correlation, the ___ the number, the more likely it may be decreasing the test’s ____ consistency
lower, internal
For ‘Cronbach’s alpha if item dropped’, the ___ the number, the more the item is ___ the cronbach’s a
higher, lowering
What kind of test do you use for a dichotomous test x dichotomous criterion measure?
A chi-square test
What kind of test do you use for a dichotomous test x continuous criterion measure?
Correlation or t-test
What kind of test do you use for a continuous test x dichotomous criterion measure?
Correlation or t=test
What kind of test do you use for a continuous test x continuous criterion measure?
Correlation
What does the standard error measurement tell you?
It tells you the likely margin of error in client’s test score e.g., if they did the test a thousand times, how much each test would vary
How do you calculate a test takers score’s margin of error?
By subtracting the SEM from their actual score
If we assume a normal distribution, we assume ___ % of scores are within 1 SEM, % of scores are within 2 SEMs and __ of scores are within 3 SEMs
68%, 95%, 99.7%
As reliability increases, what happens to SEM?
It gets smaller
If we’re creating a criterion-referenced test, then items with a reduced spread of scores are a problem - true or false?
False, spread of scores doesn’t matter for criterion-referenced
A 95% confidence interval encompases how many standard deviations?
± 2 SD
How do we calculate the standard error of the difference? (SEdiff)
Take the square root of the SEM1 squared plus the SEM2 squared (SEM for both tests)
What is the standard error the difference?
It measures the margin of difference between two different scores either between the same test or two different tests and either of one individual doing the tests both times or comparing two individuals.
If scores differ by more than __ SEdiff, then we can say we are __% confident it’s a real difference; if it’s less, not significant
2 SEdiff, 95%
Army intelligence tests in WW1 were developed by ___ from original individual IQ tests created by ___ in Paris for ___ purposes and were _____
Yerkes, Binet, educational, a-theoretical
Army intelligence tests were ___ administered with ___ tests for literates and ___ tests for those illiterate/non-English speaking
group, alpha, beta
Yerkes claimed that his IQ tests mainly measured pure IQ not impacted by environment - true or false?
True, while he did acknowledge some environmental impact, did argue it mainly measured inborn intelligence
The US army intelligence tests of the First World War established the average mental age of white American males as 13.08 years. The most significant problem with the interpretation of this statistic is that an inappropriate standardisation sample was used - true or false?
True, used a very small group of 62 students and businessman defined as having a mental age of 16
What was Murray and Hernstein’s controversial book The Bell Curve arguing about intelligence?
That intelligence is mainly inherited and stays the same across a lifespan, so educational interventions to increase IQ are unsuccessful