Lecture 11 - Trading Strategies, Portfolio Management
1/59
There's no tags or description
Looks like no tags are added yet.
Name | Mastery | Learn | Test | Matching | Spaced |
|---|
No study sessions yet.
60 Terms
Several issues to trade based on:
performance, catching large trends, diversification
Costs
Time consumption, opportunity costs, trading losses from learning curve
Set-up costs, computer, high speed internet, trading platform order execution, chart service
Commission, slippage, missing orders in fast markets, errors
Unexpected events - order entry going down
Personal risk tolerance
Leverage use, futures vs stocks, going on margin
Suitability
Based on your experience and personality
Choose “slower” or lower risk markets when starting
Volatility
The more volatility, the higher the potential profit but the greater the potential costs
The breakout from low to high volatility is where most profits are made
Liquidity
Ability to transact a large number of shares without bringing about a large price change
Dependent on bid-ask size, as narrow spreads does not always guarantee liquidity
Volume
You want issues with heavy volume that have liquidity
3 types of trading for different time horizons
Scalping
Day Trading
Swing Trading
Scalping
Taking very small profits between bid-ask spreads and accumulating liquidity credits
Requires time, an excellent order entry system, and experience
Extremely short term (minutes) and fast paced
Competition between trader and market makers, specialists
Day Trading
Trading an issue and closing all positions by the end of the day, therefore not taking any overnight risk
“Screen trading” by using intraday technical analysis signals
Very short term minute/hour bars are used
Swing Trading
Catching small trends or counter trends over several days or weeks
Less experience required in comparison to day trading
Entry and exits can be predefined using pivot points, 2 bar patterns, candle patterns, crossovers etc…
Not as short term, less time consuming
2 approaches used to select which issues for investment
Top Down
Bottom Up
Top Down Approach
Selection starting from the type of market (stocks, bonds) → country → industry sector → security
Relative strength analysis, intermarket relationships
Bottom Down Approach
Security → industry sector → country
Security slection first also based relative strength and additional screening criteria
Industry sectors and sector rotation theories
Selecting sectors based on the business cycle
Ratio (relative strength) analysis
Relative Strength
Simple yet effective method of stock screening
Based on the notion that strength just like trend continues
Ratio determined between two investments, sectors, industry groups, indexes, etc… to see which is outperforming the other
Other Measures of Relative Strength
Percentage change
Trend Slope Method
Levy Method
Percentage Change
Uses a 6 month price change to determine relative strength
Stocks are then sorted based on relative strength. Higher decile stocks continued to be stronger for the next 3-10 months
Trend Slope Method
Calculate the slope of each stock’s price curve in percentage terms over a specified period through a linear regression. Stocks are then ranked by their slope
Levy Method
First calculated the ratio of a stock’s current price/131 trading-day moving average, he later changed to using the 6 month moving average
Then ranks this ratio against the same ratio for all other stocks
He concluded that relative strength is a better position process in bull markets
Stock screen selection methods of the Pros
Kirkpatrick
Value line
Wyckoff
O’Shaughnessy
O’Neil - CANSLIM
Kirkpatrick
Calculated all relative price ratios to each other; P/S, 6 month RS
Used a multifactor model of the above relative rankings and outperformed by 4:1 vs S&P 500 over the last 27 years
Value Line
Analysis service that uses a proprietary relative strength ranking of 1 to 5 to rank the “timeliness of stocks”
They also incorporate additional factor such as; earnings trends, recent earnings, earnings surprises
Value line has outperformed S&P 500 16:1 ratio
Wyckoff
80 year method developed by Richard Wyckoff
He believed stock prices were determined solely by supply & demand, and influenced by wealthy individuals and large institutional insiders
Used tools; bar charts, P&F charts, relative strength, volume
He believed markets travelled in waves and calculated % price changes from waves highs and lows
O’Shaughnessy
Relative price strength was the factor that consistently beat the market. Calculated 12 month relative price strength
Also studied factors such as: market cap, P/S, P/B, P/S, dividend yields, earnings, ROE and developed multi-factor investment strategies
O’Neil CANSLIM facts
Stocks are ranked according of 12 month relative price strength, 3 month price strength weighted more heavily in percentiles from 0-99, 99 being the strongest
O’Neil found that the average relative strength percentile by his calculations was 87 before large upward moves
Uses a 7-8% strict stop loss rule
Hold position if stock ries greater than 20% within 1-3 weeks
Buys the pattern breakouts within 5% of breakout price
Patterns used:
Cup and handle/saucer
Flat base
Double bottom
Allow for a minimum of 7 weeks for a pattern to develop
Best time to buy is on a breakout from a pattern with at least a 50% increase in volume
C of CANSLIM - Current Quarterly Earnings
25% or more in recent quarters
Research shows earnings growth is the No. 1 indicator of a stock’s potential to make big gains. That’s why it’s important for look for stocks with strong current results, as well as history of solid earnings growth
A of CANSLIM - Annual Earnings
25% or more in each of the past 3 years
N of CANSLIM - New Product, Management, Highs
Explosive stock growth doesn’t happen by accident. The biggest stock winners had new products, new management or new conditions in an industry that propelled the company to astounding height
Some investors pass over a great stock because it’s already reaching a new price high. But that’s precisely the point where many of the best stocks gain steam and begin their biggest price moves
S of CANSLIM - Supply & Demand
Most basic economic principles is the law of supply & demand and one of the places its power is most sharply demonstrated is the stock market
Strong demand for a limited supply of available shares will push a stock’s price up. On the flip side, an oversupply of shares and weak demand will cause the price to sag
L in CANSLIM - Leaders: Choosing to Win
Steer clear of laggards
When you choose stocks that have solid fundamentals, your prospects are better because you are selecting “institutional quality” stocks that get noticed by the biggest traders - the institutional investors like mutual fund and pension fund managers
I in CANSLIM - Institutional Sponsorship
Big institutional investors, like mutual funds, hedge funds, banks and insurance companies, are the driving force behind much of the trading activity in the stock market
M in CANSLIM - Market Direction
Buying a stock during a market downturn can be like trying to swim against the ocean tide: You might make some progress, but the going will be tough, and a big enough wave of selling could drown you
Technicals of CANSLIM
The Bases:
Before a stock can launch a big price run-up, it must have a solid base pattern to build upon (it’s a base, must be solid)
Institutions can’t hide their tracks
Institutions play defence at the 50-day moving average
When to sell & cash out
Is it acting right?
Big money is in the sitting
Your insurance policy - 7%
1.618 (Phi)
The ratio of any number in the Fibonacci sequence divided by the next lower number approaches this ratio
Elliott Wave Theory
Stock prices are governed by irregular cycles founded upon the Fibonacci series
Elliott Wave Theory waves
Impulse Waves move with the trend
Corrective (counter trend) moves against the trend
5 motive waves (waves 1,2,3,4,5)
3 impulse waves (waves 1,3,5)
“3 steps forward, 2 steps back”
EWT in Bull Markets
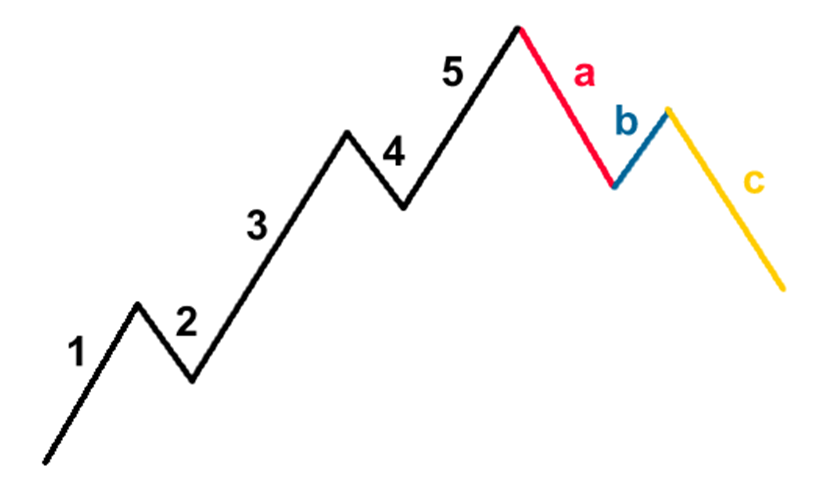
The 5 wave uptrend is then corrected and reversed by 3 wave counter trends
EWT in bear markets
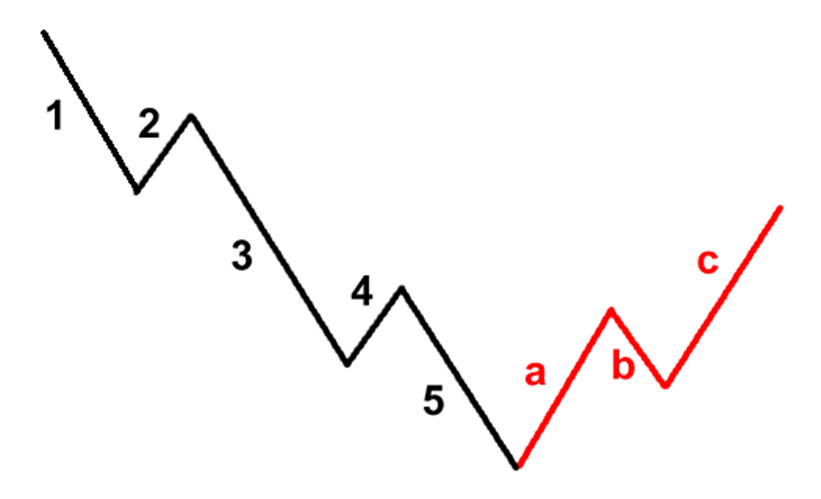
In bear markets, the same 5 - 3 wave patterns can look like this
EWT Wave Within Waves
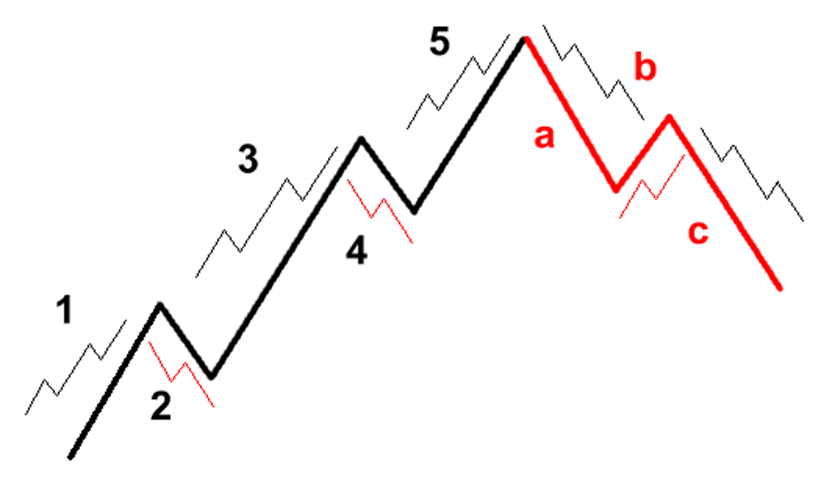
Each wave is comprised of smaller wave patterns
3 types of corrective waves
Zig zags
Flats
Triangles
Corrective wave patterns
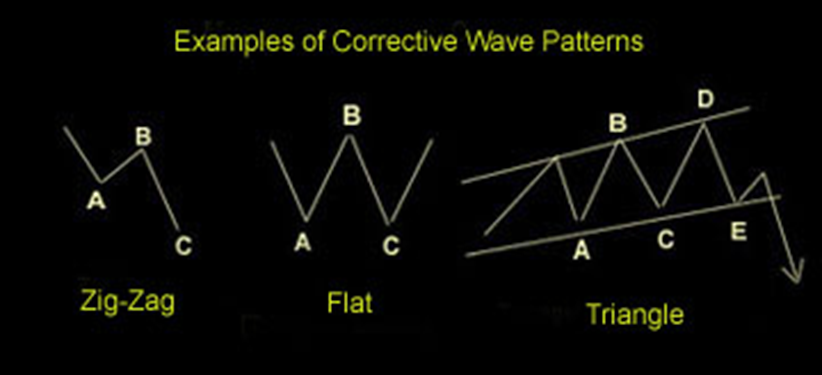
Zig Zags
A-B-C, A & C impulse, B corrective
Flats
A-B-C moves sideways with overlapping sub-waves
Triangles
Like triangle patterns with 5 waves A-B-C-D-E
EWT rules that cannot be broken and must be held
Wave 2 may not break below the origin of wave 1
Wave 3 is never shorter than wave 1 and 5, but doesn’t have to be the longest wave
Wave 4 cannot overlap the termination of wave 1
All other suggestions are guidelines
EWT Guidelines
Alternation
Equality
Truncation
Alternation
Types of corrective waves in wave 2 and 4 alternate (a flat is followed by a zig-zag or triangle)
Equality
At least 2 of the 3 impulse sub waves in a 5-sub wave sequence are often equal in length
Truncation
Occasionally the 5th wave fails to exceed the 3rd wave and gets truncated
Gann
Time is more important than price
Fan lines
Price targets according to cycles and degrees of a circle
Time from cycle high/low, to the next cycle high low can be related
Using EWT
Difficult to interpret, especially corrective waves
Much debate as to “which wave we are in”
Tendency to overanalyze
Waves are fractal
Waves known after the fact
Wave movements are related to the Fibonacci ratio
Wave 1
rarely obvious at its inception. When the first wave of a new bull market begins, the fundamental news is almost universally negative. The previous trend is considered still strongly in force. Fundamental analysts continue to revise their earnings estimates lower; the economy probably does not look strong. Sentiment surveys are decidedly bearish, put options are in vogue, and implied volatility in the options market is high. Volume might increase a bit as prices rise, but not by enough to alert many technical analysts.
Wave 2
corrects wave one, but can never extend beyond the starting point of wave one. Typically, the news is still bad. As prices retest the prior low, bearish sentiment quickly builds, and "the crowd" haughtily reminds all that the bear market is still deeply ensconced. Still, some positive signs appear for those who are looking: volume should be lower during wave two than during wave one, prices usually do not retrace more than 61.8% (see Fibonacci section below) of the wave one gains, and prices should fall in a three wave pattern.
Wave A
Corrections are typically harder to identify than impulse moves. In wave A of a bear market, the fundamental news is usually still positive. Most analysts see the drop as a correction in a still-active bull market. Some technical indicators that accompany wave A include increased volume, rising implied volatility in the options markets and possibly a turn higher in open interest in related futures markets.
Wave B
Prices reverse higher, which many see as a resumption of the now long-gone bull market. Those familiar with classical technical analysis may see the peak as the right shoulder of a head and shoulders reversal pattern. The volume during wave B should be lower than in wave A. By this point, fundamentals are probably no longer improving, but they most likely have not yet turned negative.
Wave 3
usually the largest and most powerful wave in a trend (although some research suggests that in commodity markets, wave five is the largest). The news is now positive and fundamental analysts start to raise earnings estimates. Prices rise quickly, corrections are short-lived and shallow. Anyone looking to "get in on a pullback" will likely miss the boat. As wave three starts, the news is probably still bearish, and most market players remain negative; but by wave three's midpoint, "the crowd" will often join the new bullish trend. Wave three often extends wave one by a ratio of 1.618:1.
Wave C
Prices move impulsively lower in five waves. Volume picks up, and by the third leg of wave C, almost everyone realizes that a bear market is firmly entrenched. Wave C is typically at least as large as wave A and often extends to 1.618 times wave A or beyond.
Wave 4
Prices may meander sideways for an extended period, and wave four typically retraces less than 38.2% of wave three. Volume is well below than that of wave three. This is a good place to buy a pull back if you understand the potential ahead for wave 5. Still, the most distinguishing feature of fourth waves is that they often prove very difficult to count.
Wave 5
final leg in the direction of the dominant trend. The news is almost universally positive and everyone is bullish. Unfortunately, this is when many average investors finally buy in, right before the top. Volume is lower in wave five than in wave three, and many momentum indicators start to show divergences (prices reach a new high, the indicator does not reach a new peak). At the end of a major bull market, bears may very well be ridiculed (recall how forecasts for a top in the stock market