Graphing Trig Functions
1/9
There's no tags or description
Looks like no tags are added yet.
Name | Mastery | Learn | Test | Matching | Spaced |
|---|
No study sessions yet.
10 Terms
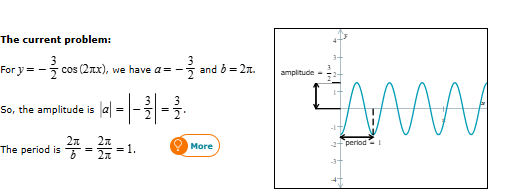
Find the amplitude and period of the function: y=-3/2cos(2πx)
Give the exact values, not decimal approximations.
Amplitude=3/2
Period=1
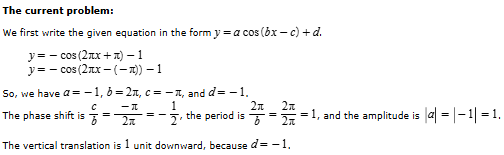
Find the phase shift, period, and amplitude of the function: y=-cos(2πx+π)-1
Give the exact values, not decimal approximations.
Phase Shift=-1/2
(because a cos(b(x-c/b))+d where “-c” is “-π” and “b” is “2π.” Do -π/2π=-1/2”)
Period=1 (because “2π/2π=1”)π
Amplitude=1
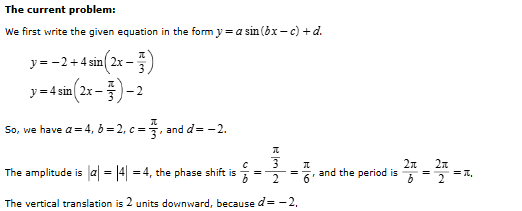
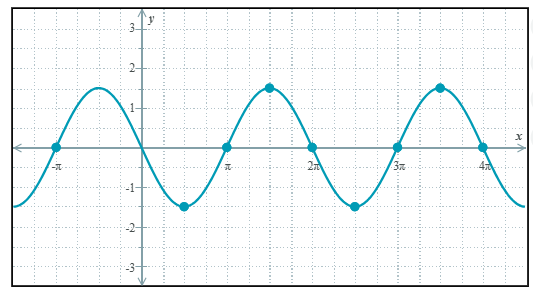
Find the amplitude, phase shift, and period of the function: y=-2+4sin(2x-π/3)
Give the exact values, not decimal approximations.
Phase Shift=π/6
Period=π
Amplitude=4
What are the domains and ranges of the following functions?
1.) y=cotx
Domain:
Range:
2.) y=cosx
Domain:
Range:
3.) y=secx
Domain
Range:
1.) y=cotx
Domain:The set of all real numbers, except integer multiples of π
Range: The set of all real numbers
2.) y=cosx
Domain: The set of all real numbers
Range: The set of all real numbers from -1 to 1
3.) y=secx
Domain: The set of all real numbers, except odd integer multiples of π/2
Range: The set of all real numbers less than or equal to -1 or greater than or equal to 1
—-
4.) y=sinx
Domain: The set of all real numbers
Range: The set of all real numbers from -1 to 1
5.) y=cscx
Domain: The set of all real numbers, except integer multiples of π
Range: The set of all real numbers less than or equal to -1 or greater than or equal to 1
6.) y=tanx
Domain: The set of all real numbers, except odd integer multiples of π/2
Range: The set of all real numbers
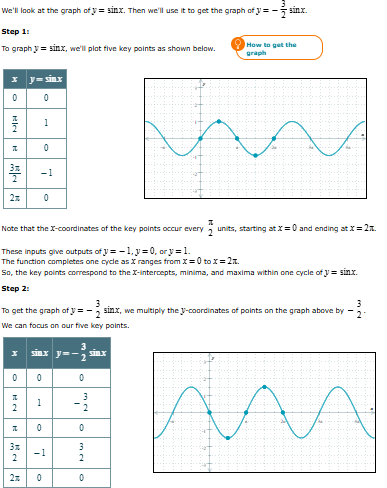
Graph the trigonometric function: y=-3/2sinx
Plot all points corresponding to -intercepts, minima, and maxima within one cycle. Then click on the graph-a-function button.
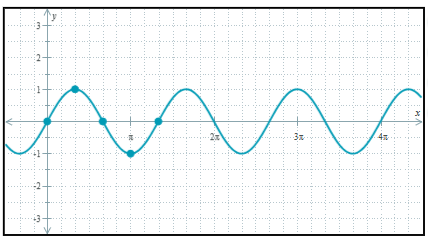
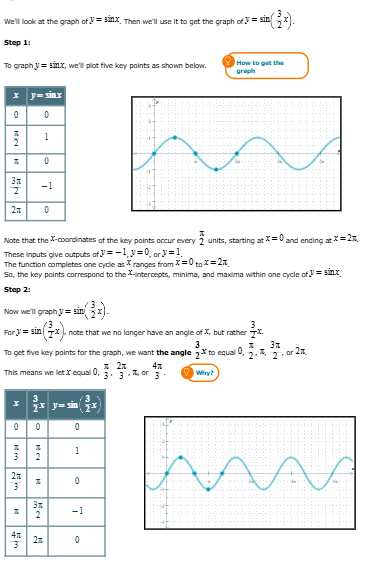
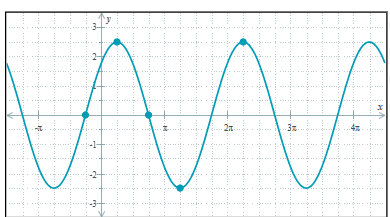
Graph the trigonometric function: y=sin(3/2x)
Plot all points corresponding to -intercepts, minima, and maxima within one cycle. Then click on the graph-a-function button.
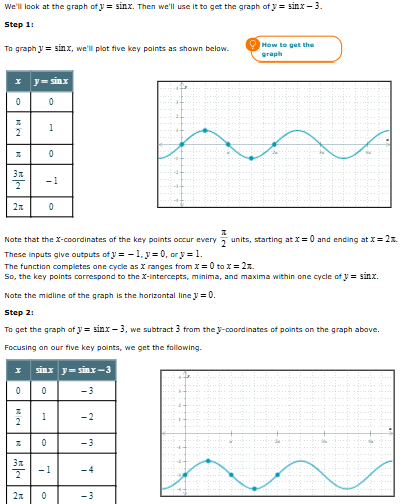
Graph the trigonometric function: y=sinx-3 Plot all points corresponding to minima and maxima within one cycle. Within that cycle, also plot all points along the "midline" (points whose -coordinates are midway between the function's minimum and maximum values). Then click on the graph-a-function button.
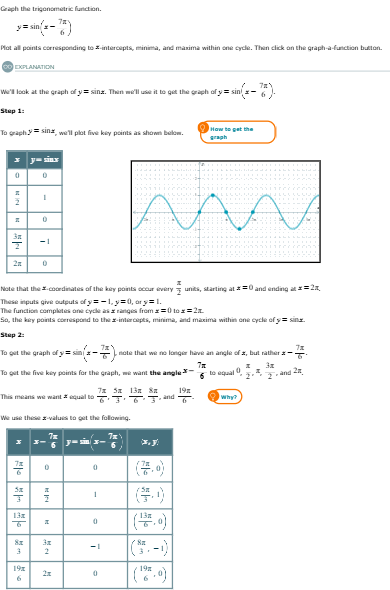
Graph the trigonometric function:
y=sin(x-7π/6)
Plot all points corresponding to -intercepts, minima, and maxima within one cycle. Then click on the graph-a-function button.
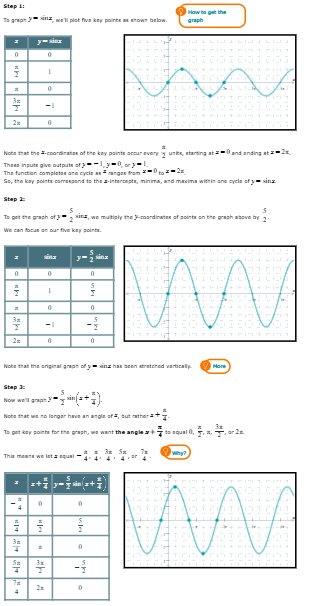
Graph the trigonometric function:
y=5/2sin(x+π/4)
Plot all points corresponding to -intercepts, minima, and maxima within one cycle. Then click on the graph-a-function button.
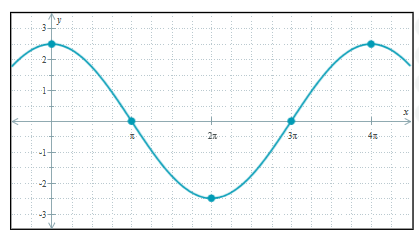
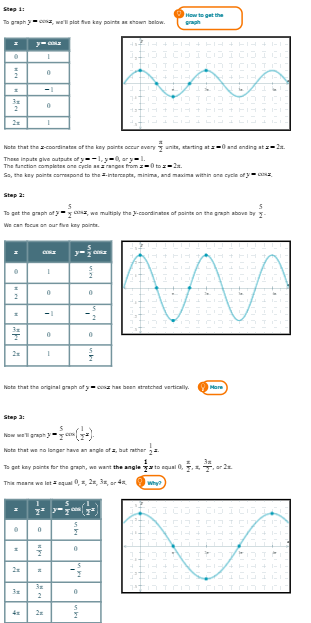
Graph the trigonometric function:
y= 5/2cos(1/2x)
Plot all points corresponding to -intercepts, minima, and maxima within one cycle. Then click on the graph-a-function button.