Freaky stats
1/17
Earn XP
Description and Tags
Stats that make me go freaky
Name | Mastery | Learn | Test | Matching | Spaced | Call with Kai | Chat |
|---|
No analytics yet
Send a link to your students to track their progress
18 Terms
How to compute proportion (in treatments or control groups)
A proportion is computed by dividing the number of successes in a sample by the total number of observations in that group. It is often expressed as a fraction, decimal, or percentage. (19/27 ~ 0.70 → 70%)
Examples for sampling bias
Non-response / Convenience sample (not generalizable to entire population)
Why randomize and make replicable
You randomize to account for variables that cannot be controlled / The more studies are done, the more accurate an estimate will be
What are explanatory variables
independent variables (so the variables you control in an experiment)
what are blocking variables
confounders / non confounders (possible interfering factors) so you take them into account and randomize them
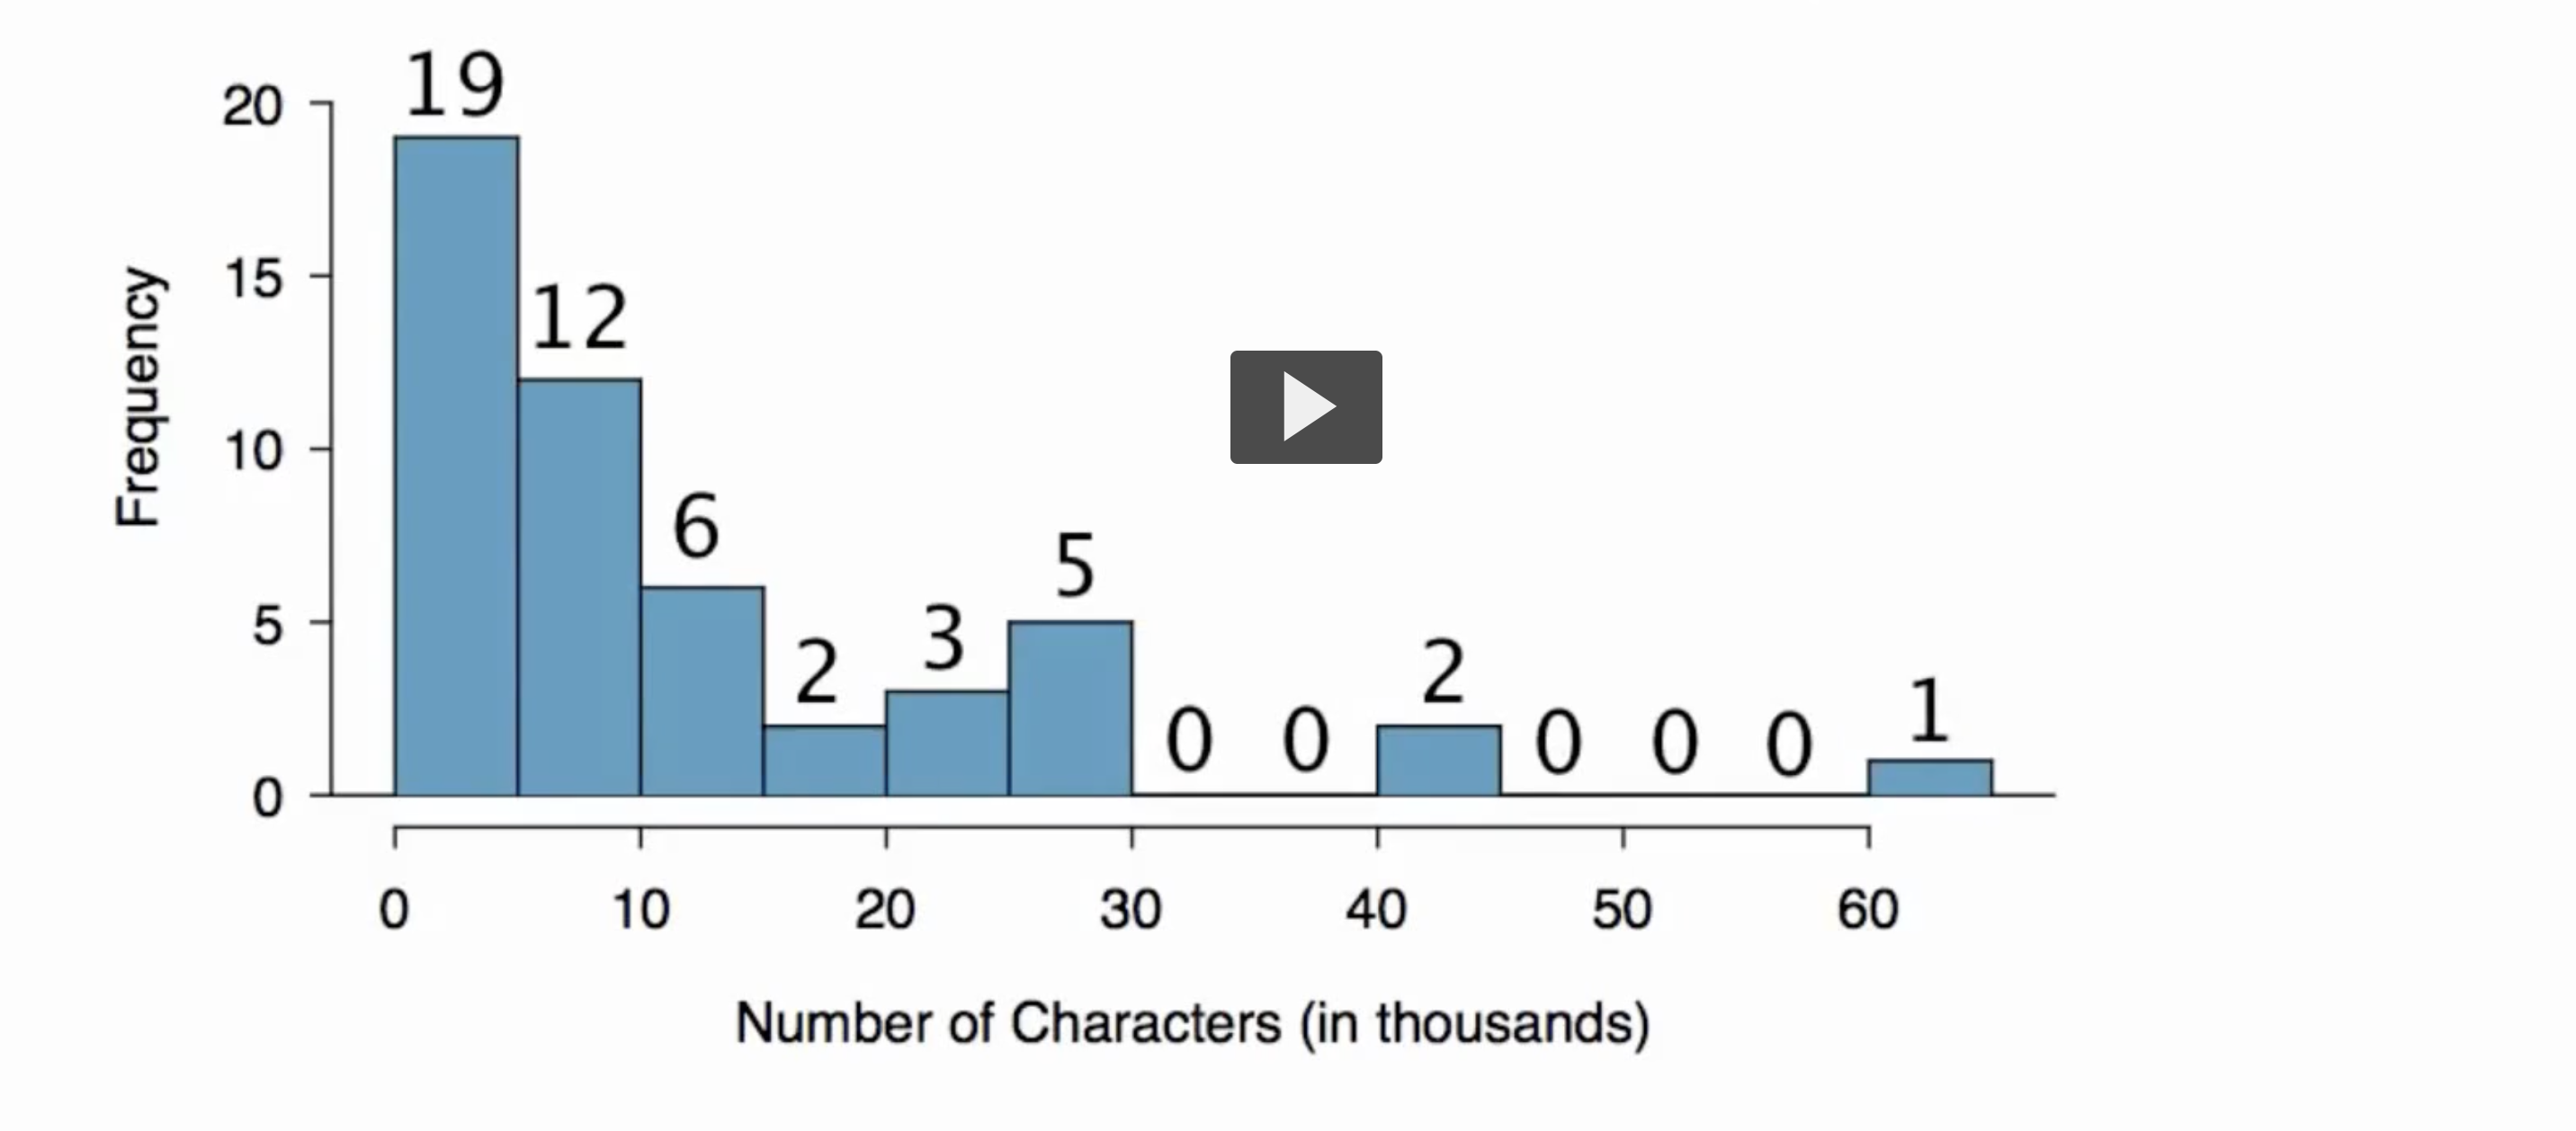
histogram
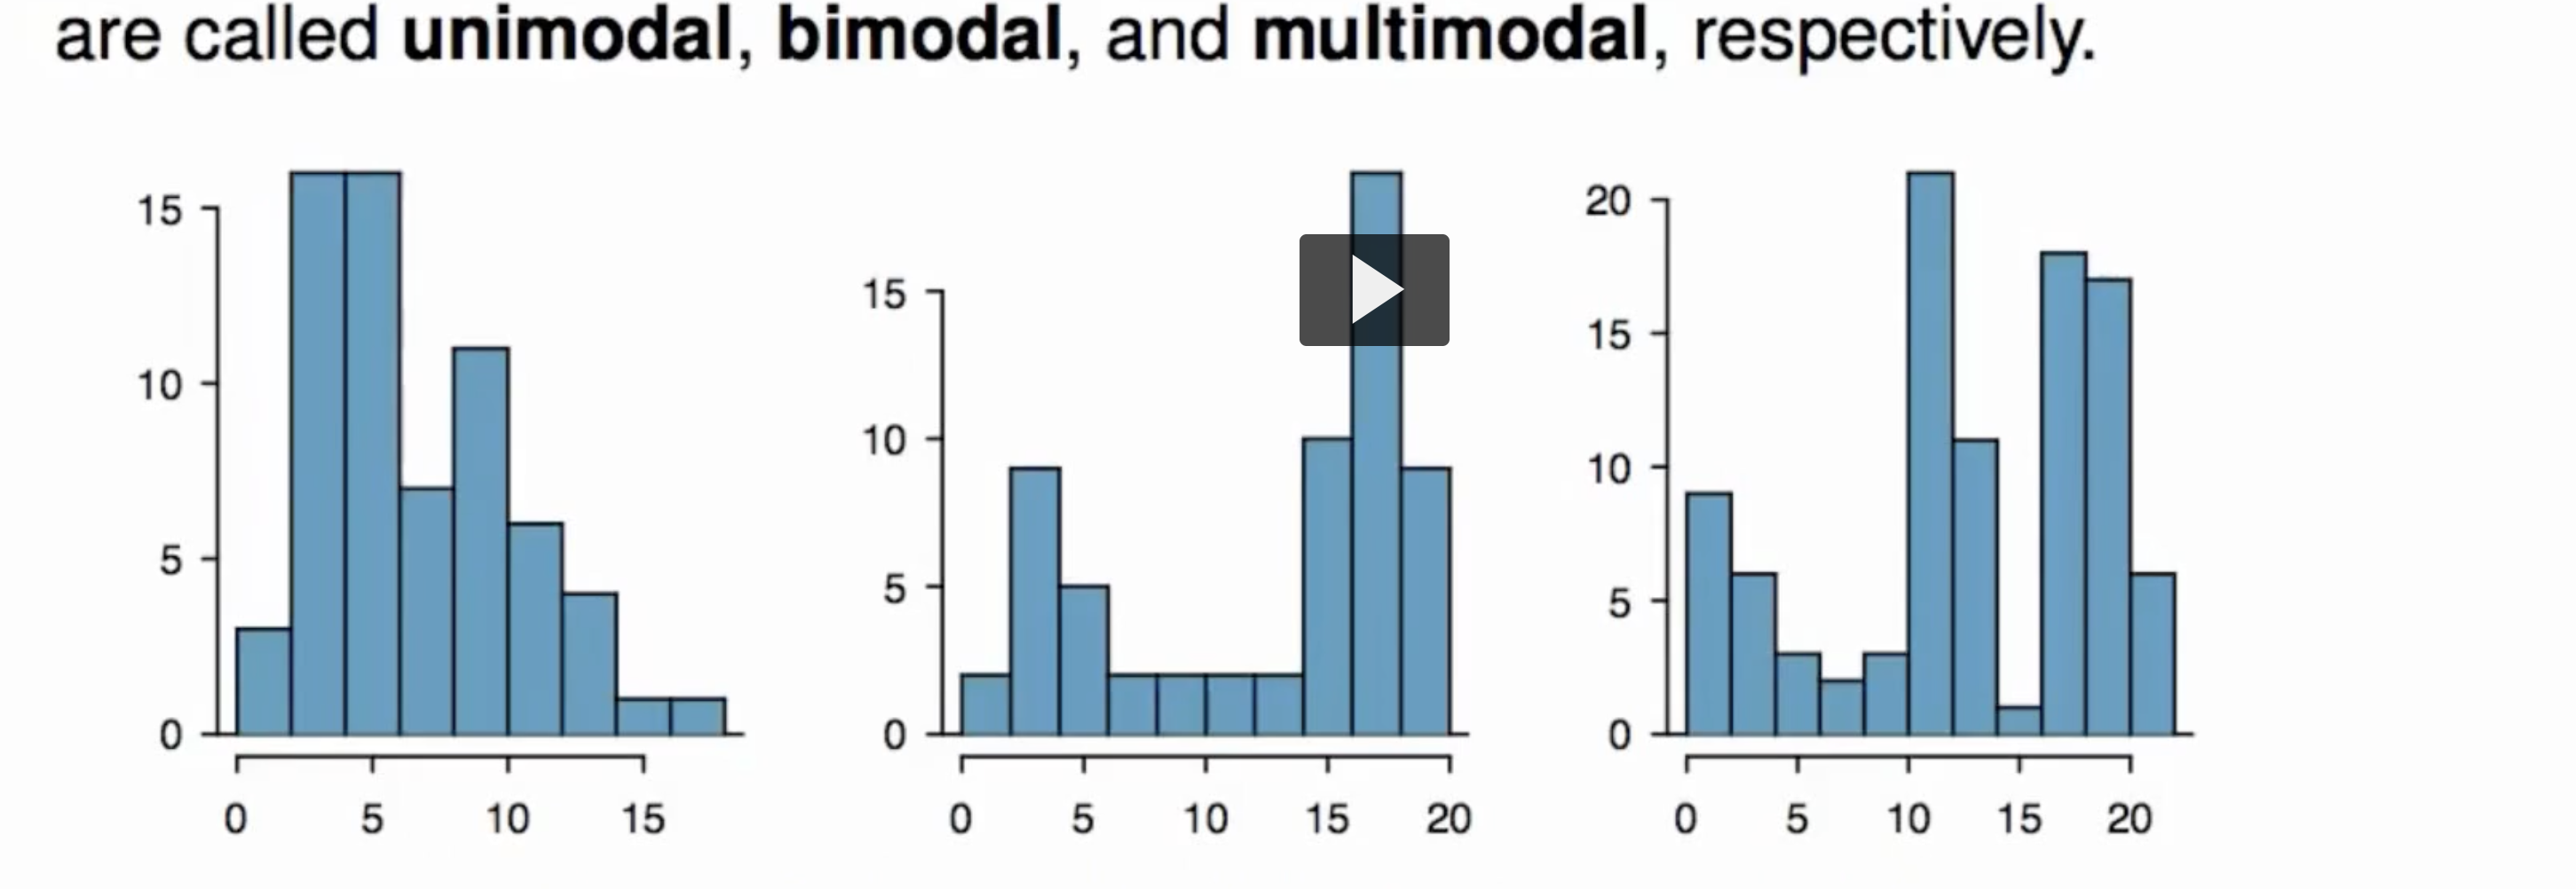
different modes
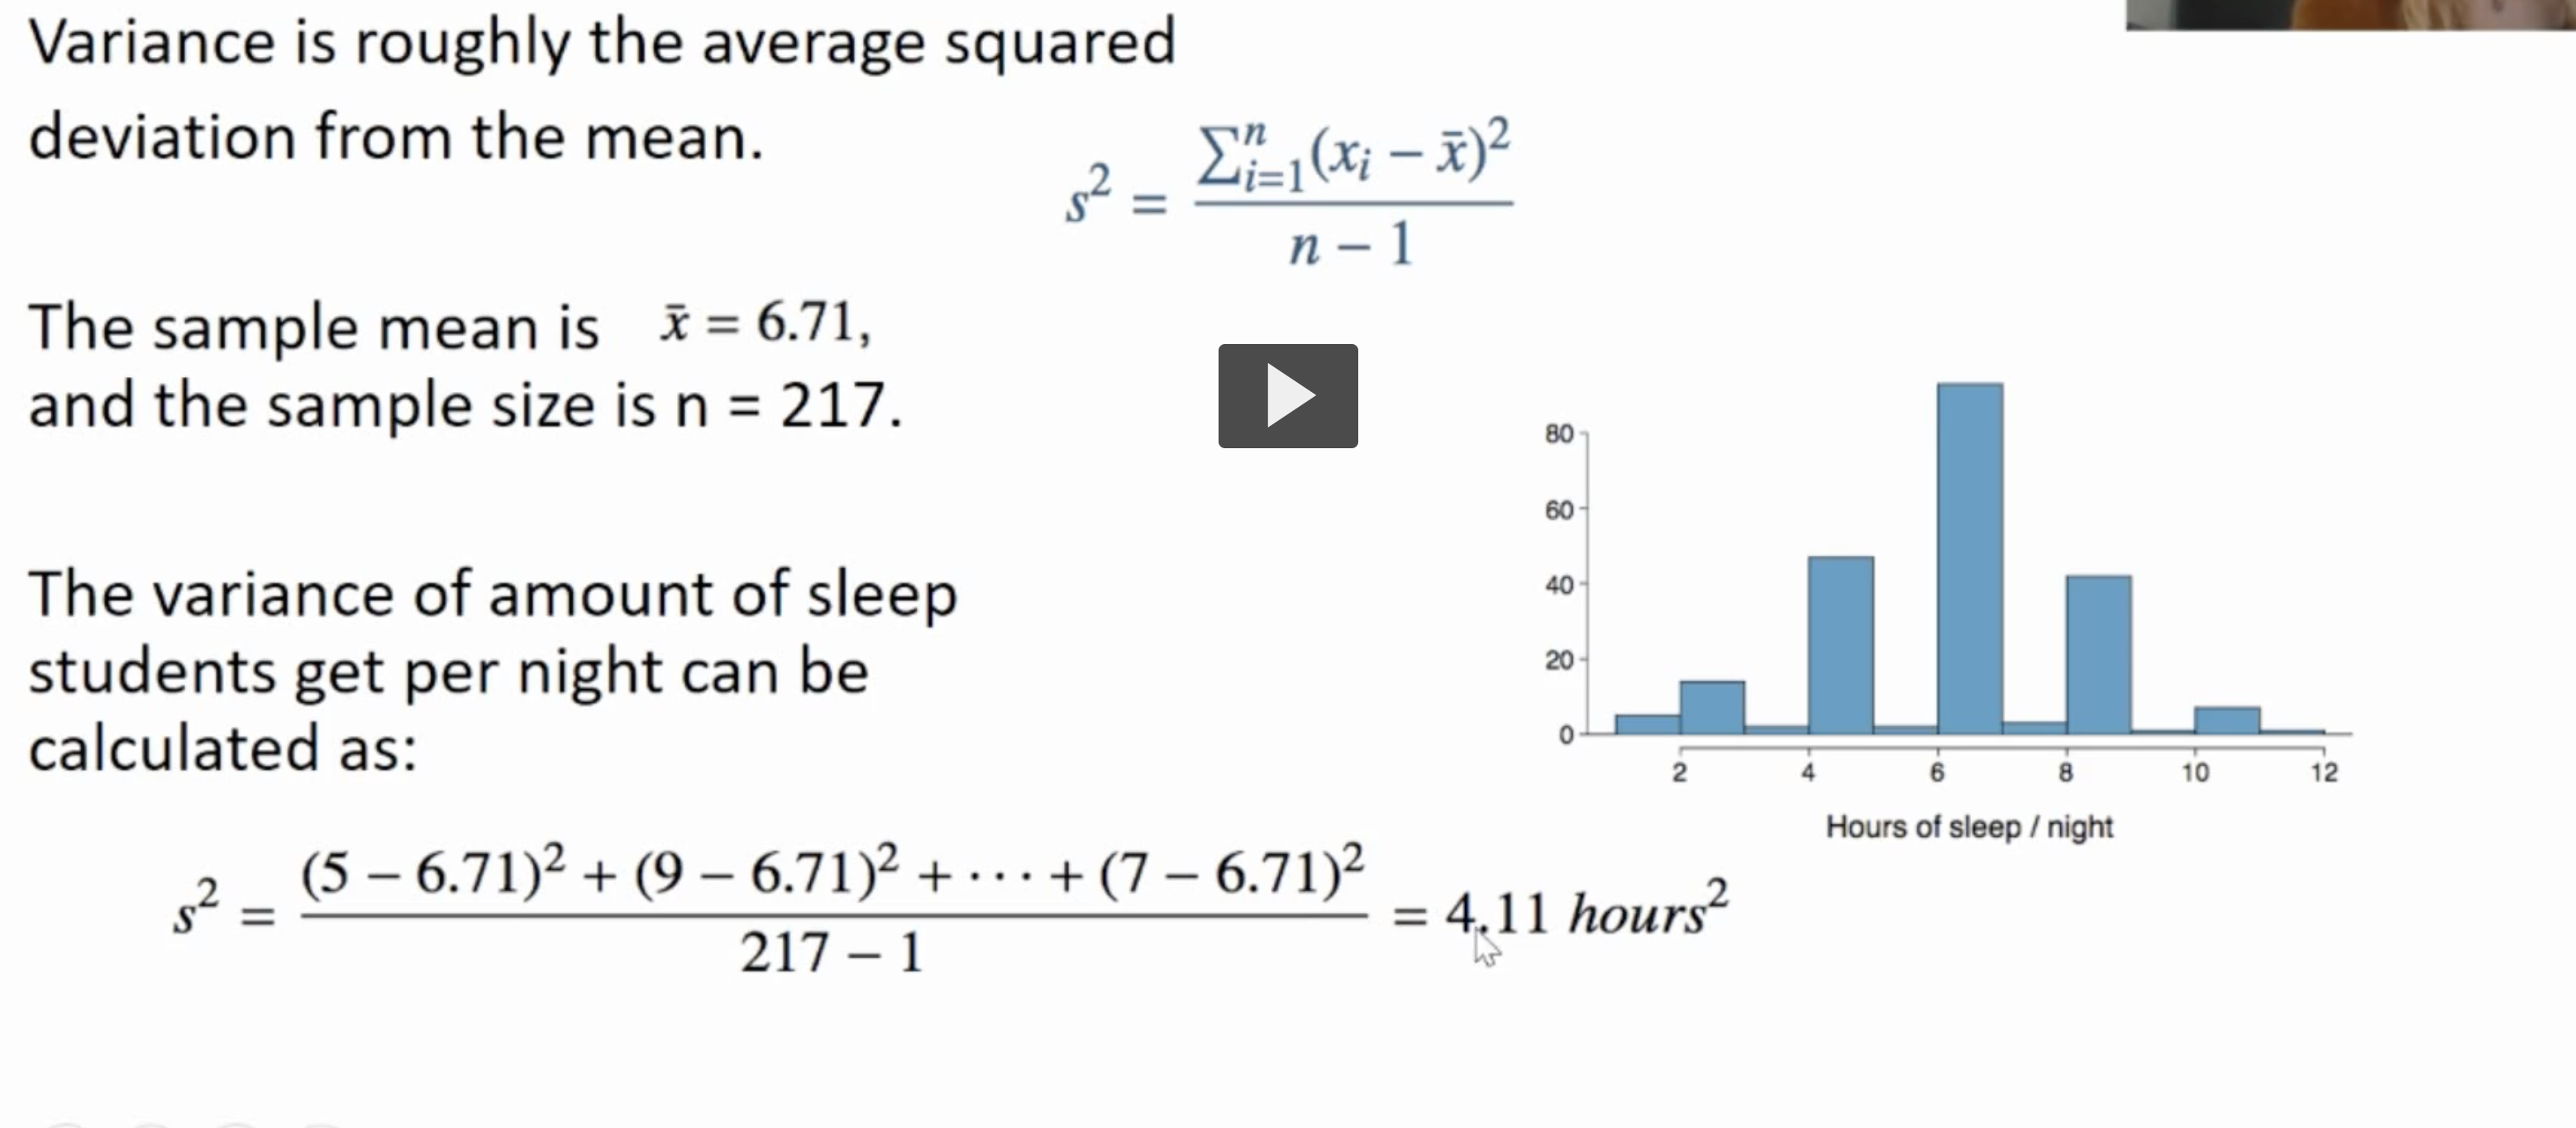
what is the variance
The variance is roughly the average squared distance from the mean
What is the standard deviation
The standard deviation is the square root of the variance, and it roughly describes how far away the typical observation is from the mean
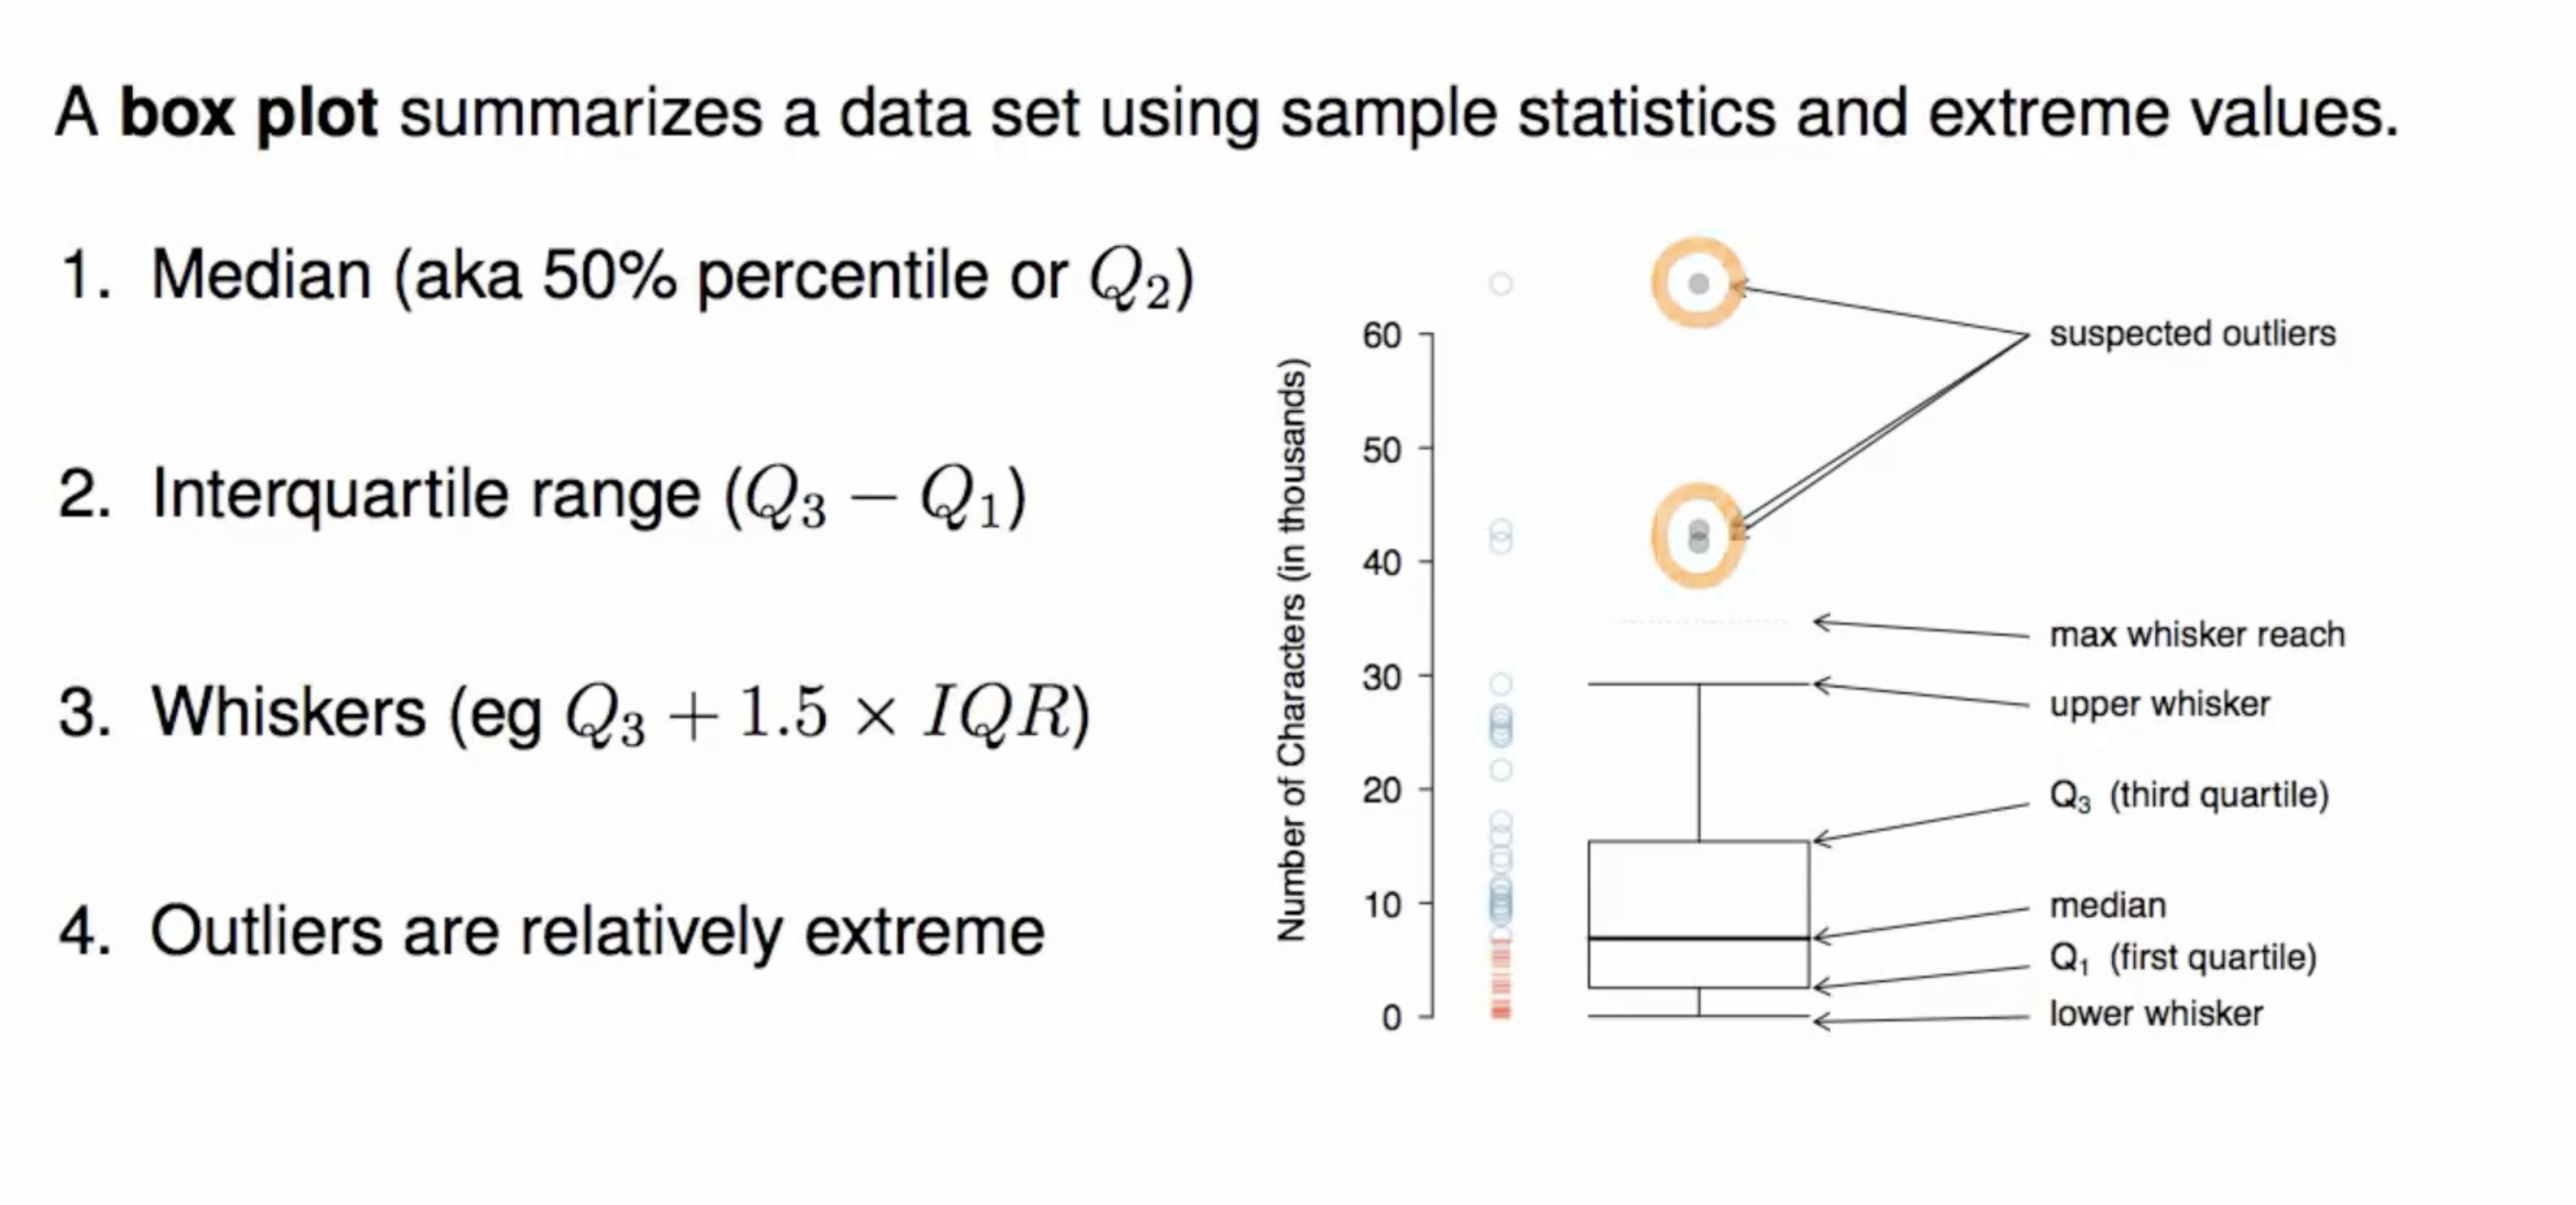
What is a box plot
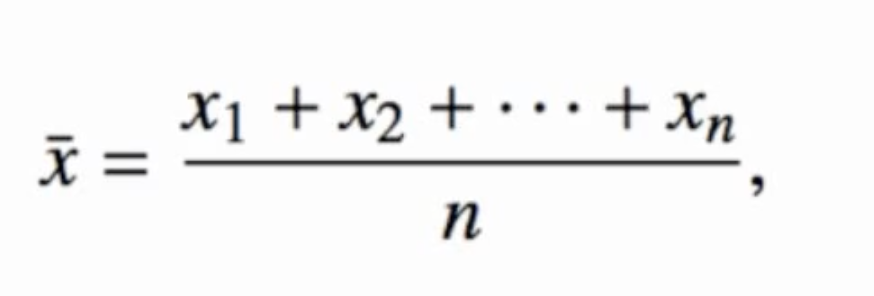
how to compute the sample mean
how to compute the variance
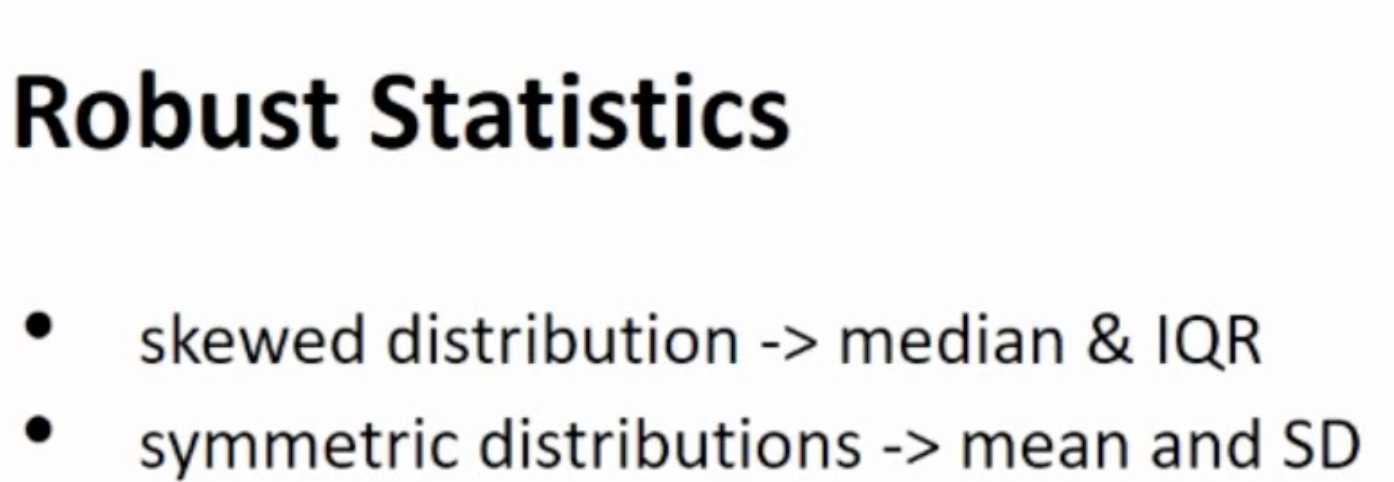
robust statistics
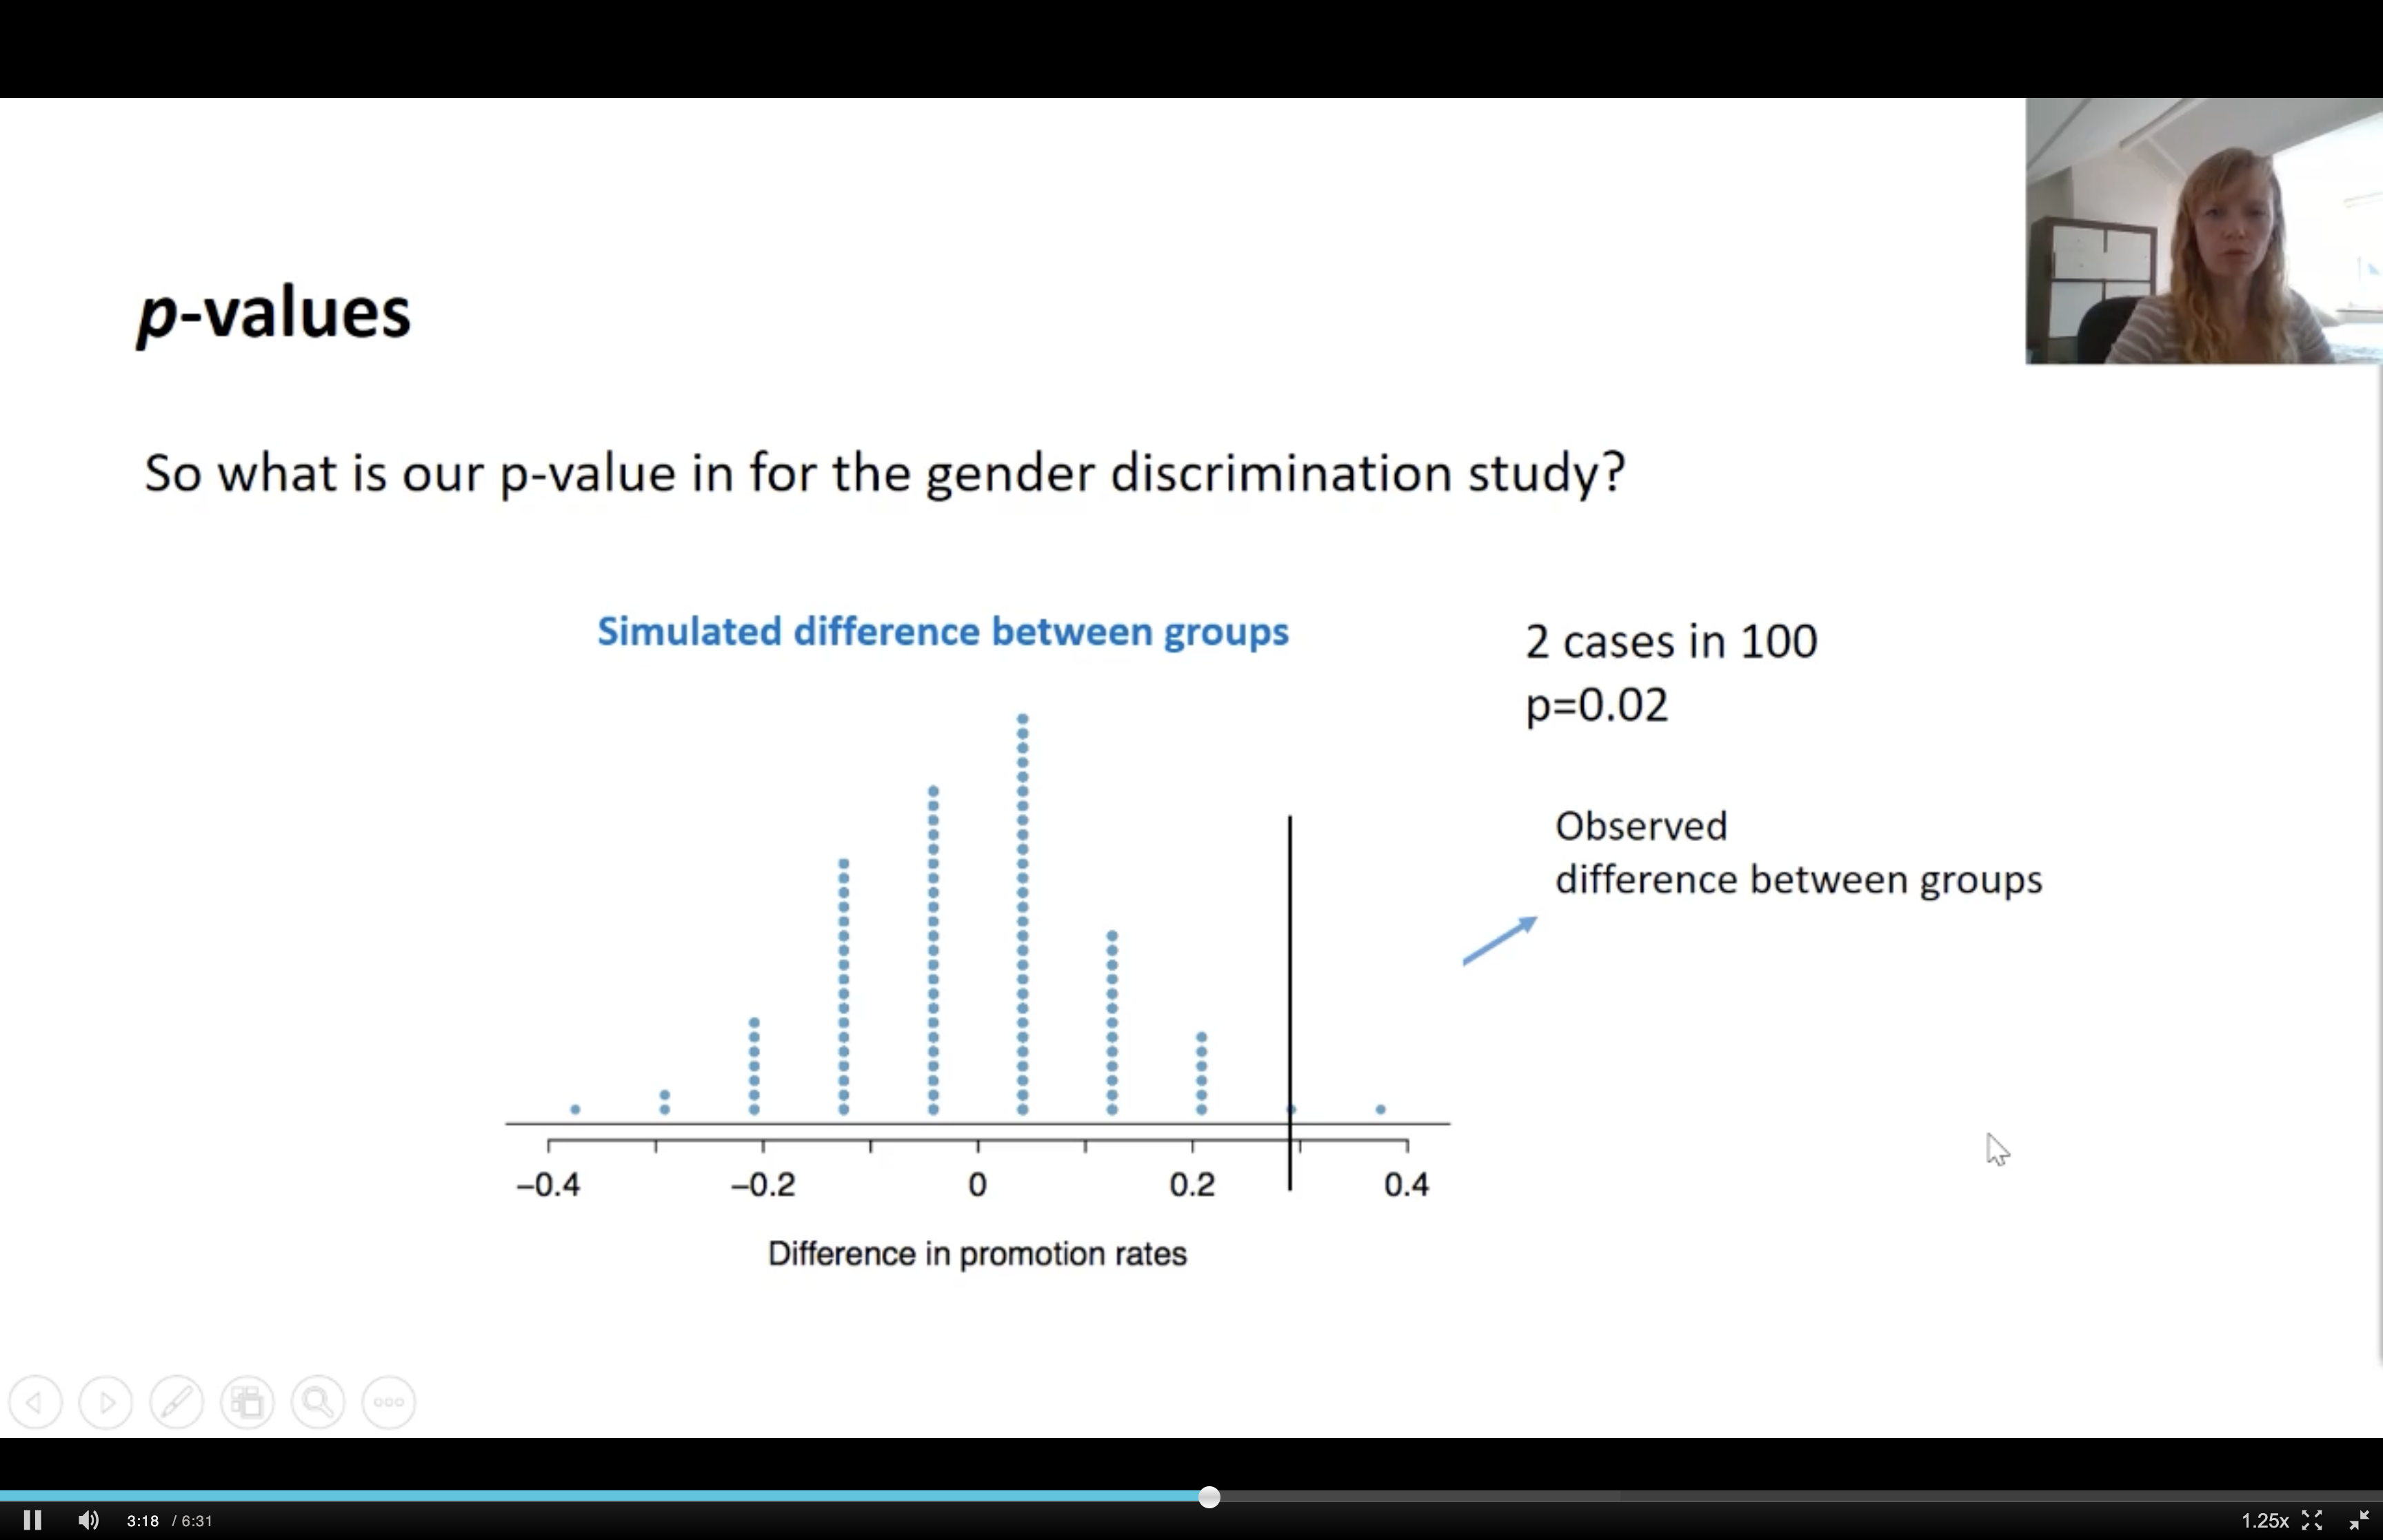
P values
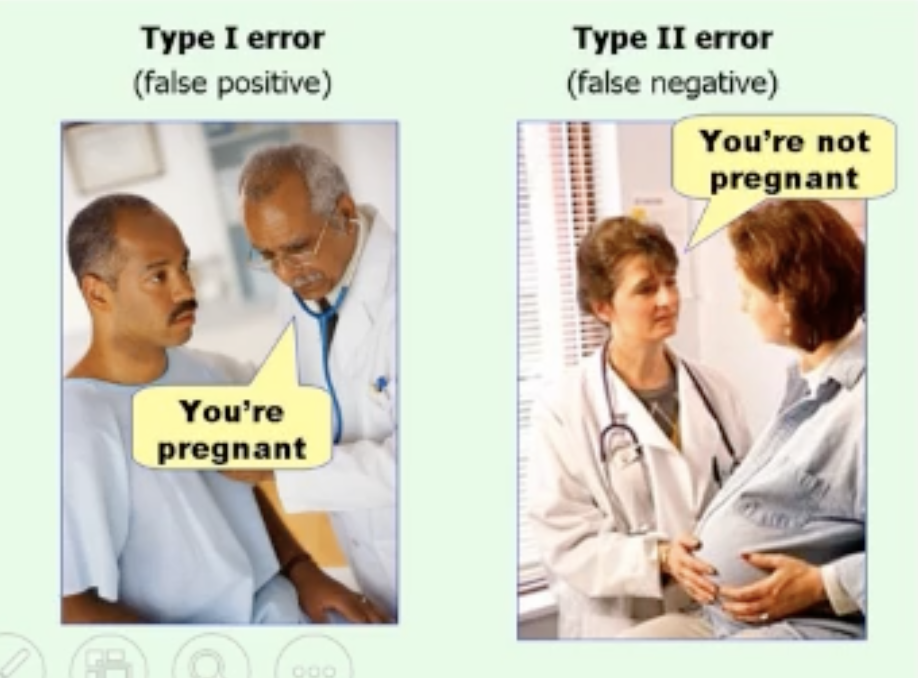
type 1 and 2 errors
What is the P value