Counting Statistics
1/24
Earn XP
Description and Tags
Subgroup I: Radiation Physics and Detection
Name | Mastery | Learn | Test | Matching | Spaced | Call with Kai | Chat |
|---|
No analytics yet
Send a link to your students to track their progress
25 Terms
In nuclear medicine, statistics has two main uses
describing the amount of uncertainty associated with a measurement
determining whether or not equipment is functioning normally
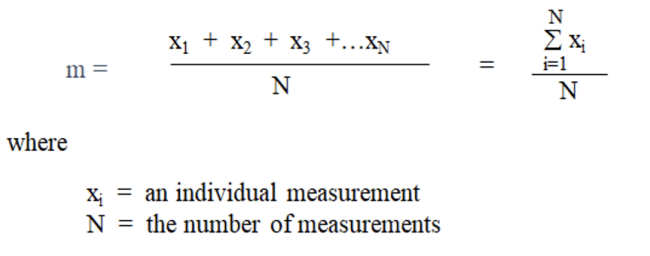
sample mean
measure of central tendency
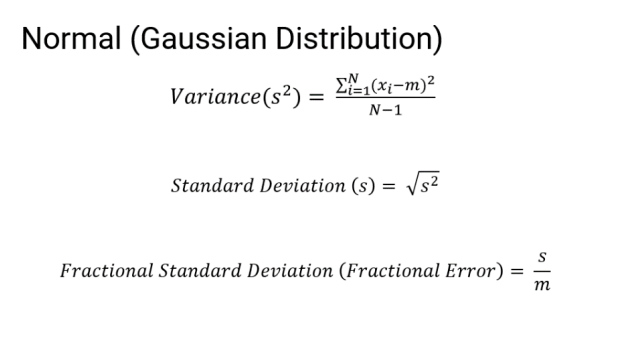
variance
quantifies the amount of internal fluctuation in the data set
standard deviation
a measure of the dispersion around the mean
fractional standard deviation (coefficient deviation)
measure of the precision, usually expressed as a percent
frequency distributions
Binomial
Poisson
Gaussian (normal)
Binomial distribution
applies to data of a yes or no variety
depends on number of successes and number of failures
Poisson distribution
applies to data sets that are very large
used to approximate the binomial distribution
only depends on the mean
Gaussian (normal) distribution
applies when the mean value >20
used as an approximation of Poisson distribution
radiation measurements
only have a single number N to represent the population distribution
we assume that the measurement is close to the mean
radiation measurement of standard deviation
SD = √N
radiation measurement of fractional standard deviation
fractional SD = k/√N
(k = 1 for 68% confidence level)
(k = 2 for 95% confidence level)
(k = 3 for 99% confidence level)
radiation measurement percent error
percent error = FSD * 100 = 100k/√N
(k = 1 for 68% confidence level)
(k = 2 for 95% confidence level)
(k = 3 for 99% confidence level)
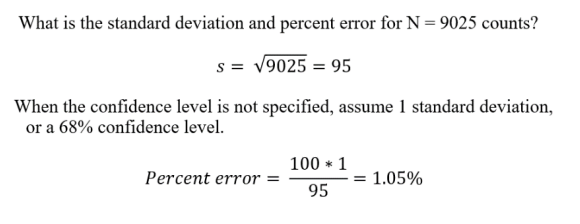
What is the standard deviation and percent error for N = 9025 counts?
s = 95
percent error = 1.05%
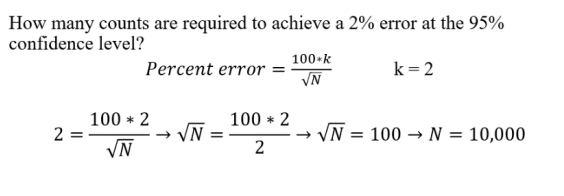
How many counts are required to achieve a 2% error at the 95% confidence level?
10,000 counts
percent error is a measure of
precision
When the counts increase, the precision ___ and percent error ___
increases, decreases
For a given count rate, the percent error can be decreased by
counting longer
Due to propagation of errors, we must make sure that
uncertainties are calculated, so that the final results can be expressed more accurately
Chi-square test
statistically testing equipment for proper operation
determines how well the measured counts ‘fit’ the Poisson distribution
deviation from the assumed distribution implies faulty equipment performance
Chi-square test ideal probability
0.5
Chi-square probability (p-value) acceptable range
0.1 - 0.9
Chi-square p-value < 0.1
the data is too random
Chi-square p-value > 0.9
the data is not random enough
If the p-value for a Chi-square test is outside the 0.1-0.9 acceptable range
the equipment should not be used