AP Statistics CH 5 Summarizing Bivariate Data
0.0(0)
Card Sorting
1/14
Earn XP
Description and Tags
Study Analytics
Name | Mastery | Learn | Test | Matching | Spaced |
|---|
No study sessions yet.
15 Terms
1
New cards
bivariate data
data with 2 variables; shown using a scatterplot
2
New cards
describe a scatterplot using DUFS
D - direction (+/-)
U - unusual occurrences
F - form (linear/nonlinear)
S - strength (strong/moderate/weak)
U - unusual occurrences
F - form (linear/nonlinear)
S - strength (strong/moderate/weak)
3
New cards
correlation coefficient (r)
measures the strength of any linear relationship
0.8 < r < 1 = strong
0.5 < r < 0.8 = moderate
0 < r < 0.5= weak
- has the same sign as the slope (b)
- switching x and y does not matter
- not resistant to outliers
- cannot imply causation, only association/correlation
0.8 < r < 1 = strong
0.5 < r < 0.8 = moderate
0 < r < 0.5= weak
- has the same sign as the slope (b)
- switching x and y does not matter
- not resistant to outliers
- cannot imply causation, only association/correlation
4
New cards
least-squares regression line
ŷ = a + bx
a = average/mean of y when x=0
b = slope; for every 1 unit increase y increases by ___
- describes the linear relationship between the explanatory and response variable
- goal is to minimize residuals
- always passes through (x̄ , ȳ)
a = average/mean of y when x=0
b = slope; for every 1 unit increase y increases by ___
- describes the linear relationship between the explanatory and response variable
- goal is to minimize residuals
- always passes through (x̄ , ȳ)
5
New cards
creating a LSRL without data
b = r(Sy/Sx)
ȳ = a + bx̄
ŷ = a + bx
ȳ = a + bx̄
ŷ = a + bx
6
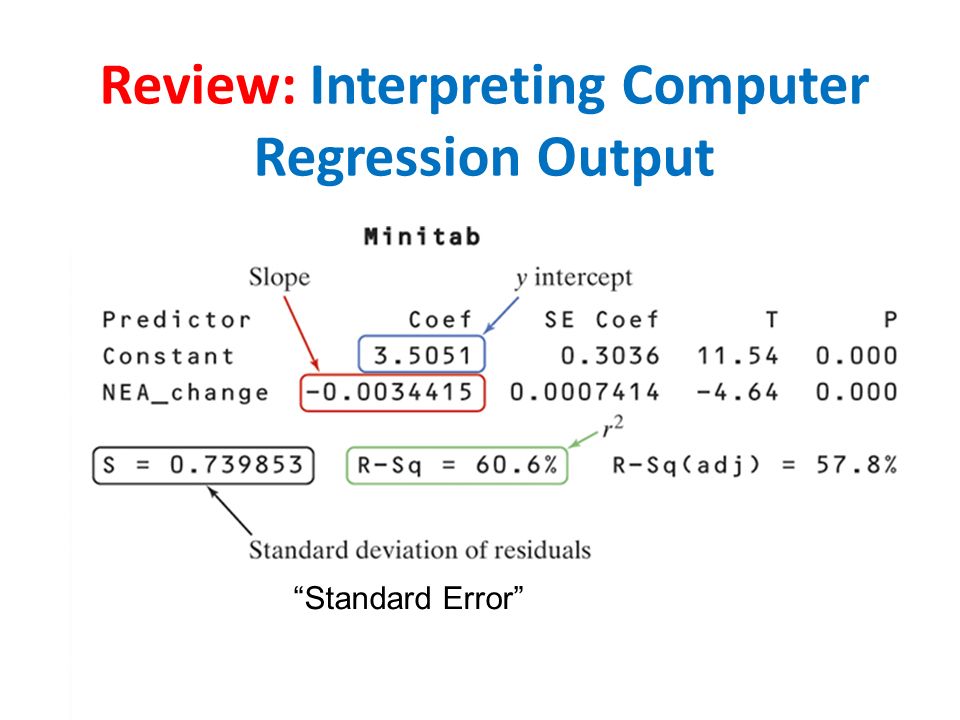
New cards
minitab outputs
a = y-intercept
b = slope
s = standard deviation
R-sq = r^2
b = slope
s = standard deviation
R-sq = r^2
7
New cards
extrapolation
- prediction outside the range of x-values
- we cannot assume the linear pattern continues forever outside the range
- we cannot assume the linear pattern continues forever outside the range
8
New cards
residual
y - ŷ
observed y - predicted y
- error between the predicted LSRL value and the actual data value
observed y - predicted y
- error between the predicted LSRL value and the actual data value
9
New cards
residual predictions
- over-prediction: negative residual
- under-prediction: positive residual
- under-prediction: positive residual
10
New cards
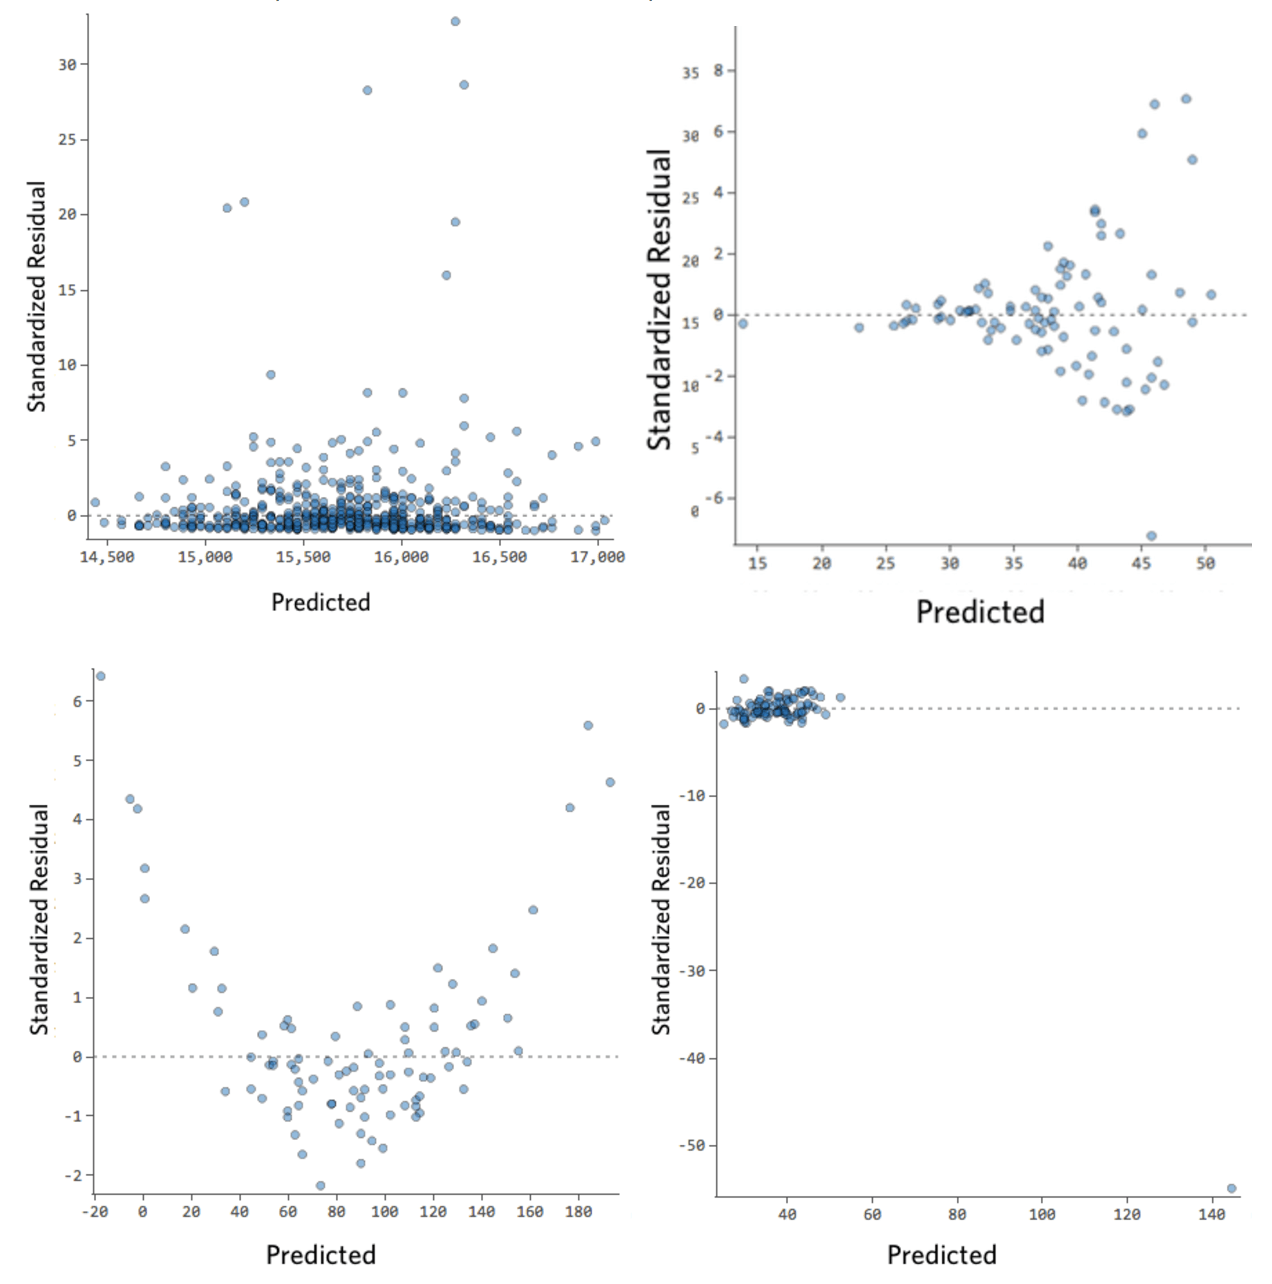
residual plots
- shows whether a linear plot is good for data
- plot (x , residual)
- a GOOD residual plot has random scatter
- a BAD residual plot is curved, fanning or isolated points
- plot (x , residual)
- a GOOD residual plot has random scatter
- a BAD residual plot is curved, fanning or isolated points
11
New cards
influential points
- points that fall far below/above the horizontal line
- x-value varies significantly from the others
- heavy influence on the LSRL
- a significant change in slope indicates influential point
delete the value and recalculate the LSRL to determine if it is influential
- x-value varies significantly from the others
- heavy influence on the LSRL
- a significant change in slope indicates influential point
delete the value and recalculate the LSRL to determine if it is influential
12
New cards
coefficient of determination (r^2)
- the proportion of variability in y that can be attributed to an approximate relationship between x and y
- how much of y is explained by x?
"___% of the variability in [y] can be explained by [x]."
- how much of y is explained by x?
"___% of the variability in [y] can be explained by [x]."
13
New cards
standard deviation of residuals (s)
- the typical error between data points and the LSRL
strong correlation = low standard deviation
weak correlation = high standard deviation
"The typical amount of variability from the observed [y] to the regression line is [s]."
strong correlation = low standard deviation
weak correlation = high standard deviation
"The typical amount of variability from the observed [y] to the regression line is [s]."
14
New cards
exponential model
original: y = ab^x
transformed: lnŷ = a + bx or logŷ = a + bx
- only change either x or y
transformed: lnŷ = a + bx or logŷ = a + bx
- only change either x or y
15
New cards
power model
original: y = ab^x
transformed: lnŷ = a + b(lnx) or logŷ = a + b(logx)
- change both x and y
transformed: lnŷ = a + b(lnx) or logŷ = a + b(logx)
- change both x and y