Clustering
1/24
There's no tags or description
Looks like no tags are added yet.
Name | Mastery | Learn | Test | Matching | Spaced | Call with Kai |
|---|
No analytics yet
Send a link to your students to track their progress
25 Terms
What is clustering?
Cluster analysis is a technique used to group similar data points based on their characteristics.
It helps:
Visualising high dimensional data
Structuring data
Classification
How does clustering relate to EDA?
Cluster analysis is a key EDA tool because it:
Shows hidden patterns within data
Reveals structure in high-dimensional datasets that are otherwise hard to visualize
Generates hypotheses by identifying meaningful segments (e.g., customer types)
Reduces data complexity by summarizing observations into clusters
Supports visualization, such as dendrograms or scatter plots with clusters colored distinctly
Main limitation of clustering
Different ways to measure distance between points which changes which points are grouped together
Using different clustering methods gives different groups
Sometimes clusters don’t match real/meaningful groups in data
There’s no correct way to form clusters
Types of clustering
Hierarchical clustering
K-means clustering
What is hierarchical clustering, and what are its two main approaches?
Hierarchical clustering builds a tree (hierarchy) of clusters.
Two main approaches:
Agglomerative (bottom-up):
Start with each point alone, then keep merging the closest clusters until there’s only one big cluster.
Divisive (top-down):
Start with all points in one cluster, then keep splitting into smaller clusters step by step.
Distance measures used in clustering
Euclidean distance
Straight-line distance between two points, like drawing a line between them. Good for simple number data.
Manhattan distance:
Add steps you’d take along a grid
Cosine Similarity:
Looks at the angle between two data points
Linkage methods in Hierarchical clustering
Decide how we measure the distance between clusters when we merge them.
Methods:
Single linkage
Complete linkage
Single Linkage
Use the closest points between two clusters → can create long, chain-like clusters
Complete Linkage
Use furthest points between 2 clusters → makes tighter, rounder clusters
Agglomerate (bottom-up) Clustering Method Steps:
Treat each observation as its own cluster
Measure distances between each observation (each cluster) using a distance metric (eg. Euclidean)
Find 2 closest clusters and merge them
Recalculate distances between clusters using single or complete linkage
Repeat steps 2-4 until only 1 cluster remains
Advantages vs Disadvantages of hierarchical clustering
Advantages:
don’t need to choose number of clusters before starting
produces dendogram which shows order in which clusters were merged
Great for small-medium datasets
Disadvantages:
Slow for large datasets
Sensitive to outliers and messy data
Once clusters are merged they can’t be split
Dendogram
Tree diagram that shows how data points were grouped in hierarchical clustering
How to read:
X-axis:
Shows data points (observations before clustering)
Y-axis:
Shows how far apart clusters were when combines
Height of each horizontal line (called a “merge”) shows distance between clusters
Low line = Very similar
High line = Less similar
What does long horizontal line mean:
Shows a big jump in distance (2 very different clusters merged)
Helps spot clear breaks in data where you can cut the tree
How to choose number of clusters
Cut the tree horizontally at a height where there’s a stable number of clusters (a small change in height won’t change the number of clusters) -→ look for long horizontal lines
Wherever the cut crosses vertical lines tell you how many clusters you’ll get
Choosing number of clusters
No one correct answer
Too few clusters makes clustering pointless
Too many clusters may be hard to interpret or use
Non-hierarchical clustering
Used when exact number of clusters is known
Example: k-means clustering
K-means Clustering Optimising Clusters
In clusters (k groups), each point is closest to its own cluster’s mean (centroid)
A point cant be closer to the mean of a different cluster
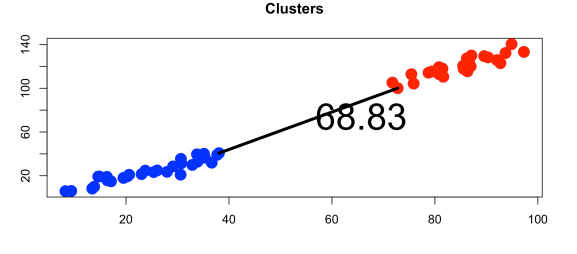
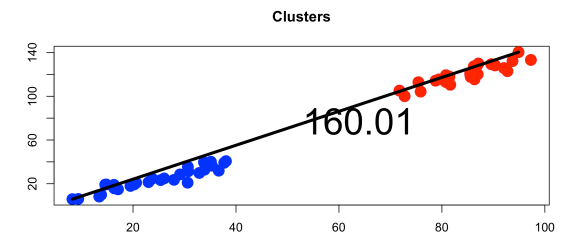
Minimises sum of squares within cluster (tries to keep points in a cluster as close to the centroid as possible
Steps of k-means clustering
Pick how many clusters (K) you want.
Choose starting points (centroids) for each cluster (often randomly).
Put each data point into the closest group (based on distance).
Move each centroid to the average location of the points in the cluster.
Repeat steps 3–4 until there’s minimal change
Algorithms for solutions to k-mean
These alogirthms are used because k-means is a NP-hard problem
There’s no quick way to guarantee finding the best clustering
Instead of trying all combinations we use the following heuristics:
Lloyd’s Algorithm
Hartigan-Wong theorem
Lloyd’s Algorithm
Pick starting centroids (often random)
Put each point in a cluster with the closest centroid
Move each centroid to the mean of all observations in the cluster
Repeat steps 2-3 until there’s no more change
Label Switching in k-means clustering
Cluster labels (eg.1,2,3) are arbitrary and can change. The labels don’t metter
Outputs from the kmeans() function in R?
cluster: A vector showing the cluster assignment of each data point
centers: Coordinates of the centroids (mean values of variables) of each cluster
size: Number of observations in each cluster
Why is comparing cluster solutions difficult?
There’s no correct answer
Different methods of clustering give different results
Robustness
Means cluster solutions stay consistent even if algorithm changes
Check robustness by:
Compare results from different methods
Use Rand Index(RI) or Adjusted Rand Index(ARI)
Rand Index
Measures how similar cluster groupings using 2 different methods are
0=no agreement
1= perfect agreement
Adjusted Rand Index
Improves rand index by adjusting for agreement that might happen due to chance
0=no agreement
1=perfect agreement
Advantages + disadvantages k-means clustering
Advantages:
Fast when there is a large number of observations
the number of clusters is known
when there is no obvious hierarchy in the data
Disadvantages:
Must choose number of clusters at the start and its not always obvious
Random starting centroids give different result every time
Doesn’t always find best solution (depends on starting centroids)