Week 4: Measles as a tracker epidemic disease
1/36
There's no tags or description
Looks like no tags are added yet.
Name | Mastery | Learn | Test | Matching | Spaced |
|---|
No study sessions yet.
37 Terms
Measles as a tracker epidemic disease
Given the wide range of infectious diseases avialble for study, much attention in epidemic modelling on a single disease is that caused by the measles virus.
With the overall fall in measles mortality in Western countries over this century, the widespread choice of measles as a marker disease might well seem somewhat puzzling.
7 reasons why it forms the ‘disease of choice’ for studying epidemic waves
Virological
Epidemiological
Clinical
Statistical
Geographical
Mathematical
Humanitarian
Virological reasons
Characterizes one of the simplest (epidemiological behaviour) of all the infectious diseases--WHO.
4 of such include:
Its direct transmission
Relatively fixed duration of infectivity
The lasting immunity which it generally confers
The measles virus is not thought to undergo significant structural changes.
have made it possible to lay the foundations of a statistical theory of epidemics.
Diagram depicts the spread of disease from birth → death
AIDS movie: Virological
Hepatitis
a + b + c
Bathhouses + gay men + symptoms (cancer)
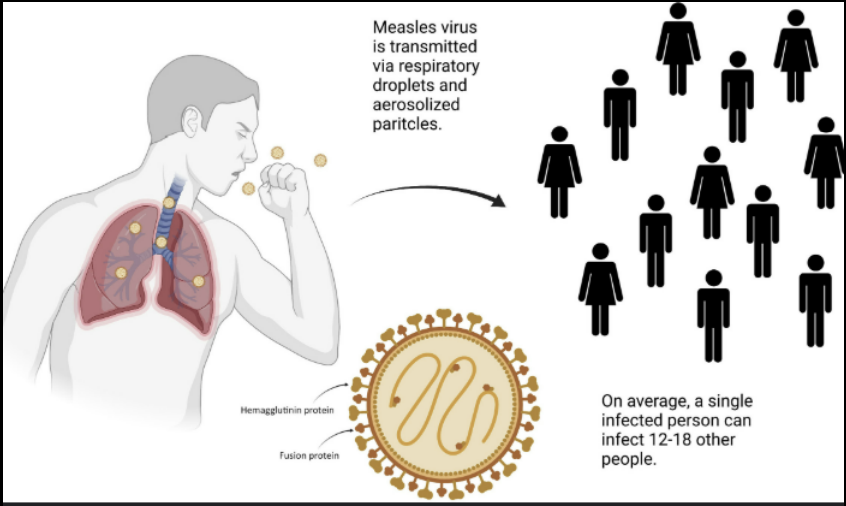
Diffusion at the individual level
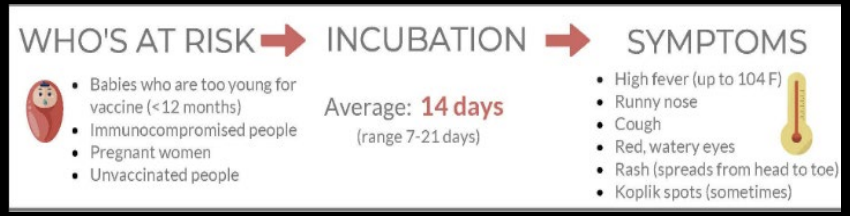
Measles virus is transmitted via respiratory droplets and aerosolized particles
On average, a single infected person can infect 12-18 other people.
(a) Typical time profile of the spread
Typical time profile of infection in a host individual.
The time breaks and different scales for time duration within each phase of the overall lifespan
what accounts for the difference in spread: Individual Immunity
(M, maternal protection; S, susceptible; L, latent; I, infectious; R, recovered).
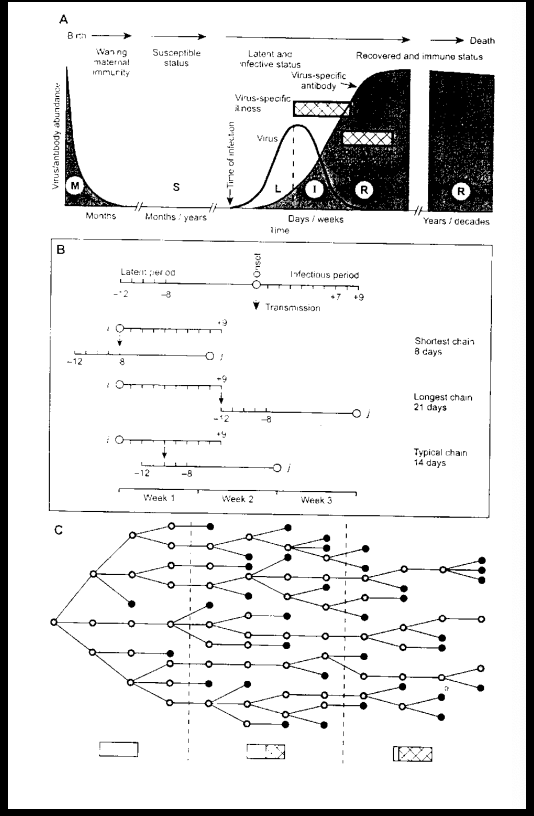
(b) The infection process as a chain structure
The average chain length of 14 days is shown
(C) Typical epidemic behaviour
Burnet's view of a typical epidemic where each circle represents an infection, and the connecting lines indicate transfer from one case to the next.
Black circles indicate individuals who fail to infect others
3 periods are shown
The proportion of susceptible (white) and immune (hatched) individuals are indicated in the rectangles beneath the main diagram.
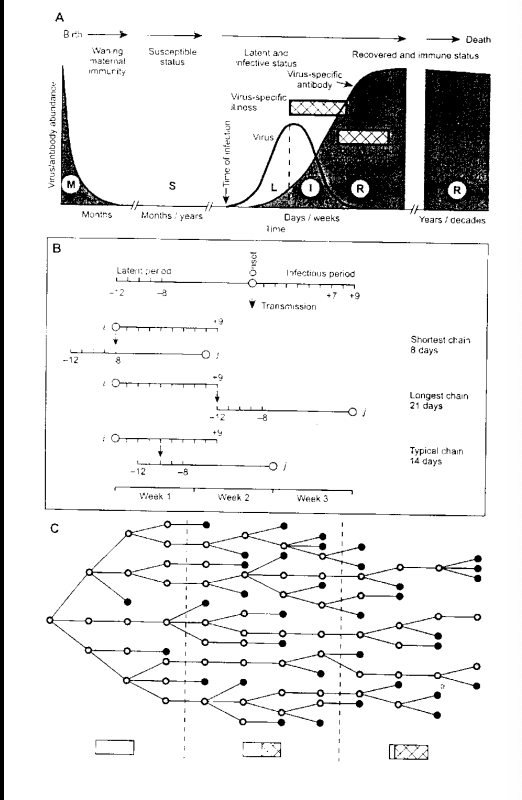
3 periods of a typical epidemic
The first when practically the whole population is susceptible;
The second at the height of the epidemic; (more awareness and preventative measures)
Third at the close, when most individuals are immune (herd immunity)
Virological reasons
The way in which measles epidemics occur and propagate in waves, as illustrated, shows that measles has a simple and regular transmission mechanism that allows the virus to be passed from person to person.
No intermediate host or vector is required.
The explosive growth in the number of cases that characterizes the upswing of a major epidemic implies that the virus is being passed from one host to many others.
Epidemiological (time series)
Measles exhibits very distinctive wavelike behaviour.
The figure here shows the time series of reported cases between 1945 and 1970 for four countries, arranged in decreasing order of population size.
In the US, with a population of 210 million in 1970, epidemic peaks arrive every year
Time series
In the UK (56 million) every two yrs.
Denmark (5 million) has a more complex pattern, with a tendency for a three-year cycle in the latter half of the period.
Iceland (0.2 million) stands in contrast to the other countries in that only eight waves occurred in the twenty-five-year period, and several years are without cases.
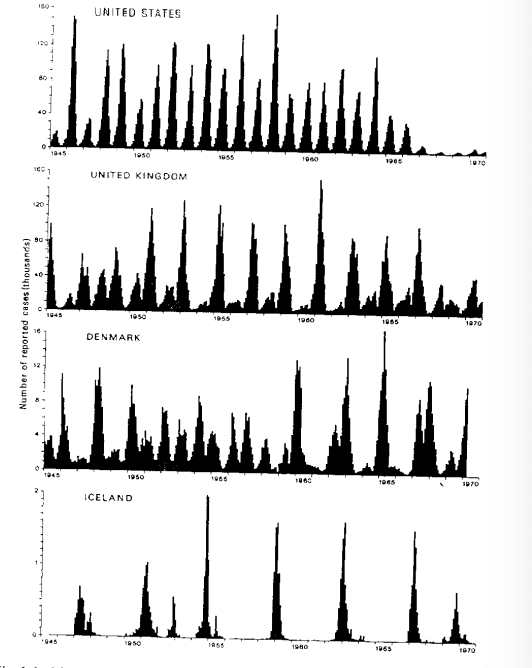
What can be deduced here?
measles has more spikes in infection in higher populations
more population = more measles
expansion
Clincial Reasons
The disease can be readily identified with its distinctive rash and the presence of Koplik spots within the mouth.
This means accurate diagnosis without the need for expensive laboratory confirmation.
Not only does measles display very high attack rates but, crucially, the relative probability of clinical recognition of measles is also high with over 99 per cent of those infected showing clinical features.
What other label can be placed here?
In clinical terms, measles is a readily recognizable disease with a low proportion of both misdiagnosed and subclinical cases.
identifiable symptoms
Statistical Reasons
The high rate of incidence leads to very large number of cases in relatively over a shorter duration to give a distinct epidemic event.
Even with under-reporting, major peaks are clearly identified.
Measles is highly contagious with very high attack rates in an unvaccinated population.
This high attack rate is supported by the many reliable estimates in the literature of the proportion of a population that has had measles.
Geographical Reasons
The disease is as widespread as the human population itself is in the early twenty-first century.
This global potential does not mean that there are not significant spatial variations.
Measles in isolated communities, which are rarely infected, has a very different temporal pattern from those in large metropolitan centres where the disease is regularly present.
Mathematical Reasons (eg. time series)
The regularity has attracted mathematical study since D'Enko (1888) carried out his studies of the daughters of the Russian nobility in a select St. Petersburg boarding school.
Hamer (1906) has played a major part in testing of mathematical models of disease distribution, most notably in chaos models.
broad way of representing disease with variables
Mathematical disease modelling
The first applications of mathematics to the study of infectious disease was that of Daniel Bernoulli (1760) when he used a mathematical method:
Evaluate the effectiveness of the techniques of variolation (process of inoculation) against smallpox.
Ever since different approaches, have been used to translate specific theories about the transmission of infectious disease into simple, but precise, mathematical statements and to investigate the properties of the resulting models.
Humanitarian Reasons
Despite major falls in mortality over this century, it still remains a major killer.
It accounts for nearly 2 million deaths worldwide, mainly of children in developing countries.
It is on the WHO list for eventual global elimination….Like smallpox, the measles virus is theoretically eradicable.
Study of the spatial structure of this particular disease is therefore of use in planning future eradication campaigns.
COVID-19 cases in Canada
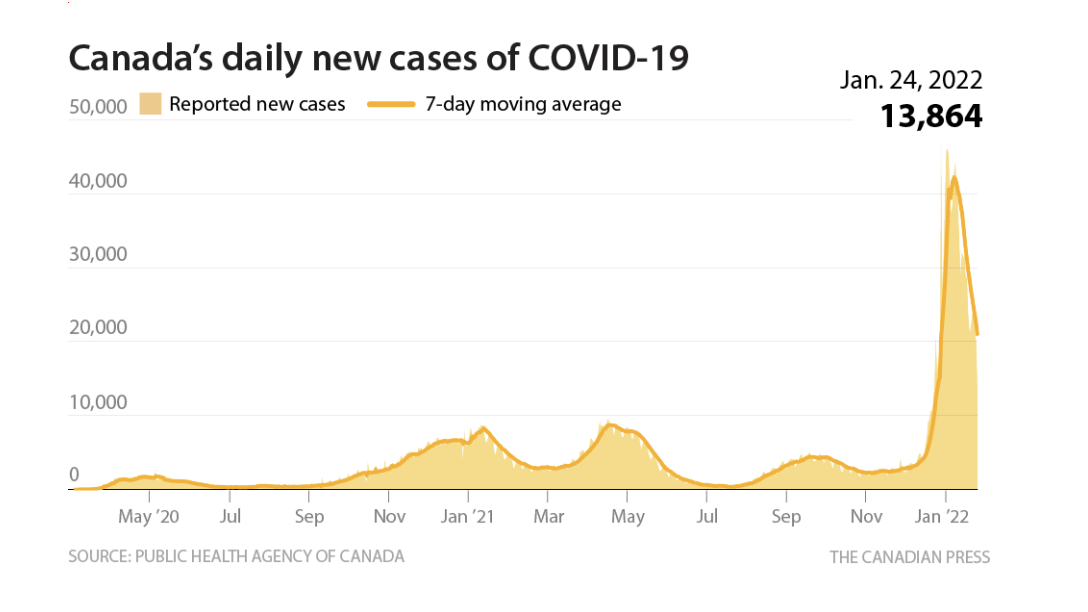
The COVID-19 Case Curve
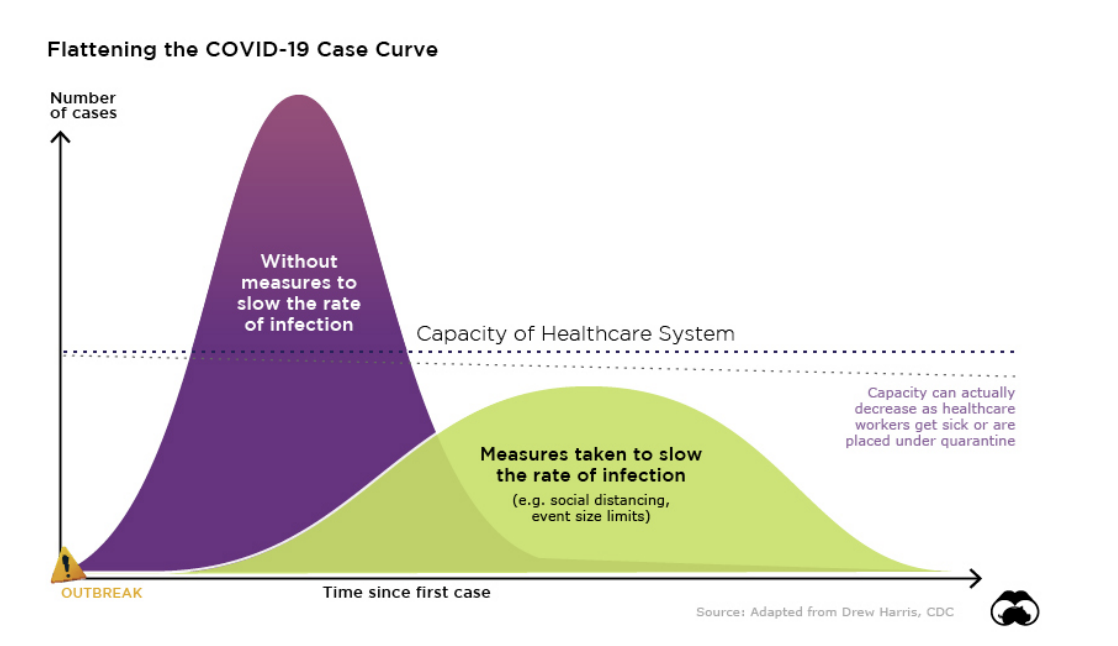
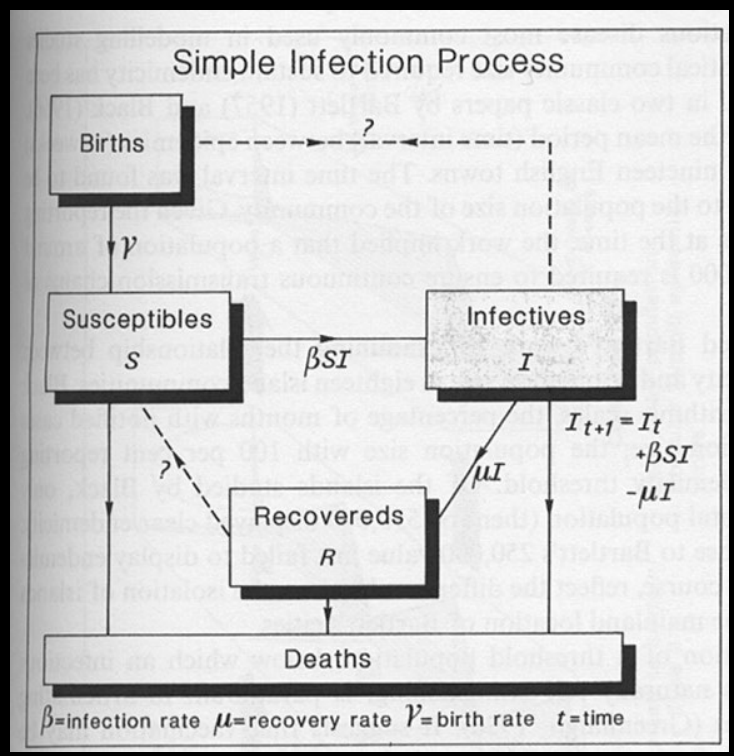
the Hamer-Soper model is shown below
The simplest form of an epidemic model
S: Susceptibles
I: Invectives
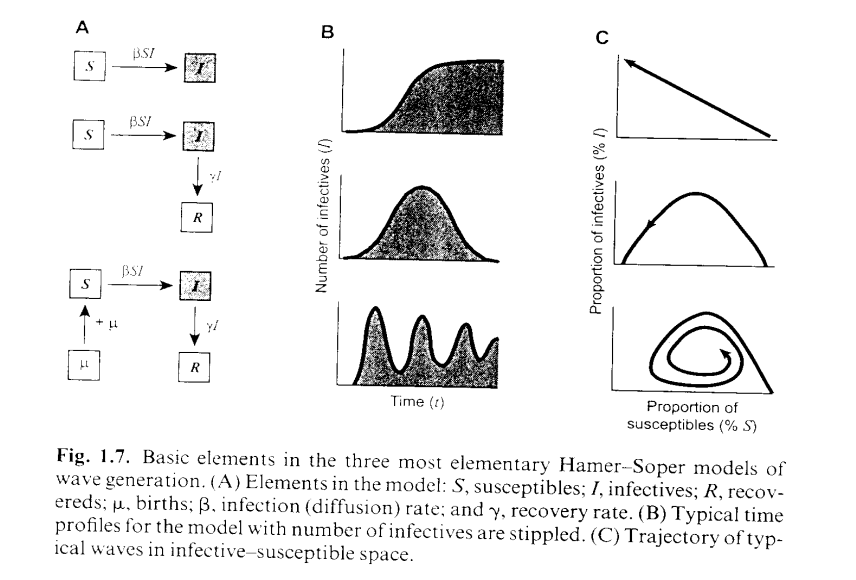
Simple Mass-action models
The basic wave-generating mechanism is simple.
The infected element in a population is augmented by the random mixing of susceptibles with invectives (S x I) at a rate determined by a diffusion coefficient (b) appropriate to the disease.
The infected element is depleted by recovery of individuals after a time period at a rate controlled by the recovery coefficient (c).
The addition of parameters to the model as in the figure allows successively more complex models to be generated.
A second set of epidemic models based on chain frequencies has been developed in parallel with the mass-action models.
Aim = create a time series
History of Mass-action models
The model was originally developed by Hamer in 1906
To describe the recurring sequences of measles waves affecting large English cities
In the late Victorian period and has been greatly modified over the last fifty years to incorporate probabilistic, spatial and public health features
Validation of Mass-Action models
Barlett (1957) investigated the relationship between the periodicity of measles epidemics and population size for a series of urban centres on both sides of the Atlantic.
His findings for British cities are summarized in the figure here.
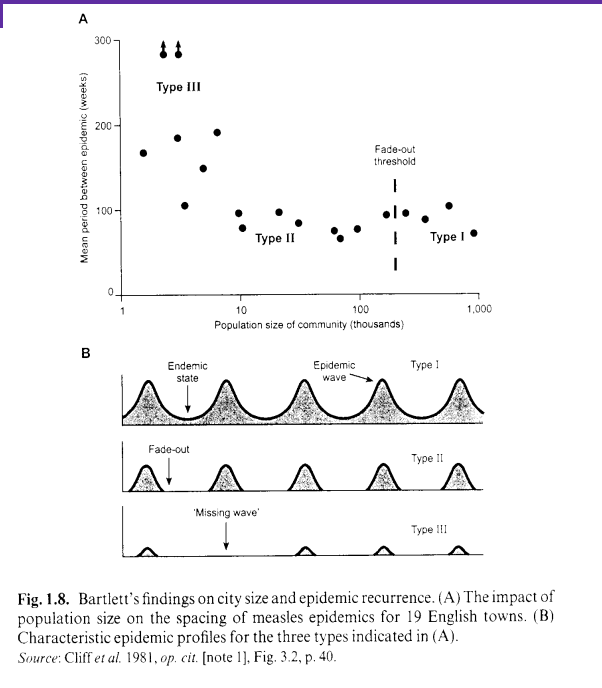
Validation of Mass-Action models
The largest cities have an endemic pattern with periodic eruptions (Type A), whereas cities below a certain size threshold have an epidemic pattern with fade-outs.
Bartlett found the size threshold to be around a quarter of a million
Subsequent research has shown that the threshold for measles, or indeed any other infectious disease, is likely to be somewhat variable with the level influenced by population densities and vaccination levels.
However, the threshold principle demonstrated by Bartlett remains intact. Once the population size of an area falls below the threshold, when the disease concerned is eventually extinguished, it can only recur by reintroduction from other reservoir areas
Kendall and spatial waves
The relationship between the input and output components in the wave- generating model has been shown to be critical (Kendall, 1957)
If we measure the magnitude of the input by the diffusion coefficient (b) and the output by the recovery coefficient (c) …….then the ratio of the two c/b defines the threshold….rho (ρ), in terms of population size.
For example, where c is 0.5 and b is 0.0001, then ρ would be estimated as 5,000.
remember… early detection, early response
Sequence of outbreaks in a community
Figure below shows a sequence of outbreaks in a community where the threshold has a constant value and is shown therefore as a horizontal line.
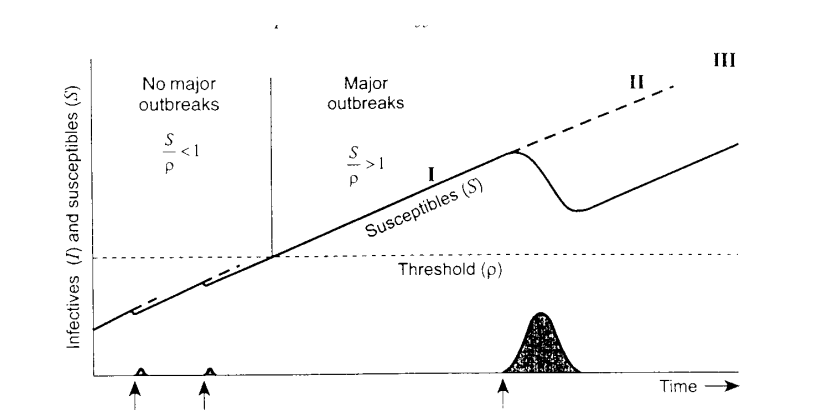
Spatial waves and virus introductions
Given a constant birth rate, the susceptible population increases and is shown as a diagonal line rising over time.
Three examples of virus introductions are shown.
In the first two, the susceptible population is smaller than the threshold (S <ρ) and there are a few secondary cases but no general epidemic.
Spatial waves cont
In the third example of virus introduction the susceptible population has grown well beyond the threshold (S > ρ)
The primary case is followed by many secondaries and a substantial outbreak follows.
The effect of the outbreak is to reduce the susceptible population as shown by the offset curve in the diagram.
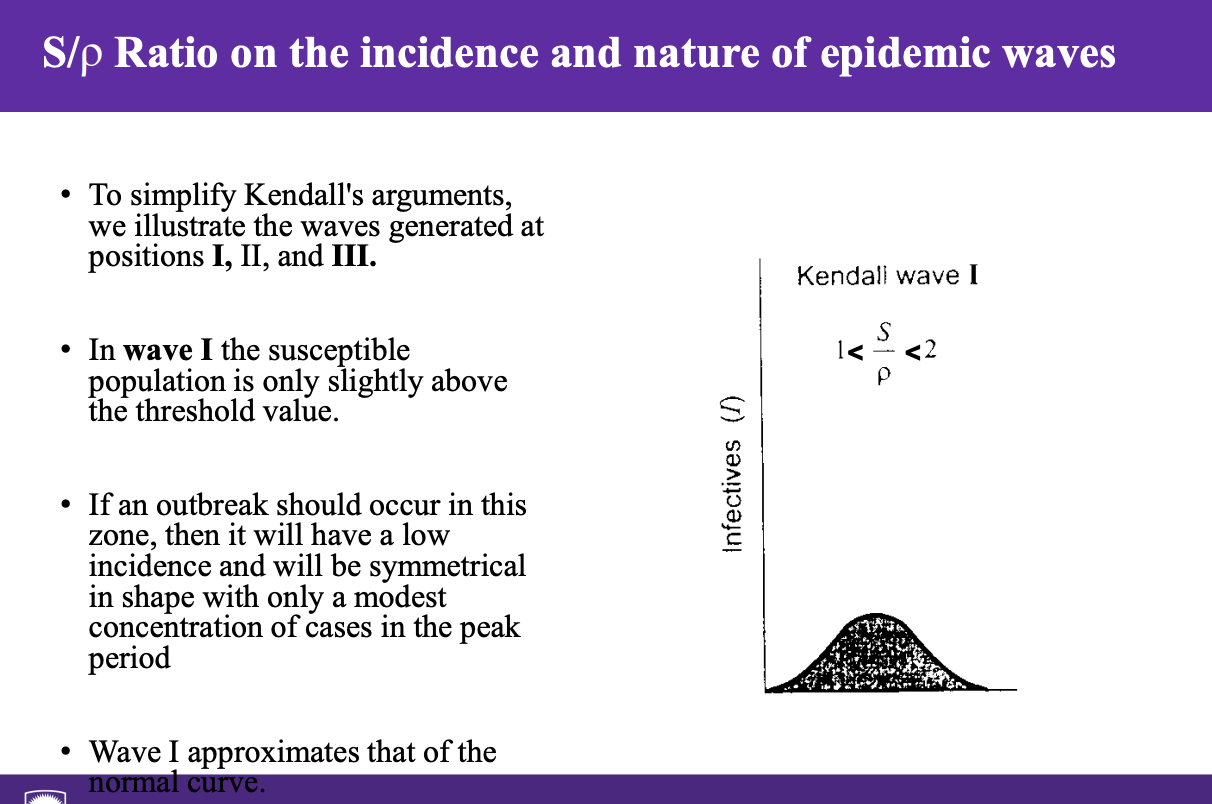
S/ρ Ratio on the incidence and nature of epidemic waves
Kendall investigated the effect of S/ρ ratio on the incidence and nature of epidemic waves.
With a ratio of less than one, a major outbreak cannot be generated
Above one, both the probability of an outbreak and its shape changes with increasing S/ρ ratio values.
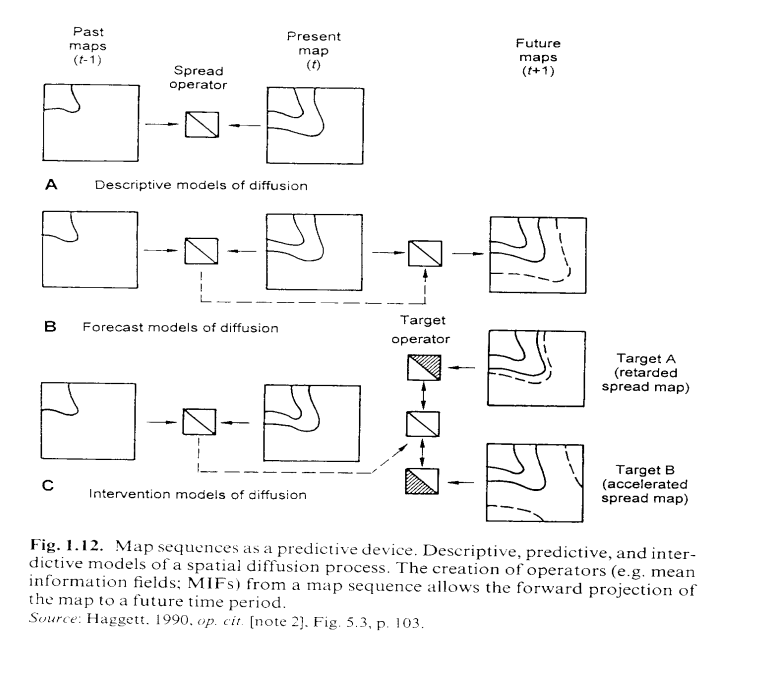
3 models of spatial diffusion
Can we identify what is happening and why?
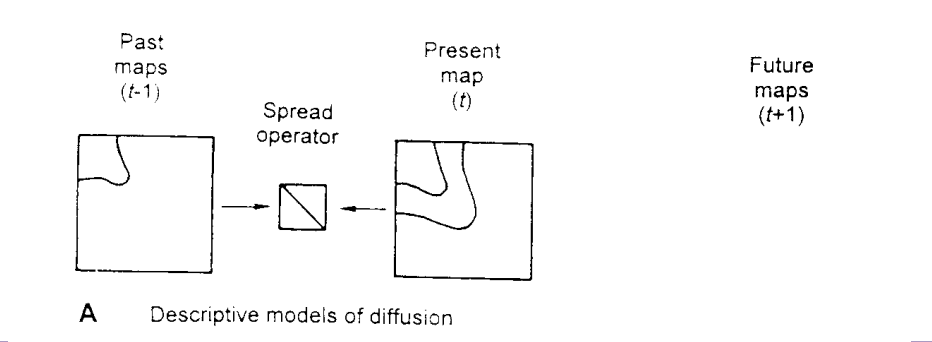
Descriptive models
What will happen in the future?
Predictive models
What will happen in the future if we intervene in some specified way?
Interdictive models.
Descriptive models
Can we identify what is happening and why?
From an accurate observation of a sequence of maps we may be able to identify the change mechanism and summarize our findings in terms of a descriptive model (see Figure below).
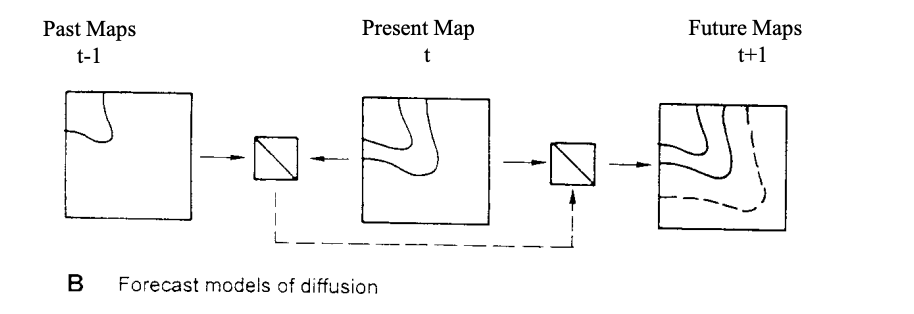
Predictive models
What will happen in the future?
If our model can simulate the sequence of past conditions reasonably accurately, then we may be able to go on to say something about future conditions.
This move from the known to the unknown is characteristic of a predictive model: the basic idea is summarized in the second part of the Figure below.
We are familiar with this process in daily meteorological forecast maps on television or daily newspapers.
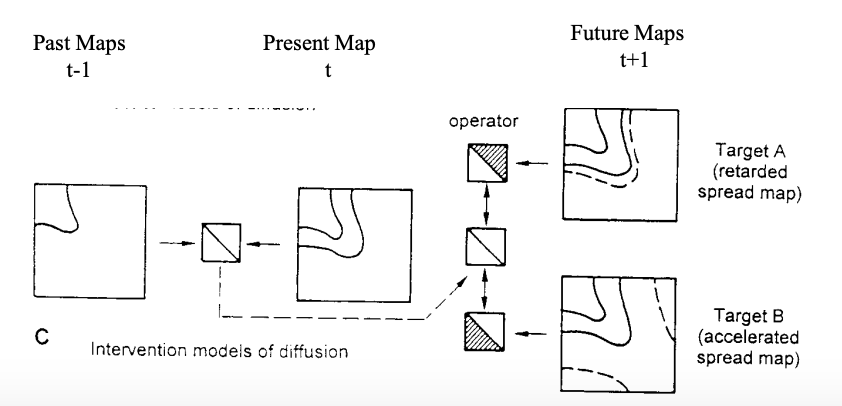
Interdictive Model
Planners and decision-makers may want to alter the future, say, to accelerate or stop a diffusion wave.
So our third question is: What will happen in the future if we intervene in some specified way? Models that try to accommodate this third order of complexity are termed interdictive models
Spatial Diffusion: Descriptive, Predictive and Interdictive Models