Chapter 3 MCQ Practice
1/23
Earn XP
Description and Tags
Name | Mastery | Learn | Test | Matching | Spaced | Call with Kai | Chat |
|---|
No analytics yet
Send a link to your students to track their progress
24 Terms
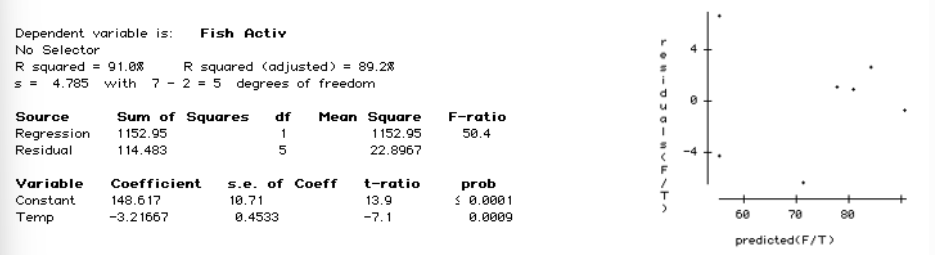
Scientists examined the activity level of a large number of fish at 7 different temperatures. Fish activity was rated on a scale of 0 (no activity) to 100 (maximal activity). The temperature was measured in degrees Celsius. A computer regression printout and a residual plot are given below.
What is the approximate actual activity level rating for the fish at a temperature of 20.4 ?
3
80
66
86
83
83
Given a set of ordered pairs (x,y) so that sx = 0.75, s = 1.6, r = 0.55
What is the slope of the least squares regression line?
0.78
1.82
1.17
2.18
0.26
1.17
Which of the following relationships is most likely to result in a strong negative correlation?
The number of people showering in a college dorm and the water pressure in each shower.
The price of a home and its square footage.
The outdoor temperature and the number of fans running in non-air-conditioned dorm rooms.
The comfort rating of a mattress and the number of hours of uninterrupted sleep obtained.
The weight of a puppy and the amount of food the puppy eats.
The number of people showering in a college dorm and the water pressure in each shower.
For children between the ages of 18 months and 29 months, there is approximately a linear relationship between height and age. The relationship can be represented by ŷ = 64.93 + 0.63x, where y represents height (in centimeters) and x represents age (in months). Joseph is 22.5 months old and is 80 centimeters tall. What is Joseph's residual?
79.1
-0.9
0.9
56.6
64.93
0.9
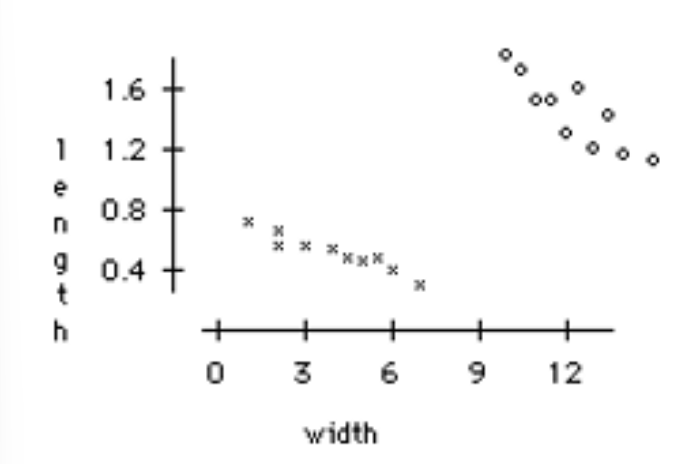
A study examined the relationship between the sepal length and sepal width for two varieties of an exotic tropical plant. Varieties A and B are represented by x’s and o’s, respectively, in the following scatterplot. Which of the following statements is FALSE?
Considering Variety A only, there is a negative correlation between sepal length and width.
Considering each variety separately, there is a positive correlation between sepal length and width.
Considering Variety B only, the least-squares regression line for predicting sepal length from sepal width has a negative slope.
Considering both varieties, there is a positive correlation between sepal length and width.
Considering each variety separately, there is a positive correlation between sepal length and width.
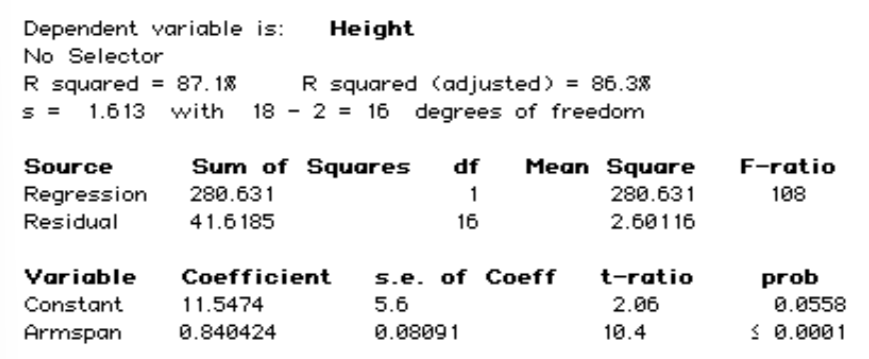
Leonardo da Vinci, the renowned painter, speculated that an ideal human would have an armspan (distance from outstretched fingertip of left hand to outstretched fingertip of right hand) that was equal to his height. The following computer regression printout shows the results of a least-squares regression on height and armspan, in inches, for a sample of 18 high school students.
Which of the following is false ?
One of the students in the sample had a height of 70.5 inches and an armspan of 68 inches. The residual for this student is 1.8 inches.
This least-squares regression model would make a prediction that is 2.36 inches higher than da Vinci projected for a 62-inch tall student.
For a student with an armspan of 67 inches, the LSRL would predict a height of 67.9 inches.
For every one-inch increase in armspan, the regression model predicts an average increase of 0.84-inch in height.
This least-squares regression model would make a prediction that is 2.36 inches higher than da Vinci projected for a 62-inch tall student.
Suppose we fit a least-squares regression line to a set of data. What is true if a plot of the residuals shows a curved pattern?
The correlation must be 0.
Outliers must be present.
A straight line is not a good model for the data.
The correlation must be positive.
A straight line is not a good model for the data.
The scatterplot which describes the relationship between stopping distance (ft) and air temperature (°C) appears linear. If stopping distance was expressed in yards instead of feet, how would the correlation r between temperatures and stopping distance change?
r would be divided by 3.
r would be multiplied by 3.
r would not change.
r would be divided by 12.
r would be multiplied by 12.
r would not change
A variable grows exponentially over time if
it increases by the logarithm of its value whenever time is increased by a certain fixed amount.
none of these.
it increases by the addition of a fixed amount to the variable as time increases by a fixed amount.
it increases by squaring its value whenever time is increased by a certain fixed amount.
it increases by multiplication by a fixed amount as time increases by a fixed amount.
it increases by multiplication by a fixed amount as time increases by a fixed amount.
If dataset A of (x, y) data has correlation coefficient r = 0.65, and a second dataset B has correlation r = – 0.65, then
Neither A nor B has a stronger linear association.
The points in A exhibit a stronger linear association than B.
None of the statements above are correct.
You can’t tell which dataset has a stronger linear association without seeing the data or seeing the scatterplots.
The points in B exhibit a stronger linear association than A.
Neither A nor B has a stronger linear association.
If removing an observation from a data set would have a marked change on the position of the LSRL fit to the data, that point is called:
None of the above
Response
Robust
Influential
Residual
Influential
What does the coefficient of determination, R2, measure?
the proportion of actual points that line on the least squares regression line.
the extent to which cause and effect is present in the data.
the intercept of the least squares regression line.
the slope of the least squares regression line.
the fraction of variation in the values of y that is explained by the least squares regression on the other variable.
the fraction of variation in the values of y that is explained by the least squares regression on the other variable.
A researcher finds that the correlation between the personality traits “greed” and “superciliousness” is – 0.40. What percentage of the variation in greed can be explained by the linear relationship with superciliousness?
40%
16%
60%
20%
0%
16%
Linear regression usually employs the method of least squares. Which of the following is the quantity that is minimized by the least squares process?
Σ( y - ȳ)2
Σ( x - x̄)2
(x̄, ȳ)
ŷ
Σ( y - ŷ)2
Σ( y - ŷ)2
If two variables are highly correlated, then
high values in one variable lead to high values in the other variable.
there are no other variables responsible for the relationship.
changes in one variable are accompanied by predictable changes in the other variable.
they always go together.
changes in one variable are accompanied by predictable changes in the other variable.
A researcher finds a correlation of 0.40 between personal income and the number of years of college completed. Based upon this finding you can conclude that
More years of education are associated with higher income.
More years of education causes higher income.
A person who attended four years of college will have an annual income of $40,000.
Personal income is a positively skewed variable.
More years of education are associated with higher income.
Which of the following is true of the correlation r?
Whenever all the data lie on a perfectly straight line, the correlation r will always be equal to +1.0.
2. -1 ≤ r ≤ 1
If r is the correlation between X and Y, then –r is the correlation between Y and X.
It is a resistant measure of association.
2. -1 ≤ r ≤ 1
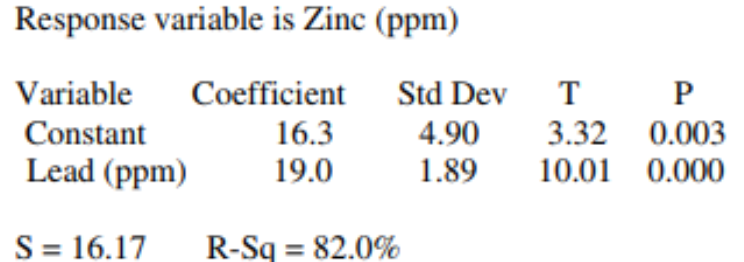
The computer output below shows the result of a linear regression analysis for predicting the concentration of zinc, in parts per million (ppm), from the concentration of lead, in ppm, found in fish from a certain river.
Which of the following statements is a correct interpretation of the value 19.0 in the output?
The predicted concentration of zinc is 19.0 ppm in fish with no concentration of lead.
On average there is a predicted increase of 19.0 ppm in concentration of lead for every increase of 1 ppm in concentrations of zinc found in the fish.
Approximately 19% of the variability in zinc concentration is predicted by is linear relationship with lead concentration.
The predicted concentration of lead is 19.0 ppm in fish with no concentration of zinc.
On average there is a predicted increase of 19.0 ppm in concentration of zinc for every increase of 1 ppm in concentration of lead found in the fish.
On average there is a predicted increase of 19.0 ppm in concentration of zinc for every increase of 1 ppm in concentration of lead found in the fish.
The correlation between two variables is given by r = 0. What does this mean?
You can not use the explanatory variable to predict the response variable.
There is a perfect positive relationship between the two variables.
There is a perfect negative relationship between the two variables.
All of the points must fall exactly on a horizontal line.
You can not use the explanatory variable to predict the response variable.
What is the effect of an outlier on the value of a correlation coefficient?
An outlier will have no effect on a correlation coefficient.
An outlier may decrease or increase a correlation coefficient.
An outlier will always increase a correlation coefficient.
An outlier will always decrease a correlation coefficient
An outlier may decrease or increase a correlation coefficient.
Which of the following statements is false?
The correlation coefficient can have values from -1 to 1.
The sign of the correlation coefficient determines whether the relationship is positive or negative.
The coefficient of determination can be applied to any line.
The coefficient of determination is the variation in y explained by linear relationship between the explanatory and response variables.
The coefficient of determination can be applied to any curve.
The magnitude of the correlation coefficient determines the strength of the linear relationship.
The coefficient of determination can be applied to any curve.
Which of the following statements is/are true?
I. Correlation and regression require explanatory and response variables.
II. Scatterplots require that both variables be quantitative.
III. Every least-squares regression line passes through 24-1.PNG
I and II only
None of these
II and III only
I, II, and III
I and III only
I, II, and III
According to the 1990 census, those states with an above-average number X of people who fail to complete high school tend to have an above average number Y of infant deaths. In other words, there is a positive association between X and Y. The most plausible explanation for this is
Lurking variables are probably present. For example, states with large populations will have both larger numbers of people who don’t complete high school and more infant deaths.
Y causes X. Programs that reduce infant deaths will ultimately reduce high school dropouts.
X causes Y. Programs to keep teens in school will help reduce the number of infant deaths.
The association between X and Y is purely coincidental.
Both of these variables are directly affected by the higher incidence of cancer in certain states.
Lurking variables are probably present. For example, states with large populations will have both larger numbers of people who don’t complete high school and more infant deaths.
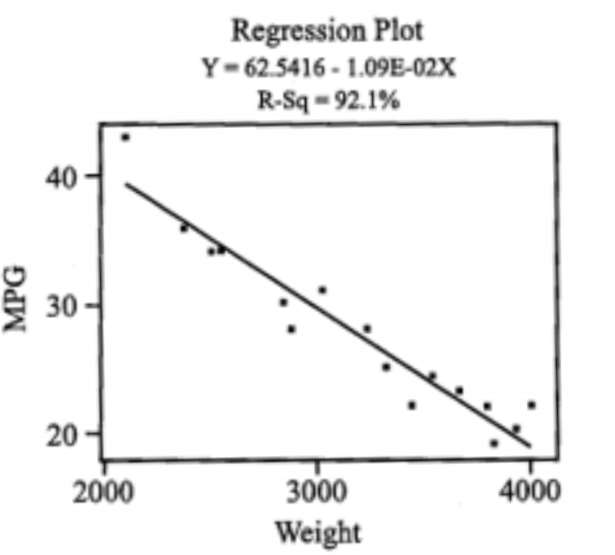
A student was interested in the relationship between weight of a car and gas consumption measured in mpg. He selected sixteen different automobiles and recorded their weights along with their advertised mpg. The regression equation and scatterplot are shown. What affect would the addition of the point (4,300 lbs., 15.63 mpg) have on the value of R 2?
It will increase R2 because it is an influential point which lies near the least squares regression line.
It will have no effect on R2 because it lies on the line.
It will increase R2 because every additional point will increase the percent variation in y due to the relationship with the least squares line.
It will decrease R2 because it is an outlier.
It will increase R2 because it is an influential point which lies near the least squares regression line.