1.2 Basics of Experiments
 Call Kai
 Learn
Learn Practice Test
 Spaced Repetition
 Match
Match Flashcards
 Knowt Play
1/19

Earn XP
Description and Tags
GOVT 300 Geroge Mason University
Name | Mastery | Learn | Test | Matching | Spaced | Call with Kai | Chat |
|---|
No analytics yet
Send a link to your students to track their progress
20 Terms
Randomization of the treatment assignment (Randomly decide who gets the treatment and who does not)
helps ensure the groups are similar
there’s no preference for any type of unit to receive the treatment (or to not receive it)
As long as the sample is not too small, randomization of the
Treatment and control groups will be similar, on average
Treatment variable
Xi ∈ {0, 1} [1 if treated, 0 if not]
where X belongs to 0 or 1
Treatment group
Those units for which Xi = 1
Control group
Those units for which Xi = 0
nT
number of units in the treatment group
nC
number of units in the control group
Observed Outcome (Yi)
the potiental outcome that is realized (depending on treatment status)
If a unit gets the treatment, then we observe their Potential Outcome Under Treatment
Yi = Yi(1) if Xi = 1
If a unit does not get the treatment, then we observe their Potential Outcome under control:
Yi = Yi(0) if Xi = 0
Average Outcome for the Treatment Group
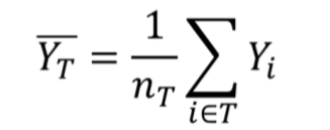
Average Outcome for the Control Group

We use the average of YT to infer
the average of Y(1)
We use the average of YC to infer
the averge of Y(0)
(if groups are similar) the average of YC
is a good inferred counterfactual for the average of YT
Difference-in-Means estimator
(Average of YT) - (Average of YC)
When both groups are similar (when we randomize the treatment)
the only systematic difference is the treatment
thus, treatment and control groups serve as counterfactuals for each other
thus, DiM allows us to infer SATE
Use DiM = the average of YT - the average of YC to infer
SATE = the average of Y(1) - the average of Y(0)
Use DiM = the average of YT - the average of YC to infer SATE = the average of Y(1) - the average of Y(0)
this inference is good as long as the groups are similar