Chapter 14 - Further Networks and Decision Mathematics
1/28
Earn XP
Description and Tags
Further Networks and Decision Mathematics explained in a NUTSHELL BABY!
Name | Mastery | Learn | Test | Matching | Spaced |
|---|
No study sessions yet.
29 Terms
Flow Networks Key Terms
Source (S): Where flow starts.
Sink (T): Where flow ends.
Edge capacity: Max quantity that can flow along edges.
Vertex inflow: Sum of incoming edge capacities.
Vertex outflow: Sum of outgoing edge capacities.
Real-world flows: liquids, traffic, electricity, data through pipes, roads, cables.
Principle of flow networks: Maximum flow
Maximum flow = capacity of the smallest bottleneck (minimum cut).
Principle 1: Outflow from a vertex ≤ inflow capacity.
Principle 2: Outflow from a vertex ≤ outflow capacity.
Example: Big pipe can push 58 L/min, but small pipe limits flow to 25 L/min — system max flow = 25 L/min.
Other Key Terms for Flow Network
Keyword | Details | Example |
|---|---|---|
Cut | A dotted line separating the source and sink in a network. Not always straight; can be curved. Like a barrier - as long as it cuts the connection from source to sink! Passenger = Valid (→) Driver = Invalid (from right ← ) | 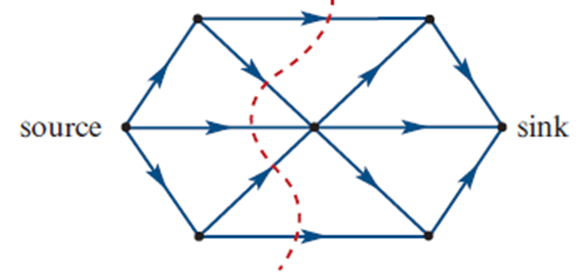 |
Capacity of a cut | Sum of capacities of edges the cut passes through, only counting edges flowing from source to sink side. | 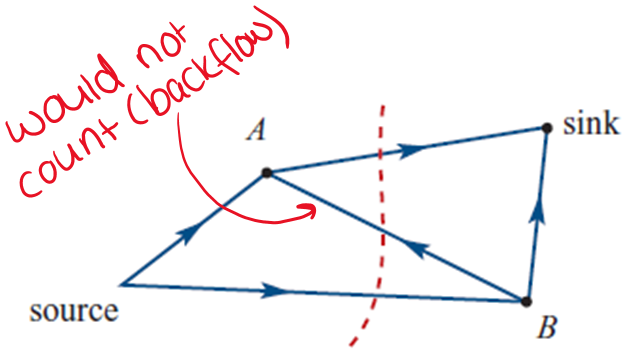 |
Minimum cut capacity | The cut with the smallest total capacity. Equal to the maximum flow of the network. | 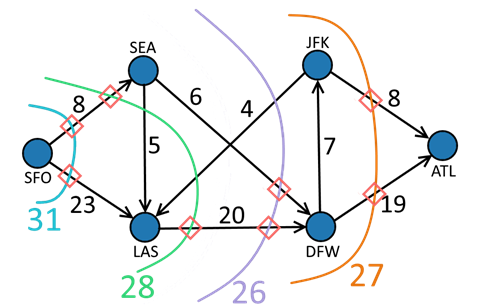 |
Max-Flow/Min-Cut Theorem
Max flow = total capacity of the smallest cut separating source and sink.
A cut goes bottom to top, splitting graph so S and T are opposite sides.
Only count arrows crossing the cut in the correct direction (source to sink).
If the edge hits the driver’s side (reverse direction), don’t count it!
Maximum Flow / Minimum Cut Scenario 2
When START or END moves, redraw top and bottom accordingly.
Reassess which lines form a valid cut separating source and sink.
Ensure cuts reflect the new network layout after shift.
Increasing Flow Tip
To increase flow, find a new cut avoiding edges from the current minimum cut.
Look for unused capacity elsewhere in the network.
For multiple sources, split into separate outlets.
Calculate flows individually, then add for total max flow.
When more than one source inflow, a single suepr source can be made.
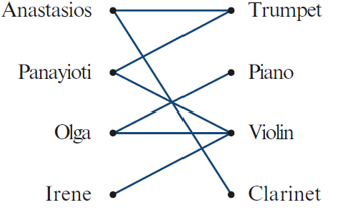
Bipartite Graphs (Bigraphs)
Vertices split into two groups: X (Positions) and Y (Applications).
Edges only connect vertices between groups, not within.
Commonly used for allocation problems (e.g. jobs to people).
Allocations with Costs/Scores (Hungarian Algorithm)
Use a cost/score matrix to represent a weighted bipartite graph.
Goal: minimise cost or maximise score in allocations.
Very high cost or zero score used to block invalid allocations.
Solved using the Hungarian Algorithm for optimal matching.
The Hungarian Algorithm – Cost Matrix
A table showing costs, times, or scores for assigning items from one group (e.g. people) to another (e.g. tasks).
Represents a weighted bipartite graph.

Hungarian Algorithm – Minimum Cost Steps
Step 1: Subtract the smallest value in each row from every row.
Step 2: Subtract the smallest value in each column from every column.
Step 3a: Cover all zeroes with the minimum number of lines.
– If lines = number of rows → proceed to matching.Step 3b: If not, find the smallest uncovered value:
– Add to intersections, subtract from uncovered.Step 4: Repeat Step 3a until matching is possible.
Step 5a: Create a bipartite graph from zeros.
Step 5b: Make allocations (multiple options may exist).
Step 5c: Use the original cost matrix to calculate total cost/time.
→ Include units!
Hungarian Algorithm – Maximum Score Allocation
Step 1: Negate all values in the matrix (to flip max to min).
Step 2: Add the highest negated value to all elements (make matrix non-negative).
Step 3: Subtract the minimum in each row.
Step 4: Subtract the minimum in each column.
Step 5: Cover all zeros with the minimum number of lines.
– If lines = number of allocations → proceed.
Final: Build the bipartite graph, allocate, etc. to finish.
Context – Precedence Tables & Activity Networks
Large projects need tasks done in a specific order.
Precedence tables help map which tasks depend on others.
Activity networks then visualise the sequence to plan and schedule efficiently.
Key Terms for Precedence tables and activity networks
Key word | Definition | Example |
|---|---|---|
Activity | Task to complete in a project; shown as edges in project diagrams. | Building a wall |
Immediate Predecessor | Activity that must finish before another can start (e.g., A is predecessor of C). | Pouring foundation before framing |
Precedence Table | Records activities, their immediate predecessors, and durations. | Table listing tasks & dependencies |
Activity Network | Weighted directed graph showing activity order; weights = durations; only start/end vertices labeled. | Project flowchart with durations |
Constructing Activity Networks
Activity = directed edge
Vertices unlabelled, except start and finish
Activities with no immediate predecessors → edges from start vertex
Activities with no successors → edges to finish vertex
For each activity, identify:
Its immediate predecessors
Activities it is an immediate predecessor for
Use a precedence table to build the activity network
Constructing an activity network from precedence table
Identify activities with no predecessors; connect from start vertex
Draw activities following each predecessor (e.g., C, D after A; E, F after B)
Repeat step 2 for all successors
Connect activities with no successors (e.g., I) to finish vertex
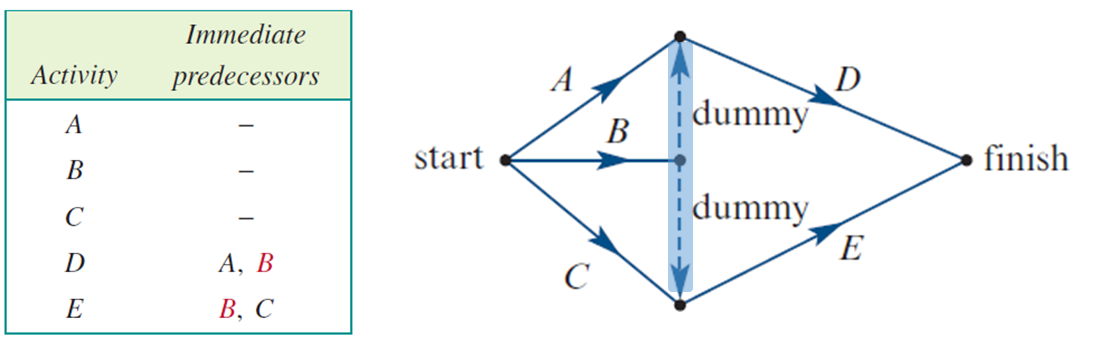
Dummy Activities
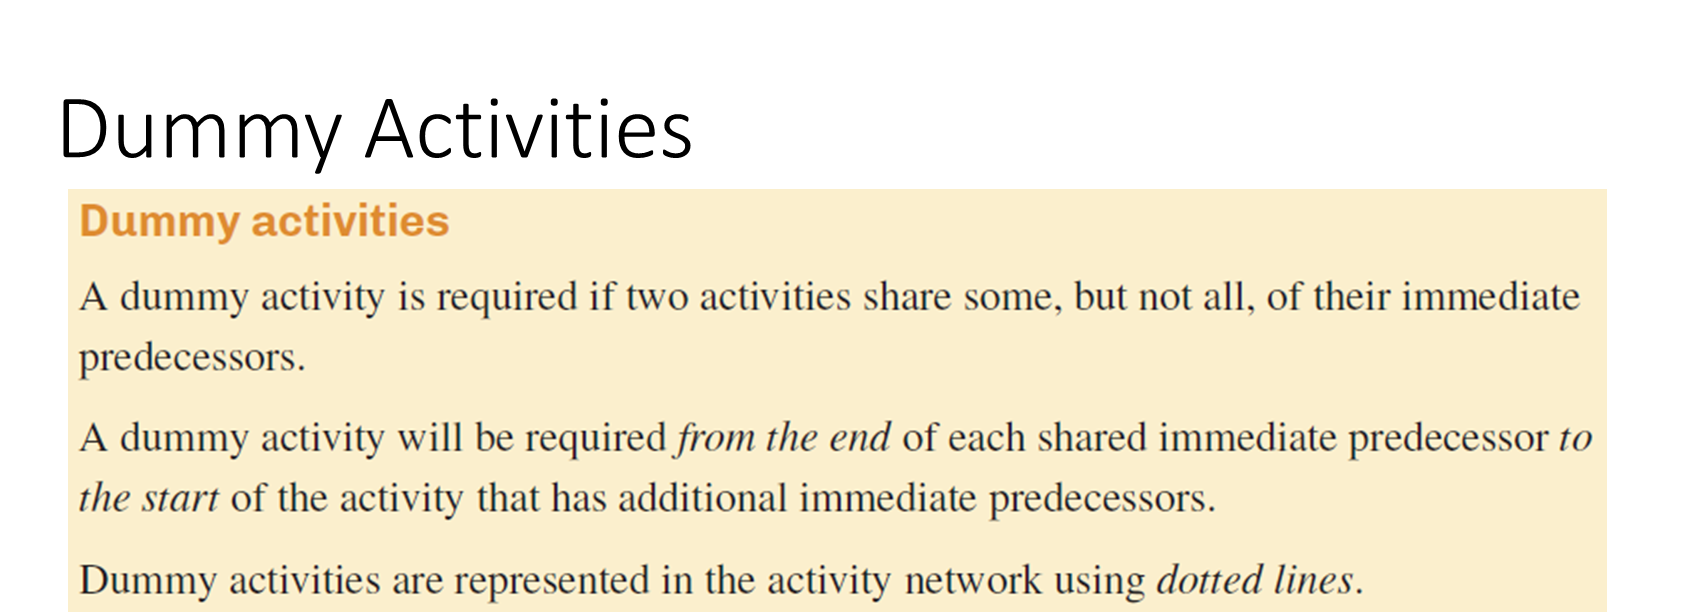
Further Dummy Activities
Artificial activity with zero duration added to a project diagram
Ensures correct accounting of shared immediate predecessors
Occurs when two activities share the same immediate predecessor
Represented by a dotted line with an arrow, labelled “dummy” or “d”
Not a real task; only shows dependencies clearly
Scheduling
Allocating time to complete each activity in a project
Goal: Find the shortest total time to finish the entire project
Key Terms for Scheduling
Key word | Definition | Example |
|---|---|---|
Weighted Precedence Table | Precedence table showing immediate predecessors and task durations (weights). | 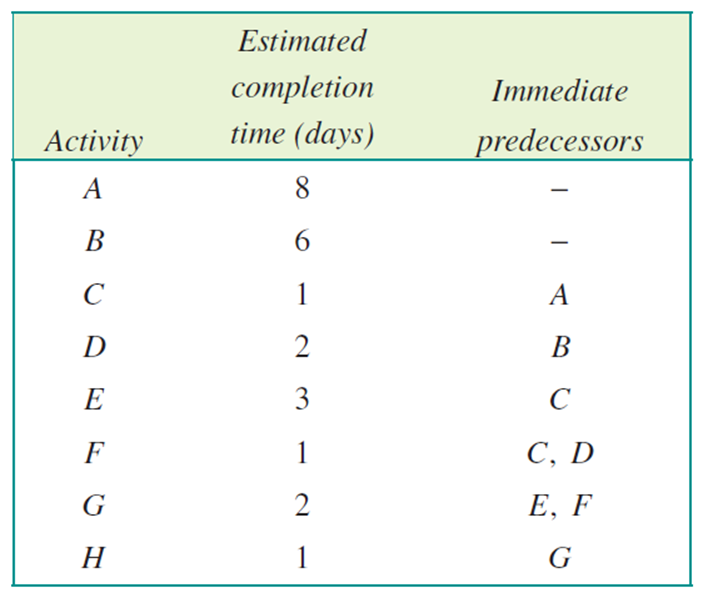 |
Weighted Activity Network | Activity network including weights (durations) on each task. | 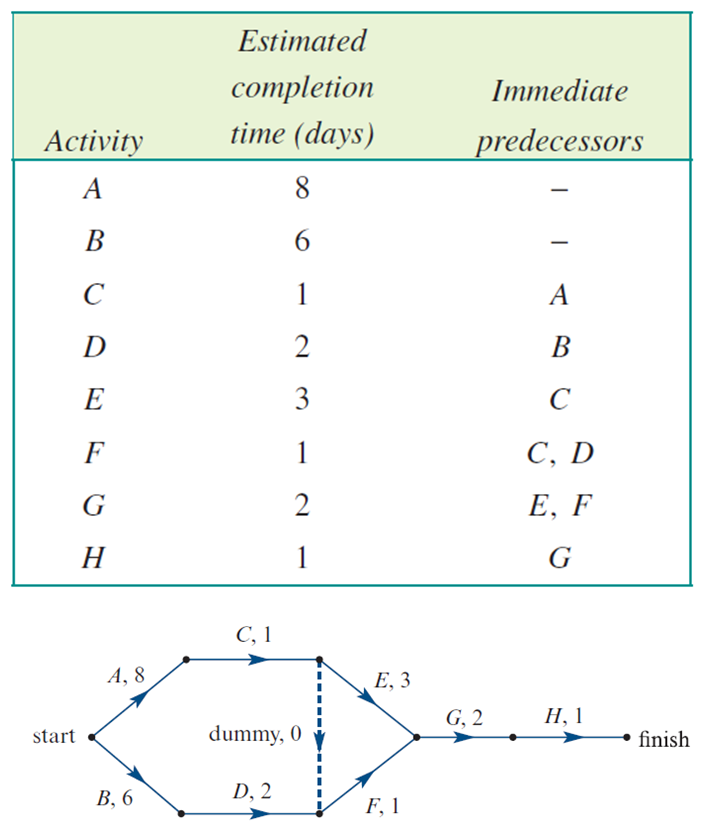 |
Dummy Weight | Duration of a dummy activity is always zero. | 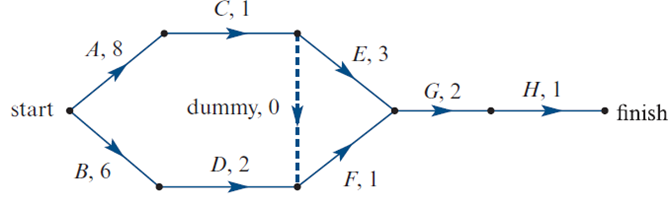 |
Float Time (Slack) | Time an activity can be delayed without affecting total project time. | Non-critical task with spare time |
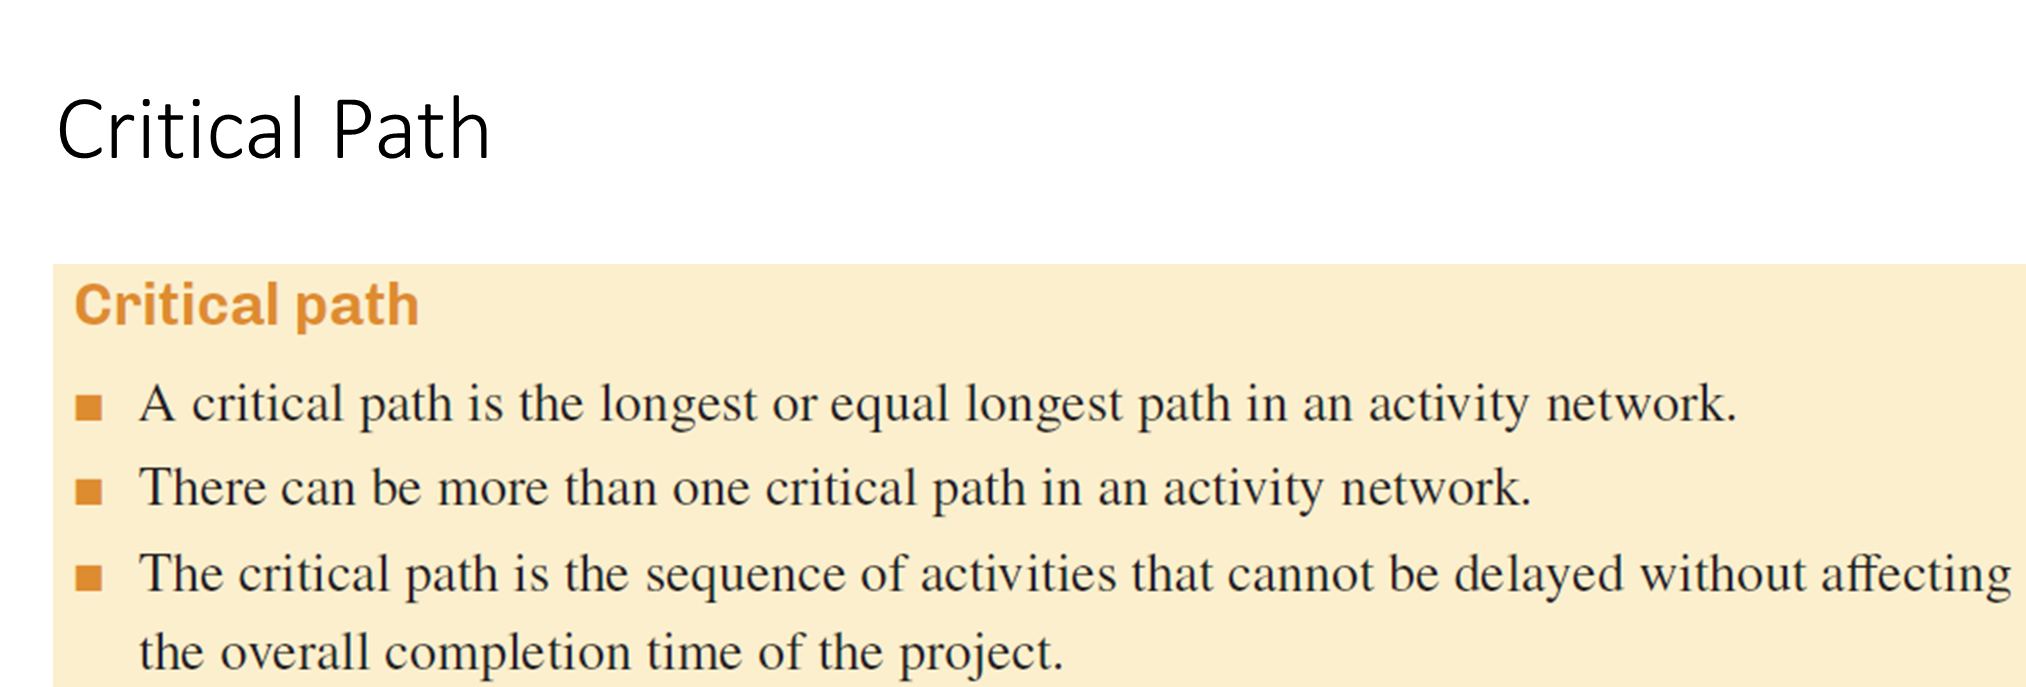
Critical Path | Path where float time = 0; no delays allowed without impacting the project completion. | Chain of essential tasks with zero slack |
Scheduling Earliest Starting Time and Latest Starting Time
Keyword | Definition | Formula / Notes |
|---|---|---|
Earliest Starting Time (EST) | Earliest time an activity can start without delaying the project. | - One predecessor: EST = EST of predecessor + duration- Multiple predecessors: take the largest value |
Latest Starting Time (LST) | Latest time an activity can start without increasing project completion time. | - One following activity: LST = LST of following activity − duration- Multiple followers: take the smallest value |
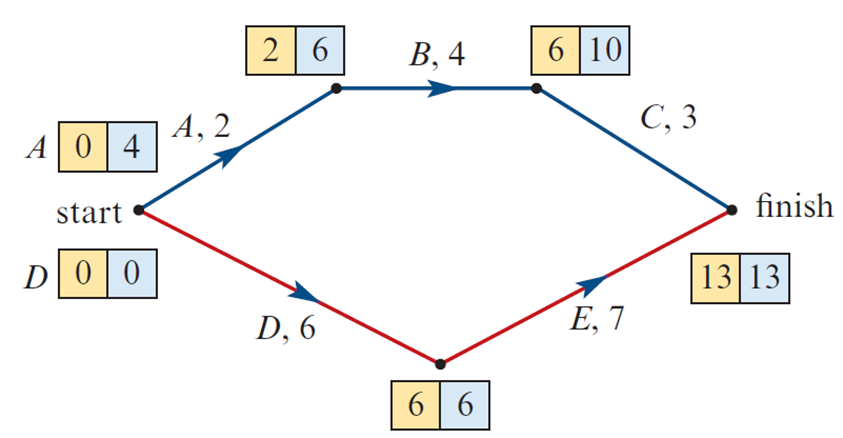
Critical Path Method (CPM) Steps
Determine EST: Move forward through the network, at each step select the largest value.
Determine LST: Move backward through the network, at each step select the smallest value.
- When deciding, check the vertices that follow the current vertex.Calculate Float Time: Float = LST − EST for each activity.
Identify Critical Path: Activities with zero float form the critical path—no delays allowed.
Interpreting Float Times
Float time = LST − EST
Float ≠ 0: Activity can be delayed by that amount without affecting project completion.
Float = 0: Activity is critical—no delays allowed, or the whole project timeline shifts.
Critical path = chain of activities with zero float, must be done on time.
Critical Path
Create an activity network based on the following weighted precedence table
Construct activity network
Determine Earliest Starting Time (EST)
Determine Latest Starting Time (LST)
Calculate Float Times (LST − EST)
Identify Critical Path(s) — if multiple, state all critical paths
Crashing Context
Crashing = speeding up critical activities to finish the project sooner.
Focus only on tasks on the critical path.
May incur extra costs for time saved (e.g., more workers, better materials).
Goal: reduce project time at minimal extra cost.
Btw this is the weirdest name in maths I have ever seen
Key Terms for Crashing
Keyword | Definition | Example |
|---|---|---|
Crashing | Shortening project duration by reducing time of individual activities, mainly on the critical path. | |
 Crashing with Cost | Balancing time reduction and extra costs when shortening activities. | Choose to crash activity with lower cost per time saved (e.g., $10 vs $200 to reduce by 1 unit). |
Crashing Steps
Determine the critical path
Identify non-critical activities
Crash only activities on the critical path
- Avoid changing the critical path, but if it shifts, watch closelyCalculate new total time and cost
If a new critical path appears:
Crash activities on the new critical path next
Repeat until you reach desired project time or costs limit
Crashing Detailed Steps
List all paths; find the critical path.
Crash activities on the critical path without creating a shorter path elsewhere.
If two critical paths share an activity, crash it to save costs.
Watch out: crashing too much costs more and may create a new critical path.
Pushing Flow (Opt, but Suggested)
Check every path from source to sink.
Subtract max flow along each path until most paths have zero capacity left.
Sum of all subtracted flows = maximum flow.
To increase flow, add the smallest leftover capacity to the chosen edge.
After finishing, try to make a cut covering if not all, most of the subtracted elements. That is, the maximum cut.