PHY101 - Definitions and Concepts
1/25
Earn XP
Name | Mastery | Learn | Test | Matching | Spaced |
|---|
No study sessions yet.
26 Terms
Use of statistics
Design of experiment / sampling methods
Data collection
Organization of data (and graphing)
Analysis
Estimation of uncertainties
Interpretation
Incorrect data causes
Sampling bias
Sample too small
Sample not representative
Leading question (also, people lie)
Data is correct, but presentation is misleading
Cherry picking data
Misleading graphs
Presentation of data
Percentages can be misleading with small numbers
Changes in absolute numbers can be misleading with large numbers
Leading question affects the data
Asking what makes a situation worse first is more likely to be voted first
Population
Collection of the entire set of all measurements of interest in a study
Ex. StatsCanada census where all Canadian households must respond to a survey
Parameter (relating to a population)
A numerical measurement that describes a population
Ex. Class average if you consider a class as an entire population
Sample
A smaller set of measurements taken from a population
Statistic (hint: relation to sample)
A numerical measurement describing a sample
Two types of stats
Descriptive statistics:
A description of the data (sample or population)
Find averages and dispersion
Graph the data
Inferential statistics:
An interpretation of sample data
Given a sample, what are the properties of a population?
Inference
Inferring data when a population is inaccessible and the parameters are unknown. (guessing/determining results)
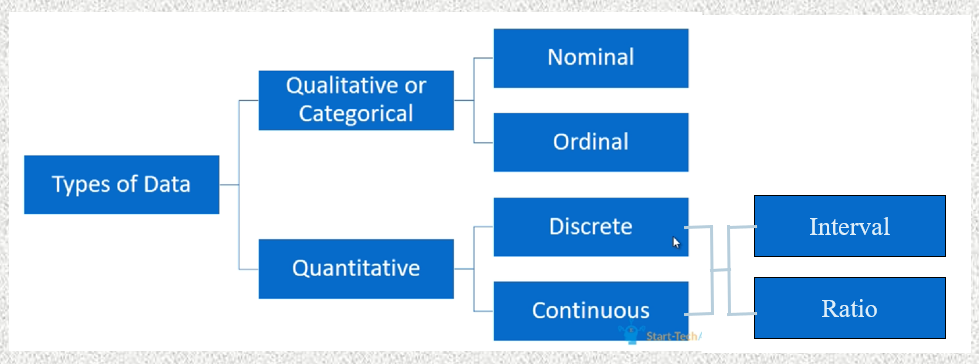
Types of Data
Defined when experiment is designed
Qualitative and Quantitative data
Qualitative Data
not numerical, also called categorical data
Quantitative Data
numerical
can be discrete: counting, gaps b/w values
or continuous: measured, no gaps (size of gaps depends on precision of instruments)
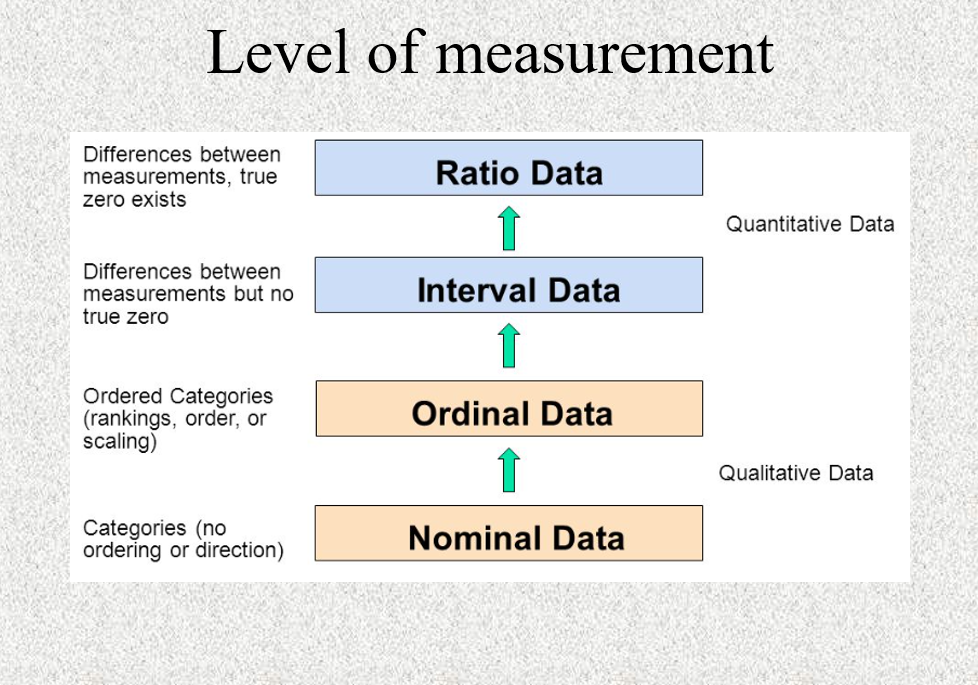
Level of measurement
Nominal: categorical data that cannot be ordered
Ex. colours (red, blue, purple)
brands (Ford, GM, Toyota)
Ordinal: categorical data that has a natural order
Ex. high, low
large, medium, small
Level of measurements
Interval: numerical data for which differences are significant but not ratios
Zero is arbitrary, it has no special meaning
Ex. temperature: 20C is not twice as hot as 10C
Ratio: numerical data, differences and ratios are significant
Zero really means that nothing is measured
Ex. weight: 20 kg is twice as heavy as 10 kg
Level of measurement (Image order)

Identifying types of data (Image order)

Identifying types of data (examples)
•If we record the colour of the cars passing on a bridge in a day, the variable is qualitative nominal
•If we record the age of the cars in categories such as ‘new’, ‘fairly new’, ‘used’, ‘old’, and ‘antique’, the variable is qualitative ordinal
•The time between each car measured by a chronometer is quantitative continuous ratio
•The year of construction of the cars is quantitative discrete interval
Designing (a good) experiment
Random sampling
All subgroups represented
No arbitrary selection
Controlling effects
Placebo effect
Double blind experiment
Repeatable
Any sample can be unrepresentative of the population by fluke
Simple sampling schemes

Complex sampling schemes
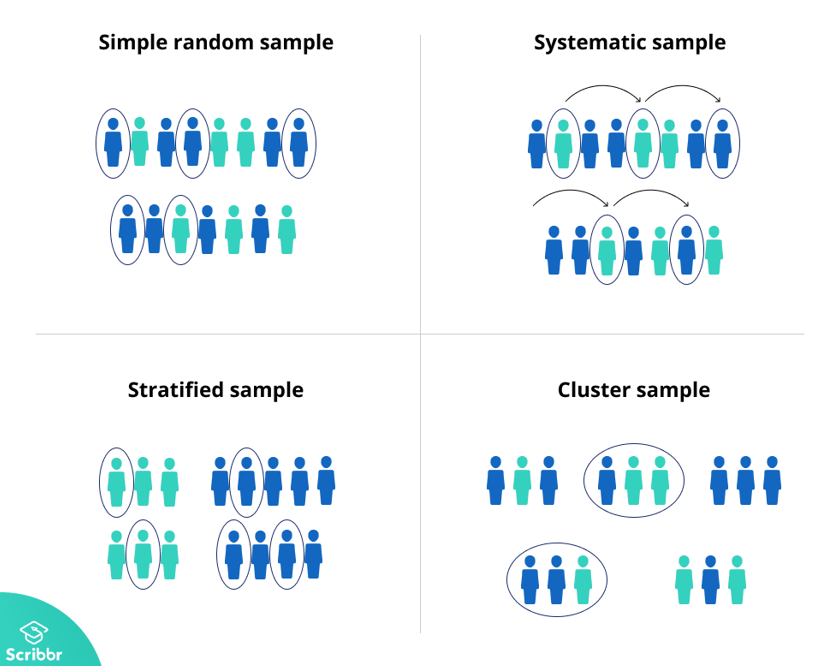
Stratified sampling
Break the population in subgroups, f.ex. gender, country, age
Random selection in each subgroup
Cluster sampling
Divide population in many subgroups
Randomly select clusters
Study all members of selected clusters
Sampling methods (image)

Designing an experiment
It should be possible to pick any member of a population
Every member should be equally likely to be picked (as much as possible)
In many modern surveys of people (for politics for example) random sampling has been partially abandoned because it is too hard to achieve.
Experiments that have known biases can still be valid if the biases are taken into account in the analysis.
Probabilistic Survey (Gallup)
eg. random telephone #'s sample
landlines
cellphones
==> UNCERTAINTIES
Non-probabilistic survey
eg. pool of 400 000 people
choose within those
==> NO UNCERTANTIES (but is not [completely] random)