AP Statistics Unit 2
1/15
There's no tags or description
Looks like no tags are added yet.
Name | Mastery | Learn | Test | Matching | Spaced |
|---|
No study sessions yet.
16 Terms
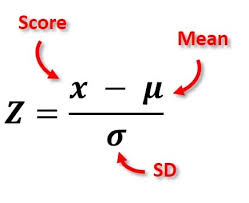
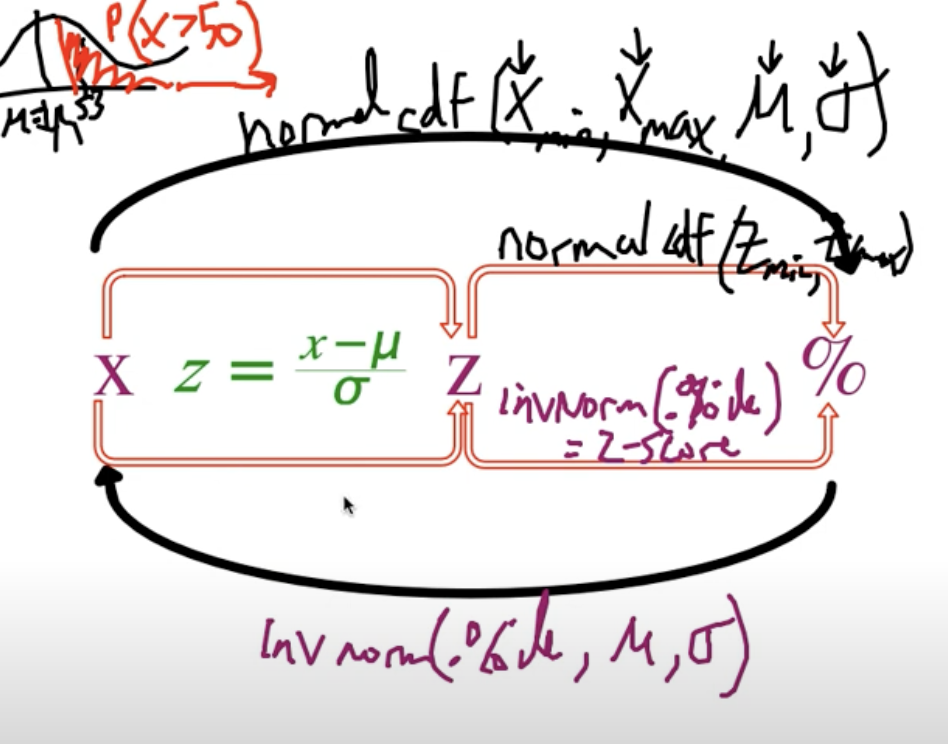
Z-Score: # of _____ above or below the _____.
Formula: ____
standard deviations, mean
pth percentile: The value with p percent of the observations____ to it
less than or equal
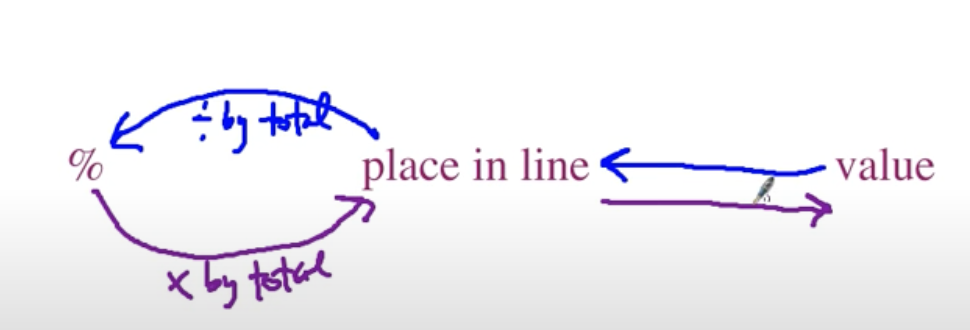
Calculating percentile from value
Calculating value from percentile
Find place in line, then divide by total
Multiply by total to get place in line, then find value
Standardization: a point’s location in the distribution depends on both ____ and _____
distance from center, spread/variation
why isn't the maximum act score of 36 at the 100th percentile
Because the 100th percentile means that your ACT scorewas higher than everyone else's. However, the highest score is 36, but many people can score 36 and they would be tied.
Density curve characteristics:
_____ data
total area = ____
used to calculate ____
quantitiative
1
probability
Where do you find median in density curve?
Where do you find mean in density curve?
splits area in half
balance point (pulled toward tail)
If data is symmetric, what is the relationship btwn mean and median
=
What is the shape of a Normal Curve?
____modal and ______ (no/few _____)
____ shaped
unimodal, symmetric, outliers
bell
What two numbers do we use to describe a Normal Distribution?
μ = population mean
σ = standard deviation
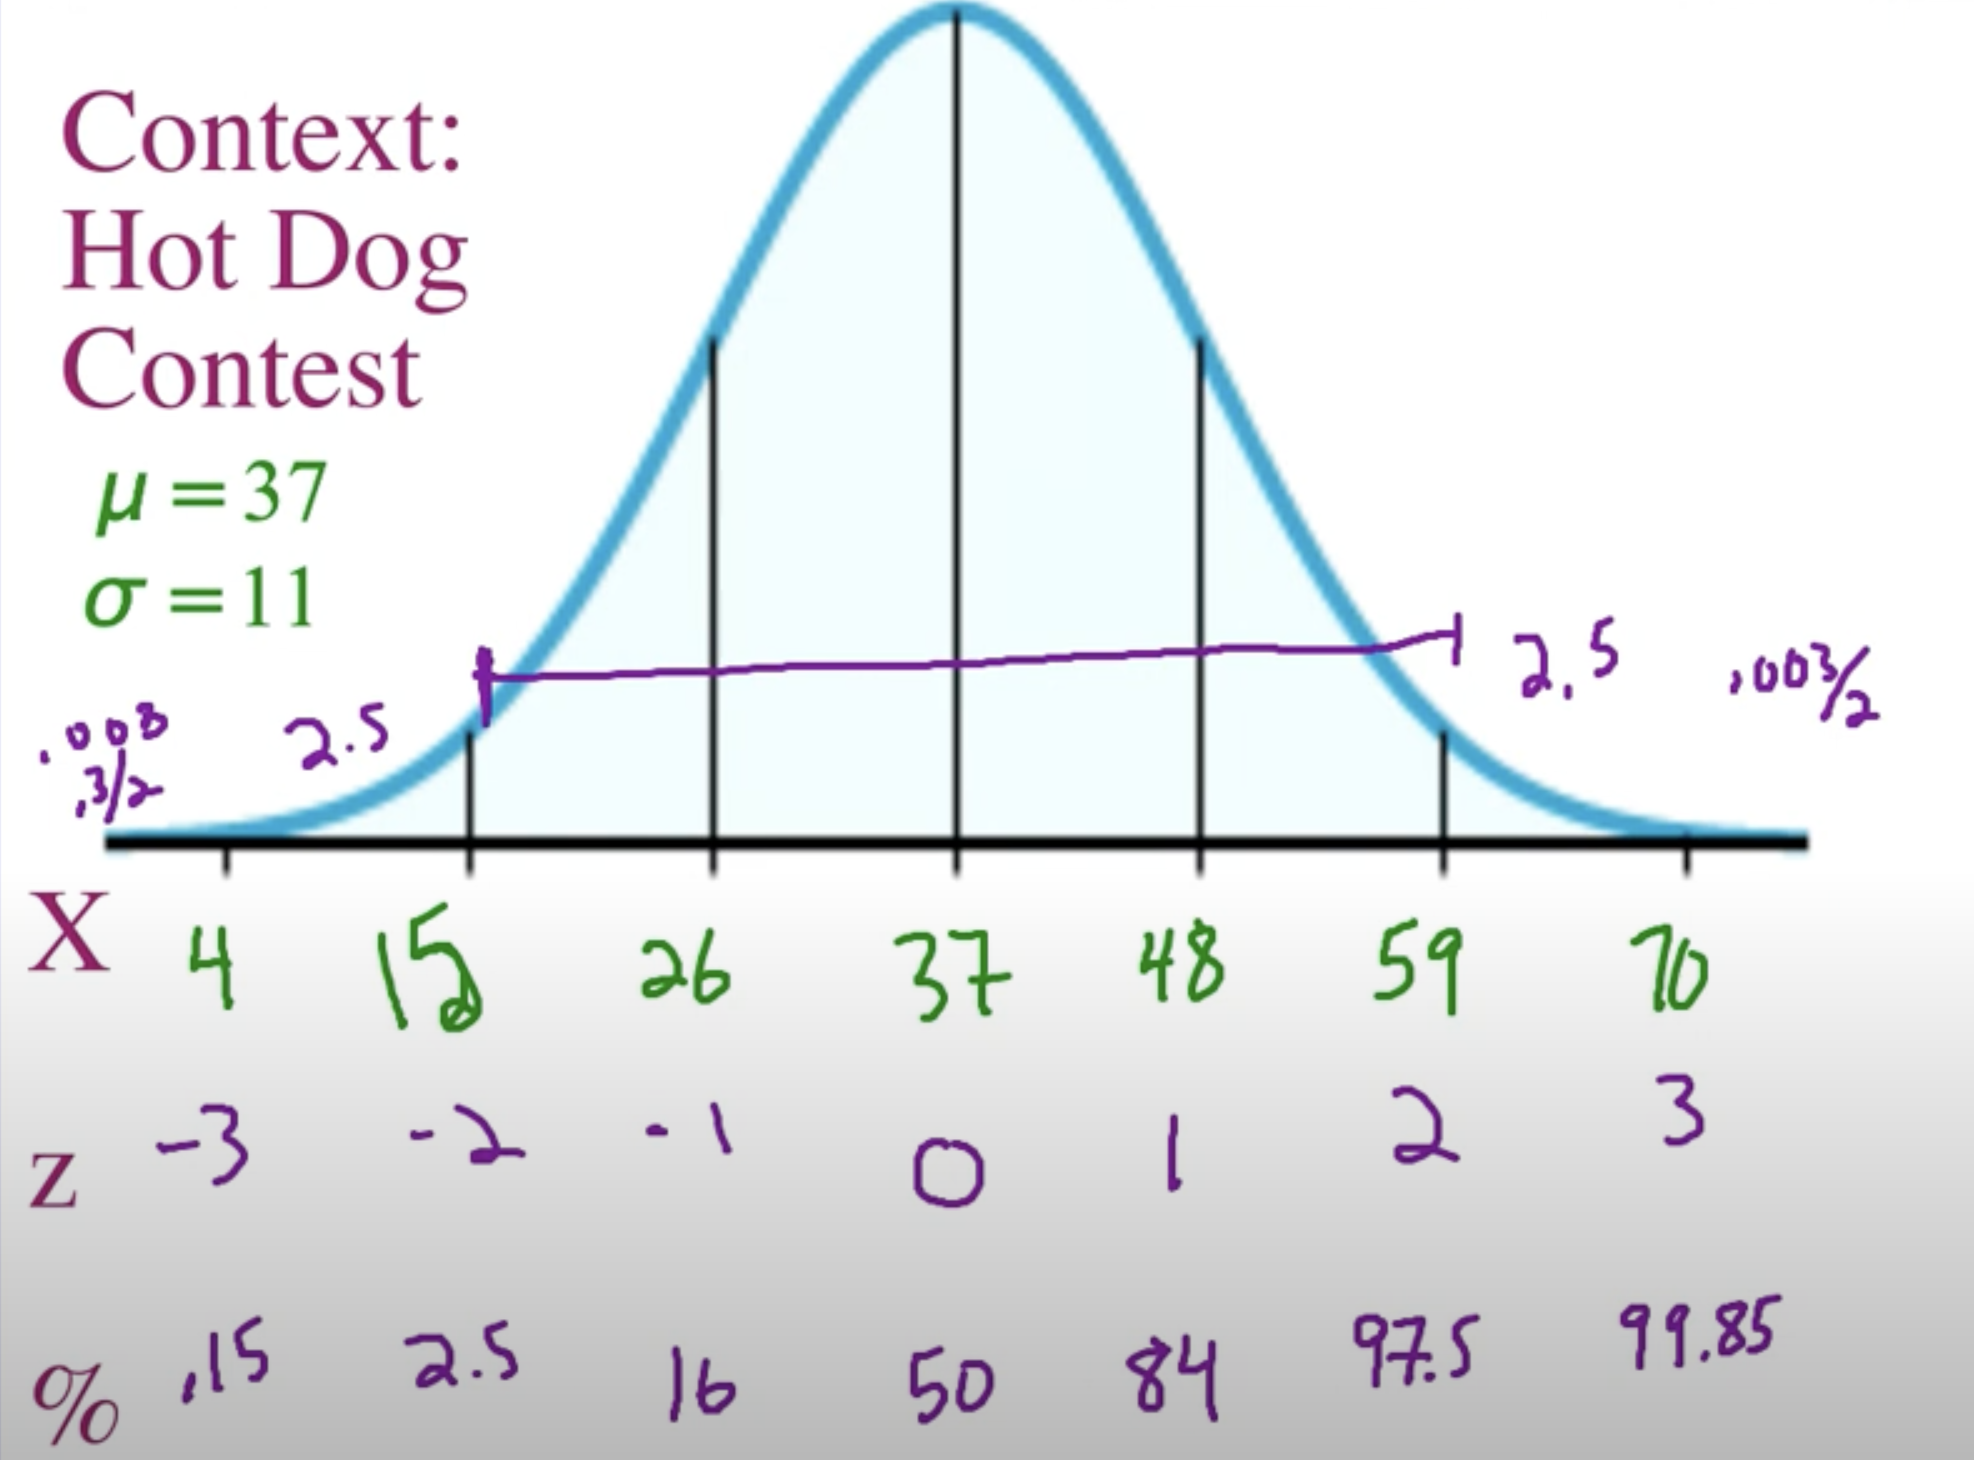
Empirical Rule
68-95-99.7
68% of data is within 1 standard deviation from mean
95% of data is within 2 standard deviations from mean
99.7% of data is within 3 standard deviations from mean
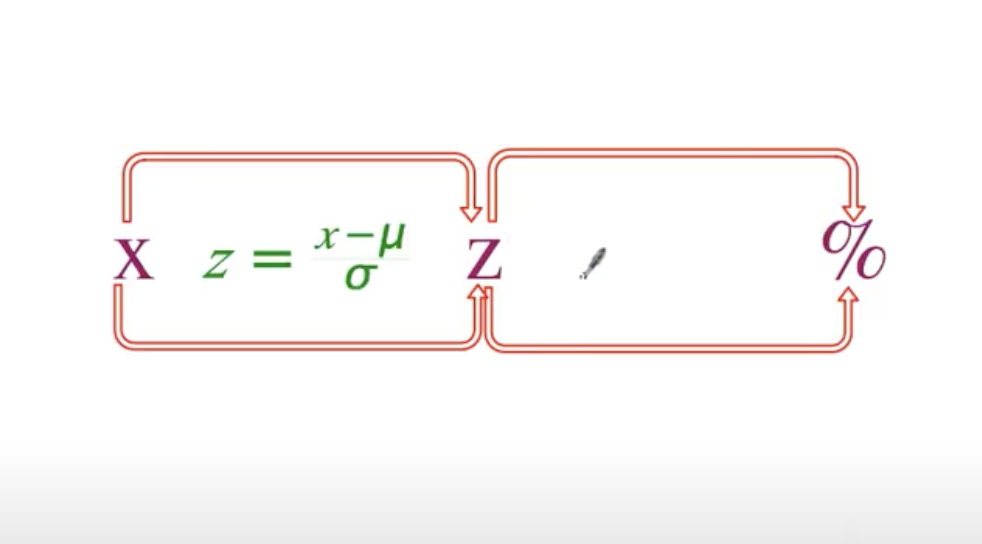
Relating Normal distribution to x-axis values, z-score, and percentile
Start in the middle: mean, 0, 50
As you go out, as z score increases by 1, %tile increases by ½ empirical rule, and value increases by 1 standard deviation
Standard Normal Distribution
N(0,1)
Normality can be assessed using closeness to empirical rule or normal probability plot
If data is normal, what should normal probability plot look like?
if skewed left:
if skewed right:
follow the line y=x, data clustered in middle
data clustered on right
data clustered on left
z scores of Q1 and Q3
standard deviations in IQR
-0.674, 0.674,
1.349