ERE week 4c - Is free trade good for the environment?
1/17
There's no tags or description
Looks like no tags are added yet.
Name | Mastery | Learn | Test | Matching | Spaced |
|---|
No study sessions yet.
18 Terms
Effects of trade liberalization
Direct effect: Composition
Country specialises according to comparative advantage
Indirect (growth) effect
Liberalisation leads to economic growth
NAFTA example - effects
People thought that USA firms would move to Mexico where less stringent labour and environmental laws → reduce environmental quality in Mexico
Composition effect
Mexico CA in agriculture and labour-intensive manufacturing (clean sectors)
Growth effect
Regress pollution on GDP for several pollutants and countries
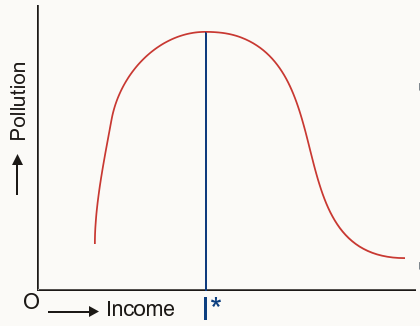
NAFTA example - Environment Kuznet curve
Max point (I*) at $5000 - GDP per capita of Mexico at time
So wouldn’t affect Air pollution that much
Paper found existing trends remained post NAFTA agreement
· Pollutants that were already decreasing before kept decreasing
· Critical of Environmental Kuznets curve
Income pollution relation - effects
Scale effect - More production = more pollution
Composition effect - stages of development countries go through
Primary Clean → Secondary Dirty → tertiary clean
As rich countries become tertiary → dirty industry moved to poorer nations
Developing nations have no one to ship it to
Technique effect - As income grows, production becomes cleaner
Enviro quality is a normal good
Is free trade good for the environment example - Assumptions
Small open economy – cant affect World p
Perfect competition
2 goods
X - K intensive& dirty & Y - L intensive & clean
Domestic relative p of X p = βpw
β - importance of frictions (Trade & Transport costs + NTBs)
Is free trade good for the environment example - Assumptions β
For an exporter of X: β < 1
Domestic p < world p Due to trade costs
For an importer of X: β > 1
Domestic p > world p Due to trade costs
With trade liberalisation β gets closer to 1 – trade costs fall (domestic p gets closer to world p)
Is free trade good for the environment example - Decomposition of pollution equation
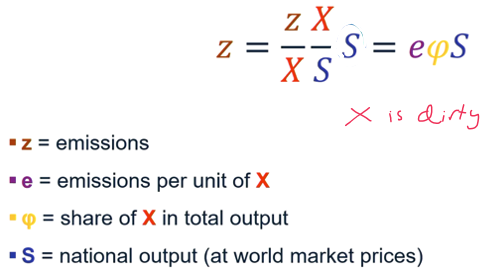
Is free trade good for the environment example - using trade liberalisation effects equation
Direct effect (trade-induced composition effect): φ
countries that specialise in X become dirtier
Indirect effects
Scale: More production S increases pollution
Technique: e declines with income
Which countries specialise in dirty goods?
Countries with lenient environmental policy
Poor countries
Pollution haven hypothesis
Capital intensive nations (Polluting industries are K-intensive)
Rich countries
Factor endowments hypothesis
Is free trade good for the environment example - empirical evidence
Scale effect
For every 1% rise in production – urban SO2 concentration rise by 0.25-0.4%
Technique effect
1% increase in income = -1.15% → -1.6%
Lagged income used as effects take time
Composition effect
1% rise in trade intensity = -0.4% -> -0.9%
Economic growth reduces pollution - Technique effect dominates scale effect (negative effect of trade on pollution) → FT good
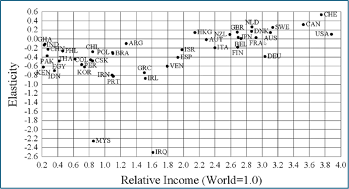
Factor endowment vs pollution haven
Positive & significant relation - income and trade intensity elasticity
Factor endowment effect dominates pollution haven effect
net effect is small
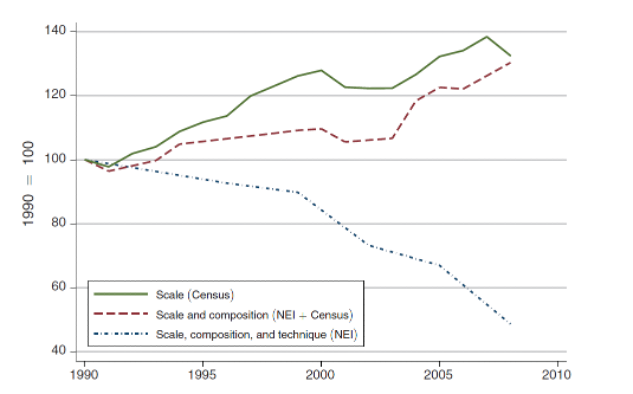
US manufacturing emission - Overall
Not Scale effect - output grew
Not technique effect - Looking at products not industry
Composition effect - More cleaner products being produced
The more products you distinguish, the larger the role of composition relative to technique
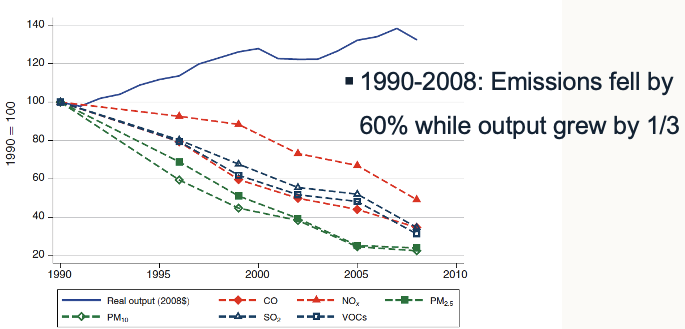
US manufacturing emission - Which effect
Emission reduction almost completely due to technique effect
Production methods have become cleaner
Output and pollution equation
More pollution = more possible produced per L
Less L dedicated to abatement
More L to use on production (pollution is FofP)
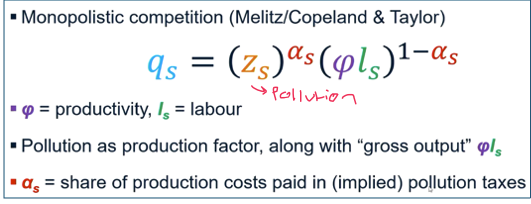
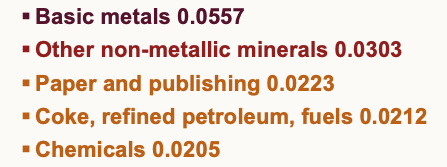
Output and pollution equation - sectoral as
as - implied pollution tax payment share of production costs
Assume tax rate equal across sectors
as proportional to emissions / $ input cost
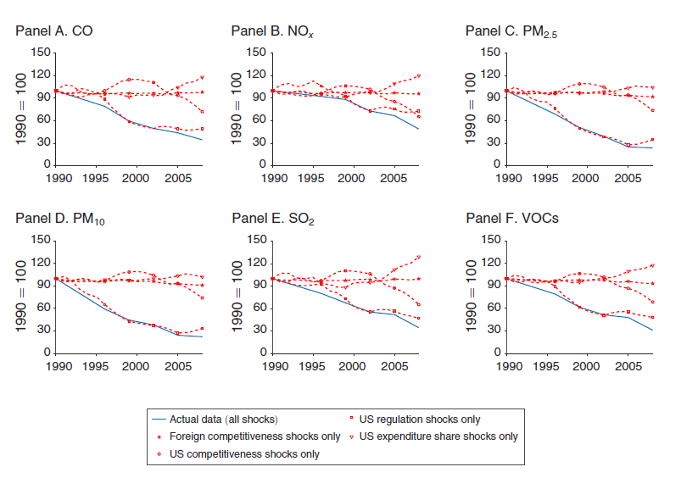
Output and pollution equation - sectoral as (most polluting down)
Historic shocks affecting secondary sector (emissions and output)
Foreign competitiveness
Foreign productivity, trade costs, environmental regulation
US competitiveness
US productivity, trade costs
US environmental regulation (main driver)
Implied NOx tax nearly doubled from 1990 to 2008
Sectoral expenditure shares
how much consumers spend on different products
Growth in Chinese exports had a large effect on US manufacturing employment, why not on emissions?
Mostly low skilled sectors - not dirty
Did not affect composition much
Effect on output & value added smaller than on employment
US import penetration ratio small (<10%)
Growth in US competitiveness reduced emission intensity, but also increased output
US environmental regulation became stricter (1990–2008)