Module 6: Non-Parametric Approaches
1/42
There's no tags or description
Looks like no tags are added yet.
Name | Mastery | Learn | Test | Matching | Spaced | Call with Kai |
|---|
No analytics yet
Send a link to your students to track their progress
43 Terms
Parametric Tests
Refers to the use of sample statistics to make inferences about population parameters.
Think: From this little group, we can estimate that the population scores will range from this to this.
Parametric tests are based on…
Normally distributed data
What 2 non-parametric tests are covered in this course, and how do we know they are non-parametric?
Chi-square
Spearman’s Rho
They are not based on normal distributions
Think: Non-parametric tests are abnormal and make me want to cry(square) and spear(man’s rho) myself in the foot.
State the 4 types of variable measurements
Nominal
Ordinal
Interval
Ratio
Nominal Variables
Variable measurements that are non-numeric, and a name is assigned to the score rather than a number
There is also no value scale, so changing the order of variables doesn’t influence interpretations (think: changing the jersey numbers of players on a footy team will not impact the score - it is just a label)
Think: Healthy vs unhealthy breakfast, study vs no study, gender, race, anything will a number label
What kind of scale are dummy variables measured on when assigned their 0,1 values?
Nominal - the numbers just serve to sort data, not apply a magnitude
Ordinal Variables
Variables with a label (numerical or other) that assign a magnitude.
The variables can be put in an order
The differences between each score on the variable do not matter
Think: high distinction vs distinction
Order (lowest to highest) = D → HD
Difference between can be inconsistent. In one sample, the D could = 75 and HD = 99, but another could be D = 84 and HD = 86. Both would be represented as D, HD
A survey asks you to rate your customer experience on a scale of 1-5. What kind of variable is used?
Ordinal
Think: A score of ‘3’ could mean 3.1 or 3.9, but both would show as ‘3’.
Compare ordinal and ratio variables
Both assign a magnitude to the score that can be put in an order from least - most or lowest to highest etc
In ordinal scales, the order matters but the differences between each score do not matter
Interval Data
Like ordinal data in that there is a magnitude assigned to the variable, however the differences between each value matter and should be the same.
The difference between each score should be able to be measured
Intervals should be equal and meaningful
The zero point is arbitrary
Think: If you measure temperature at 8:00am (20º) vs 12:00pm (30º), each 1º interval represents a consistent change in temperature. We can conclude that it was 10º warmer (meaning) at 12:00pm than 8:00am. A 10º difference between 12:00pm and 1:00pm would mean the same thing. A temperature of 0º does not indicate the absence of temperature and is therefore arbitrary - 0º is a valid measure in itself and is the freezing point of water.
Compare interval and ordinal data
Order matters in both
Ordinal data does not care about the distance or difference between each score
Interval data should have equal differences that are meaningful.
Ratio Data
When numbers tell us how much of one thing we have in comparison to another thing
The orders, differences and ratios are all meaningful
All measurements are relative
All intervals between units are equal
All measurements and intervals are meaningful
Measure has a true zero point.
Think: Height and weight - they are both measured equal interval units that have a consistent meaning (a 10cm difference will always be a 10cm difference regardless of what you’re measuring). You can also say something is twice the height or weight of another thing. If something weights 0kg or is 0cm long, there is an absence of an object or idea being measured.
What do parametric tests involve?
Estimation of at least one population parameter
Assumptions about the shape of the data (normality)
Assumptions about the scaling of the variables
Think: Parameter: think of it like a distribution of exam scores for a particular grade or subject like the bell curve
What variable scales do parametric tests assume?
Interval or ratio
What do t-tests use to estimate population variance? Is it parametric or non-parametric?
Sample variance
Parametric
T-tests assume that the _______ is distributed normally around the mean.
Sampling error
Non-parametric tests do not make ______ assumptions about the specific shape of the distribution.
A priori
Alternative name for non-parametric tests
Distribution-free tests
What correlation test is used when data is violates normality and linearity as the data is data?
Spearman’s Rho
Think: Yucky data = Spearman’s Rank 👎🏻
Do non-parametric tests assume the variable scales to be interval or ratio?
No
Advantages of Non-Parametric Tests
Do not require assumptions of normality and homogeneity of variances
Ideal for analysing data from small samples
Generally easier to calculate
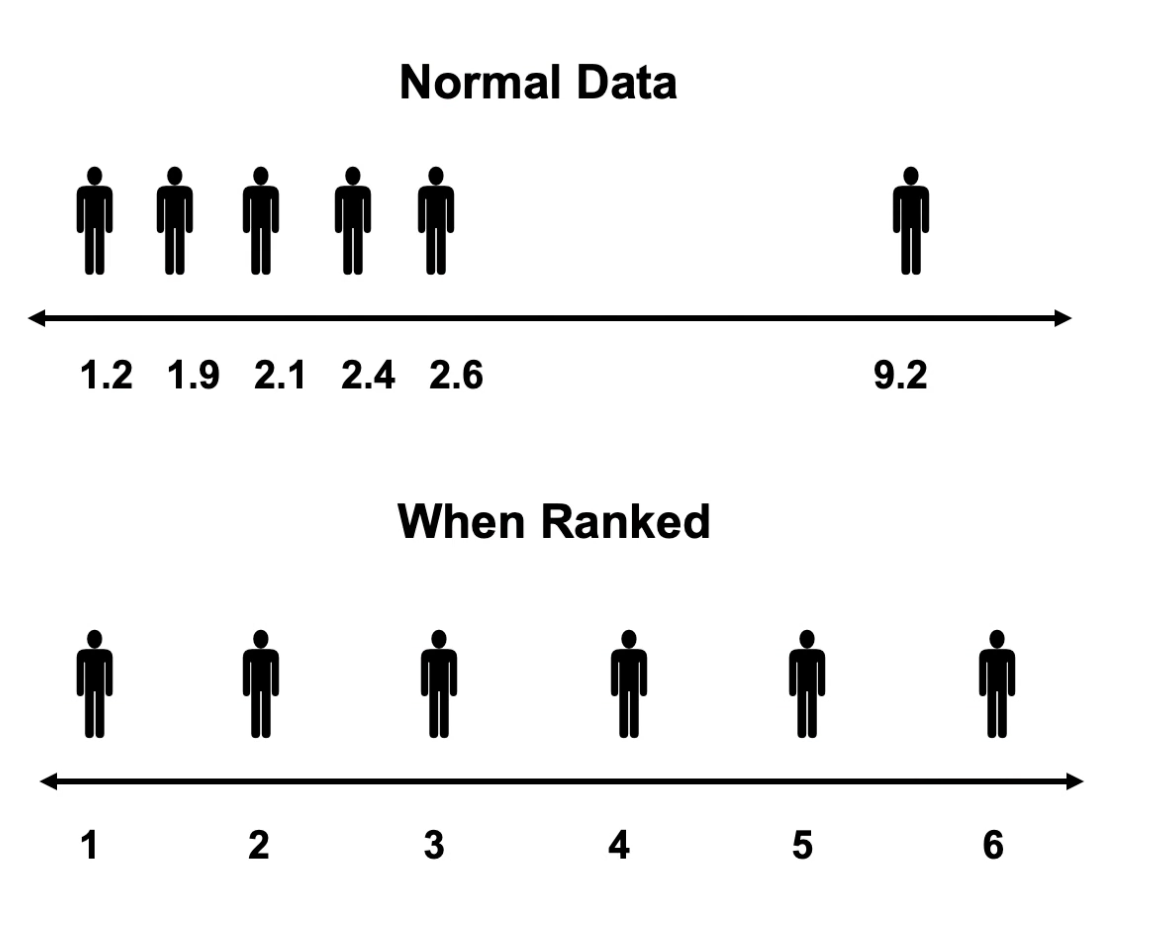
Use of ranks reduces effects of extreme outliers
Why are non-parametric tests ideal for analysing data from small samples?
Because small samples are often skewed and can’t be rescued by central limit theorem.
The data is severely skewed. Which is a better approach? Parametric or Non-Parametric
Non-Parametric
The data is normally distributed and the variable is measured on an interval scale. Parametric or non-parametric approach?
Parametric
Which generally requires more computation? Parametric or Non-parametric?
Parametric
Ranking
Involves ordering a set of scores from the smallest to the largest
Smallest = 1, Largest = n
Why do we use ranking?
Provides a standard distribution of scores with standard characteristics
Assumptions of Pearson’s correlation
Interval or ratio data
X and Y are normally distributed
The relationship between X and Y is linear
Assume a bivariate normal distribution (both variables normally distributed) based on interval or ratio scales.
Pearson’s correlation is based on…
z scores
Difference between Spearman’s Rho and Pearson’s correlation coefficients
Spearman’s based on ranked data
Pearson’s based on interval or ratio data and z scores
When is it useful to use Spearman’s rho?
When data naturally falls into ranks
There are extreme scores or outliers
There is a monotonic relationship between the variables
True or False: The same formula is used to calculate Spearman’s rho and Pearson’s
True - difference is rho is ranked
Monotonic Relationship
When increases in X scores result in an increase in Y scores, but not at a constant rate.
Non-linear
What added step does Spearman’s Rho do that Pearson’s doesn’t?
By ranking the data, it can turn a monotonic relationship into a linear relationship but Pearson’s doesn’t do this.
Hence why linearity is not an assumption of Spearman’s.
Disadvantage of Non-Parametric Tests
Less statistical power
What is the goal of non-parametric tests in comparison to parametric tests in terms of the null hypothesis?
To establish overall differences between two (or more) distributions, not to identify the differences between any particular parameters.
Therefore the null hypothesis would be that the samples come from identical populations, not just populations with the same mean.
What does rejecting the null hypothesis mean in non-parametric tests?
That populations differ, perhaps not just on the basis of their central tendency (i.e. mean)
Point-Biserial Correlations
Same as Pearson’s correlation, however instead of having two interval or ratio variables, one of them is dichotomous.
Dichotomous variable would be scored as a dummy variable
Pearson’s r formula then used to find the correlation.
How do you interpret a point-biserial correlation?
Absolute value of rpb reflects strength of the relationship
The sign of the correlation depends on scoring (whether you assigned the two levels of the dichotomous variable as 0 and 1, or 1 and 2 etc.)
r2pb is interpreted the same way as r2
Sigificance testing is the same as pearson’s
The beta weight in a bivariate regression is the same as
Pearson’s correlation coefficient
What test will the point-biserial correlation statistic be identical to?
t-test
Why would we use a point-biserial correlation instead of just running a t-test if they are identical?
Correlations can be extended to regressions, which t-tests cannot. This means:
We can square the correlation for an easier calculation of variance explained
In a correlation we can have a combination of continuous and dichotomous variables
Regressions are extensions of…
Correlations