Business 212: Business Statistics Ch 16. Using Control Charts in Business
1/44
There's no tags or description
Looks like no tags are added yet.
Name | Mastery | Learn | Test | Matching | Spaced | Call with Kai |
|---|
No analytics yet
Send a link to your students to track their progress
45 Terms
statistical process control
a way to apply statistics to identify and fix problem in quality control
common cause
comes from a stable system
special cause
comes from a specific issue or event
PCDA
plan, do, check, act
The design of a product is causing quality control issues. This is an example of a which type of cause?
Special
Common
Specific
Uncommon
Common
A cause of variation that comes from a specific event or issue is what type of cause?
Uncommon
Common
Specific
Special
Special
After figuring out whether a change reduces variation, the PDSA method requires that the company do which of the following?
Plan
Study
Do
Act
Act
Implementing a change in the process is part of which step of PDSA?
Study
Do
Act
Plan
Do
How does the Act step relate to the Planning step of PDSA?
The process is random so Act and Planning may be the same
The process is hierarchical with Act coming first
The process is terminal so Act is the last step
The process is cyclic so Act leads to Planning
The process is cyclic so Act leads to Planning
Process control
the mechanism by which a company ensures that its processes are standardized to the point that variance is minimal and there is high reliability in the outputs of the process
Rational sub-grouping
instead of comparing data points over time, the sub-grouping actually examines the results of production that occurred under substantially similar conditions
Process sampling
occurs when the output or result of process, usually selected at random, is evaluated
A process that, when followed strictly, still produces a poor output is a process that _____.
automates error
reduces costs
controls a sub-group
improves output statistics
automates error
ABC Widgets has a manufacturing plant that produces 100,000 units per day. Every unit produced on any given day should have virtually no variances between units. The term _____ describes the act of scrutinizing a part of the process for the purpose of evaluating whether the process is proceeding as expected.
process sampling
root cause analysis
variance evaluation
process observation
process sampling
Which of the following would NOT qualify as a rational subgroup for a sampled process?
All widgets made from 1 of 12 machines in the same factory.
All widgets produced by the overnight shift.
Widgets produced in 1 of 21 nationwide factories.
Widgets produced over a 10-year period.
Widgets produced over a 10-year period.
The now defunct automaker Saturn experimented with a rational sub-group process control mechanism by which any employee at the company could:
Immediately and unilaterally stop the entire assembly line if they noticed a process problem that could impact quality or safety.
Select any car from the assembly line for immediate quality inspection.
Anonymously communicate the trade secrets of its competitors.
Report a violation of the collective bargaining agreement (CBA) without leaving their post.
Immediately and unilaterally stop the entire assembly line if they noticed a process problem that could impact quality or safety.
Jamestown Steel produces beams for building construction. Which scenario is the BEST example of a rational subgroup?
Line workers are permitted by the company to stop production if any beam appears to be too long.
The company creates one test batch for every 50 beams produced.
The company sorts beams by length and double-checks every beam prior to shipping.
The company randomly chooses a few beams from every batch to make sure they are substantially similar in specification and quality.
The company randomly chooses a few beams from every batch to make sure they are substantially similar in specification and quality.
attribute data
non-continuous data
control chart
a graph that shows how something changes across the time
Np chart
how often something occurs with a fixed sample size when the choices are yes/no
the sample size is fixed
p chart
how often something occurs with varying sample sizes when the choices are yes/no
c chart
how often something occurs with a fixed sample size when there are more than two choices
u chart
how often something occurs with varying sample sizes when there are more than two choices
If a sample size is fixed and there are only two choices (yes or no) for whether something has occurred, it is best to use a(n) _____ chart.
p
Np
c
u
Np
A business owner is collecting data about how many products they sell in each of three sizes: small, medium, and large. The data the owner is collecting is _____ data.
continuous
controlled
attribute
continuum
attribute
If a sample size varies and there are only two choices (yes or no), the data is best arranged in a(n) _____ chart.
p
Np
u
c
p
Which type of data is on a continuum?
attribute
categorical
controlled
continuous
continuous
A manager has collected data that looks at how many bugs are in the programs his company produces each day. The company produces different numbers of programs each day, and some programs have several bugs. The best choice is for the manager to use a(n) _____ chart.
u
Np
p
c
u
variables
things that change value
control chart
visual representation of information across time
Khalil wants to see how much variation there is in the cost of manufacturing his company's products. He is likely going to use a control chart to see the _____ data.
distribution of
monitored stability in
trends in
implemented changes of
distribution of
Visual representations of information across time are called _____.
distributive curves
control charts
monitored charts
attribute curves
control charts
Which of the following is a variable in business?
cost to manufacture a product
All answers are correct.
durability of a product
profit and loss
All answers are correct.
Leslie's boss gives her a control chart showing her how much time the sales reps in her department have spent with customers over the past month. This allows Leslie to see if the time spent with customers is increasing, decreasing, or staying the same over time. This is an example of using control charts to _____.
monitor a situation
determine whether implemented changes are working as expected
follow trends in the industry
understand when to take action and what action to take
monitor a situation
Using control charts to decide whether to increase spending on professional development for employees is an example of using control charts to _____.
follow trends in the industry
determine whether implemented changes are working as expected
understand when to take action and what action to take
monitor a situation
understand when to take action and what action to take
control chart
graph that shows variations in quality of manufacturing over time
systematic cycle
a regular up and down pattern
trend
data that goes up and down over time
sudden change
indicates something major occurred once to shift manufacturing
gradual change
indicates that something is happening on a continuous basis or something that has happened is gaining steam
Clarence is looking at a control chart for his company. It shows that they are very productive for three weeks, and then they have a week where they are not productive, followed by three more weeks of high production. Which type of pattern is Clarence noticing?
systematic trend
systematic cycle
sudden change trend
gradual change trend
systematic cycle
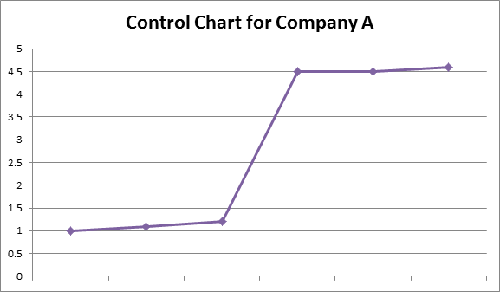
What is most likely to have caused the change in this control chart?
an initiative that is gaining steam
a sudden, one-time occurrence
a continuous process initiative
a regular occurrence that impacts production
a sudden, one-time occurrence
Regular maintenance of equipment, training of employees, and other ongoing initiatives can help companies improve their production. Which pattern on a control chart will most likely represent these types of changes?
sudden change trend
systematic cycle
systematic trend
gradual change trend
gradual change trend
Clarence is looking at a control chart for his company. It shows that they are very productive for three weeks, and then they have a week where they are not productive, followed by three more weeks of high production. Clarence's company's changes are likely due to:
something major that occurred once to shift production
something that is gaining steam and shifts production
something that is happening on a continuous basis to shift production
something that regularly influences production
something that regularly influences production
Juliana examines a control chart that shows that her company's manufacturing plant suddenly began making more faulty items after they installed a new machine. Which type of pattern is Juliana observing?
sudden change trend
gradual change trend
systematic cycle
systematic trend
sudden change trend