Stats 250 exam 1
1/32
There's no tags or description
Looks like no tags are added yet.
Name | Mastery | Learn | Test | Matching | Spaced | Call with Kai |
|---|
No analytics yet
Send a link to your students to track their progress
33 Terms
parameter
deals with total population
statistic
deals with sample
M
the mean of parameter
μ̂
the mean of the statistic
σ
the standard deviation of the parameter
σ̂
the standard deviation of the statistic
pi
the proportion of the parameter
pi-hat
the proportion of the statistic
What summaries do quantitative data use?
mean, standard deviation, IQR
What summary does categorical data use?
proportion
What does z-test statistic measure?
how many null standard deviations our observed sample proportion pi is from the hypothesized null population proportion
What is the definition of a p-value?
how compatible data observed from a random sample are with the hypothesized value of the population parameter. The smaller the p-value, the less compatible with null hypothesis
what lower tail is this for? <
TRUE
what lower tail is this for? >
FALSE
normal distribution
unimodal and symmetric
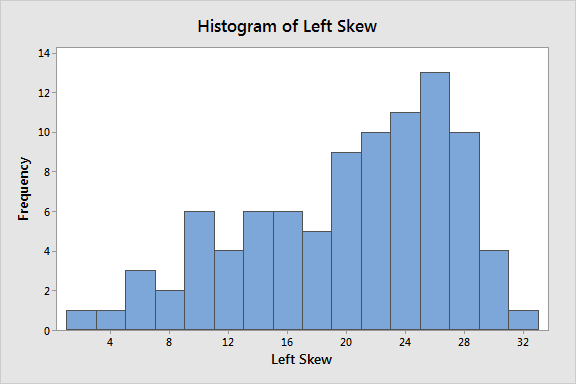
what skew of graph is this?
left skewed
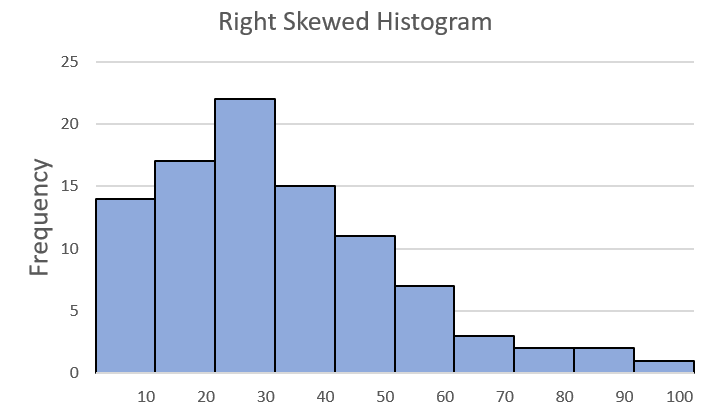
what skew of graph is this?
right skewed
What value is the center?
pi
variability increase
sample size decreases
variability decreases
sample size increases
sample distribution
everything selected in one random sample, meant to vary
sampling distribution
all of the samples themselves, not specifically selected, meant to show a pattern
population distribution
shows all of the set of values
p-value= less than 0.01
very strong evidence against the null hypothesis and in support of the alternative hypothesis
p-value= 0.01-0.05
strong evidence against the null hypothesis and in support of the alternative hypothesis
p-value= 0.05-0.1
some evidence against the null hypothesis and in support of alternative hypothesis
p-value= above 0.1
not enough evidence against the null hypothesis and in support of the alternative hypothesis
Total area under a normal curve
1
How large must be the sample size be to use CLT?
n=25
t-test
how many null standard deviations our observed sample proportion pi is from the hypothesized null population proportion, used for quantitative data
degrees of freedom
n-1
What does the CLT state?
as sample size increases, the distribution of the sample mean approaches a normal distribution, regardless of the population's underlying distribution
If sample size increases, what happens to p-value?
p-value decreases