Unit 2-1: Population and Migration
1/29
Earn XP
Name | Mastery | Learn | Test | Matching | Spaced |
|---|
No study sessions yet.
30 Terms
Age Structure
Distribution of individuals within a population based on age groups; shows the proportion of people in different age categories
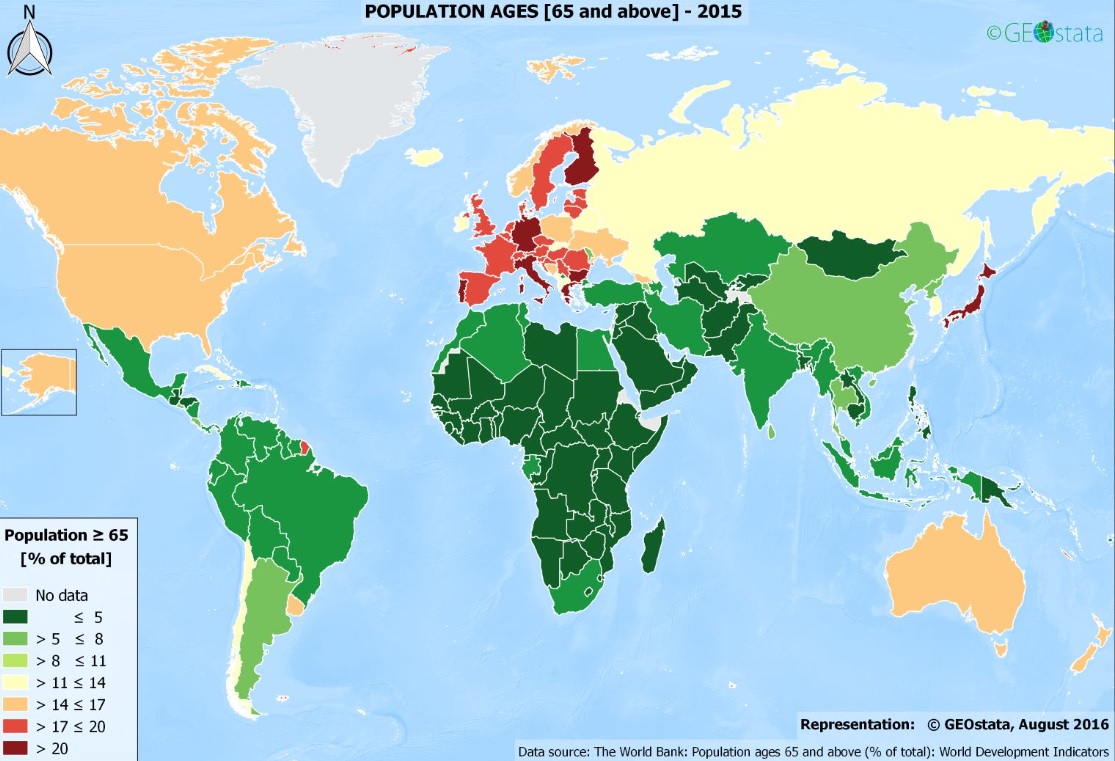
Aging Population
Demographic trend where the proportion of older individuals within a population increases, often due to declining birth rates and higher life expectancy
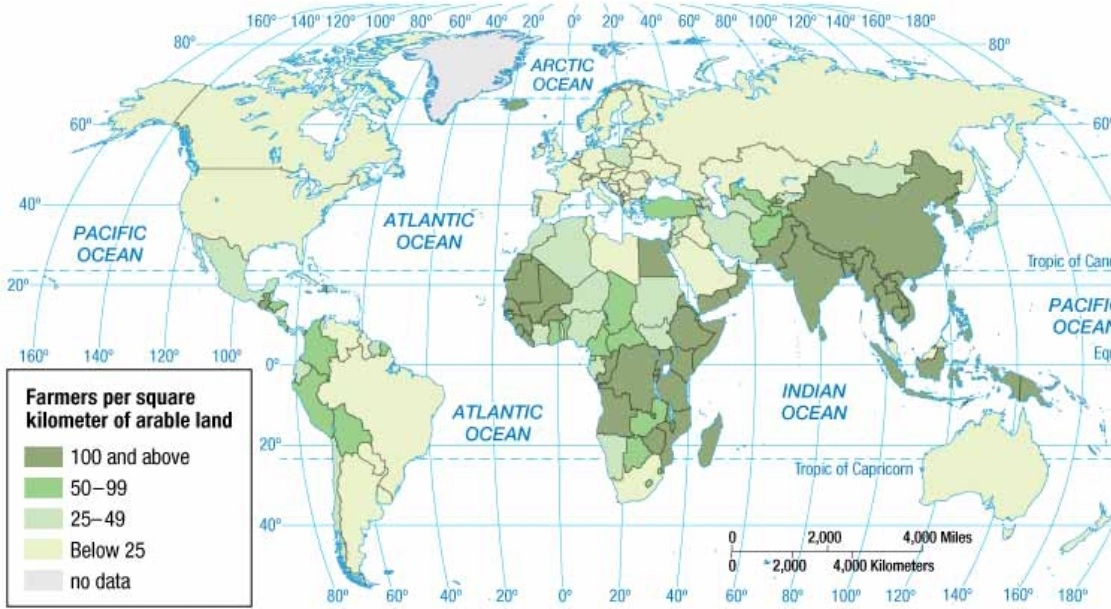
Agricultural Density
Number of farmers per unit area of arable land
Higher agricultural density suggests that there are more farmers relative to the amount of arable land, potentially indicating pressure on the land or less efficient farming practices
Antinatilist Policies
Government strategies designed to decrease birth rates and slow population growth; policies often encourage smaller families and lower fertility rates, often seen in countries with rapidly growing populations
EX - China's One-Child Policy
Arable Land
Land that is suitable for farming, meaning it can be plowed and used to grow crops
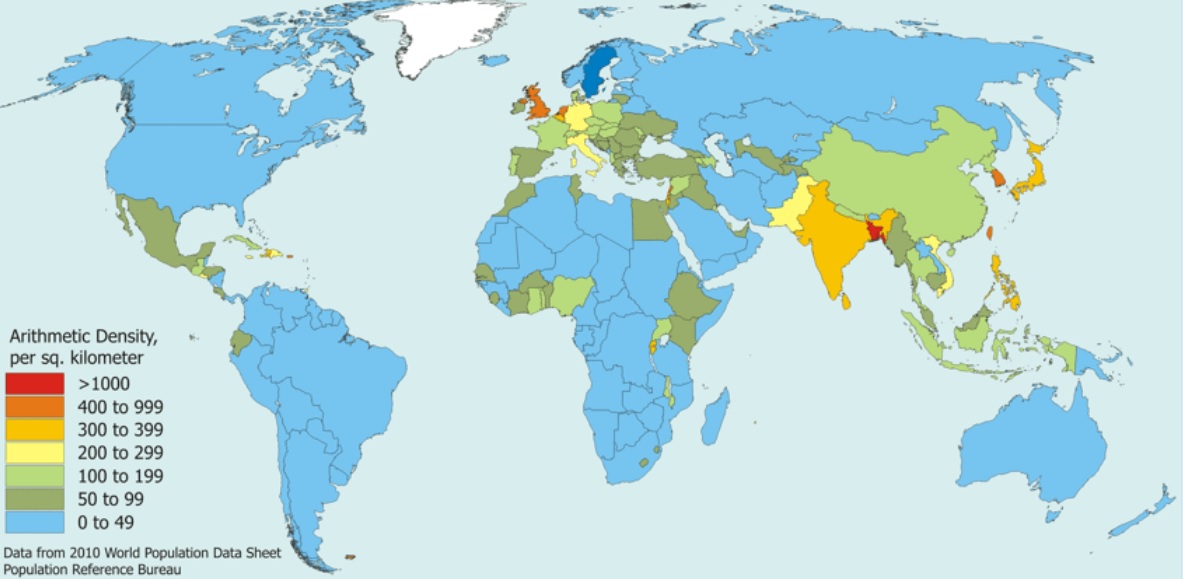
Arithmetic (Crude) density
The average number of people per unit of land area (usually per square mile or kilometer);higher the number = greater the pressure (strain) on the land for resources (water, timber, minerals, non-renewable resources) and sanitation
Carrying Capacity
The maximum number of individuals a particular environment can sustainably support without degrading the environment or depleting resources
EX - food, fresh water, building materials, sanitation, energy
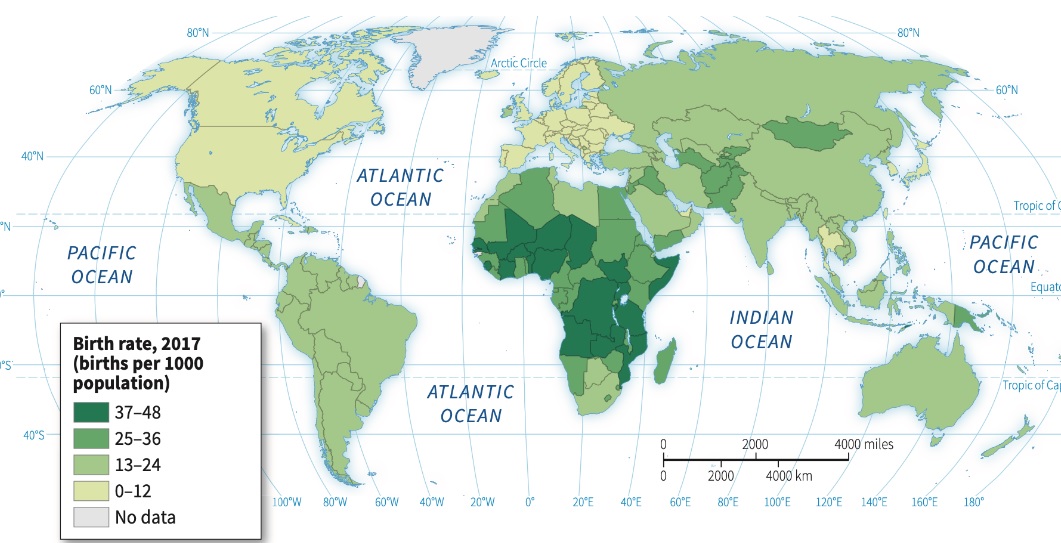
Crude Birth Rate (CBR)
Measure of the total number of live births in a year per 1,000 people in a population
MDCs (Core) have lower CBR; LDCs (Periphery) have higher CBR
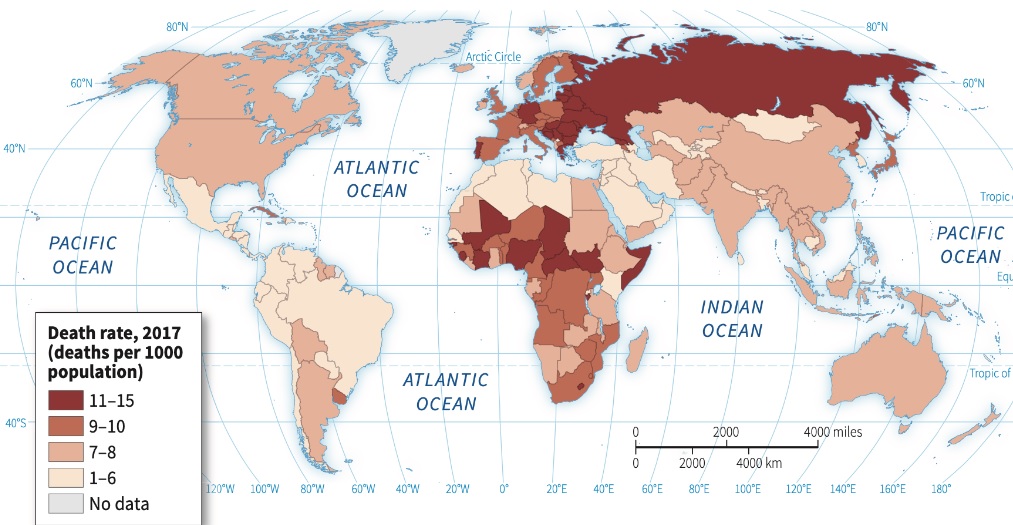
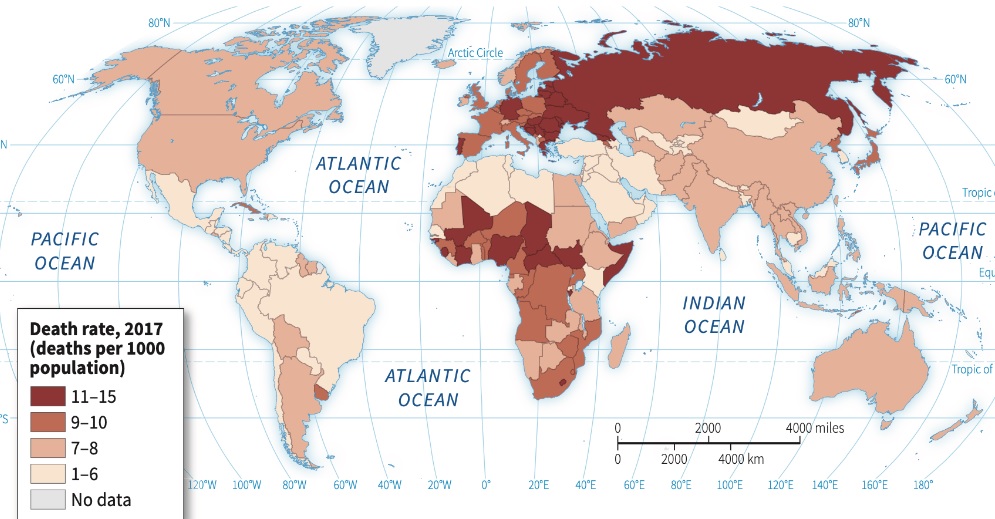
Crude Death Rate (CDR)
Also known as mortality rate. The annual (yearly) number of deaths per 1,000 people in a population
NO direct connection with development!!
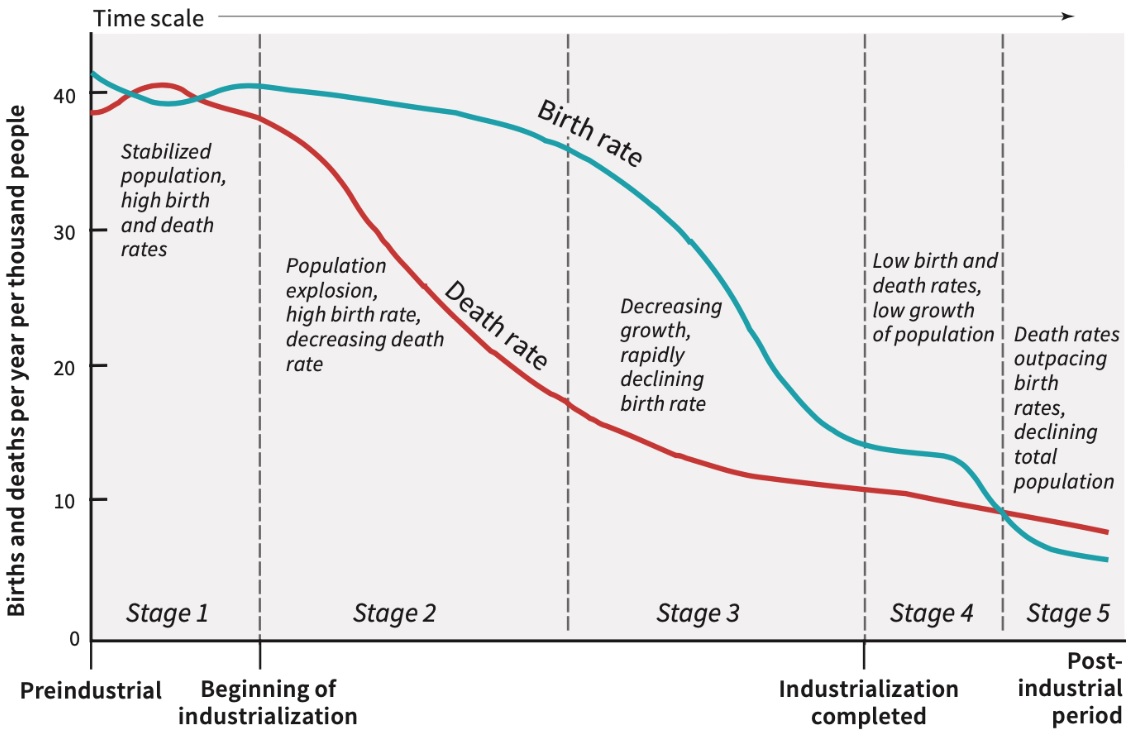
Demographic Transition Model (DTM)
How crude birth rate (CBR) and crude death rate (CDR) as well as the resulting rate of natural increase (RNI) change over time as countries go through industrialization and urbanization
A framework that describes how birth and death rates change as a country develops economically
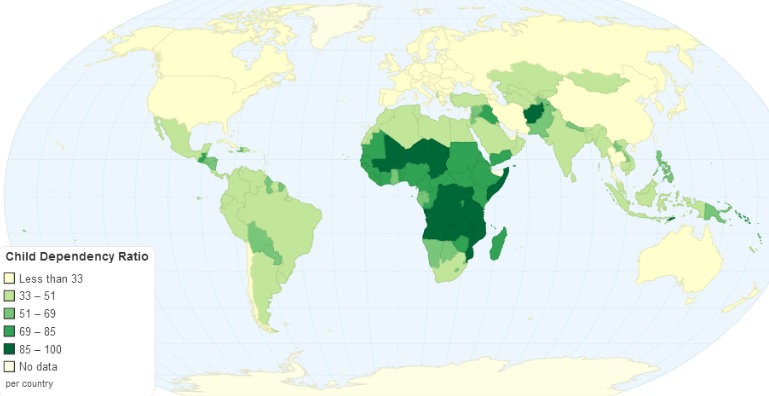
Dependency Ratio
The proportion of a population that is considered dependent (too young or too old to work) compared to the working-age population
Dependent = 0-14, 65 and older
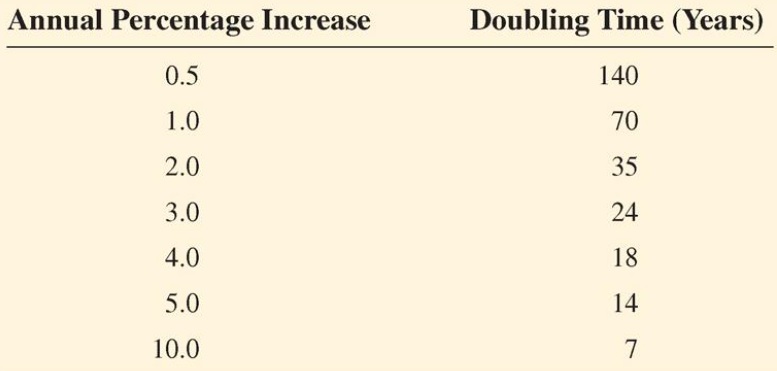
Doubling Time
The number of years it takes for a population to double in size, assuming a constant growth rate
Rule of 70 - calculate doubling time by dividing 70 by a country’s rate of natural increase (RNI)
Higher RNI (LDCs) = shorter doubling time
Lower RNI (MDCs) = longer doubling time
Epidemiological Transition Theory
Changing patterns of population distributions in relation to changing patterns of mortality, fertility, life expectancy, and leading causes of death
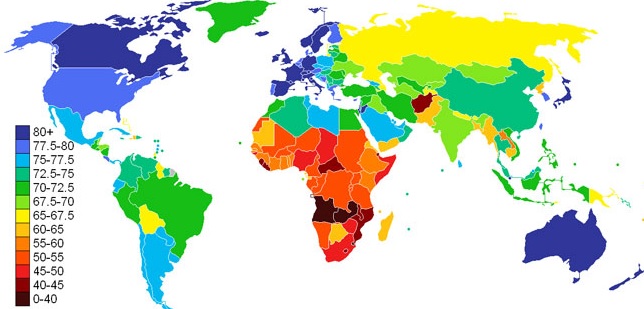
Life Expectancy
The average number of years a person is expected to live, given current conditions, including social, economic, and medical factors
Higher in MDCs (Core) and lower in LDCs (periphery)
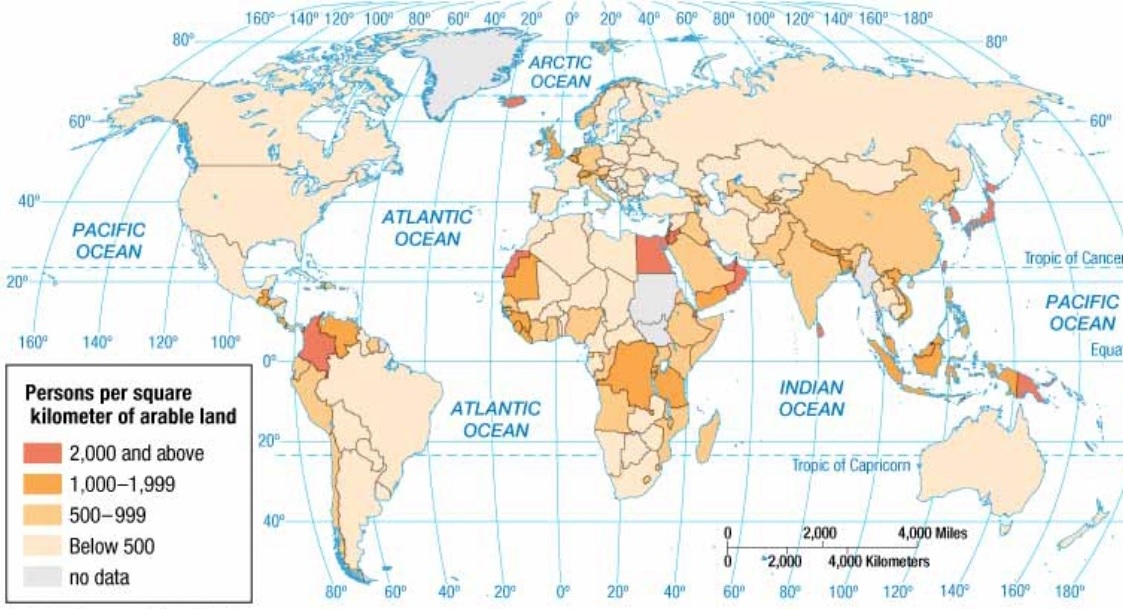
Physiological Density
The average number of people per unit area (square mile or kilometer) of arable land
Helps understand how densely populated an area is relative to its agricultural capacity, highlighting pressures on food production and land use
Higher the number = more strain on the land to produce food for the population
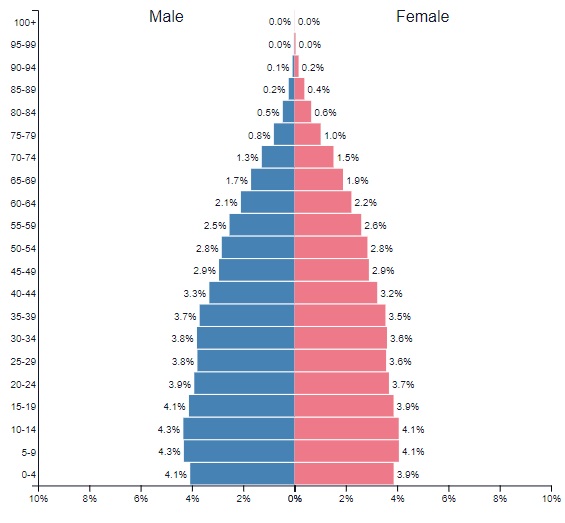
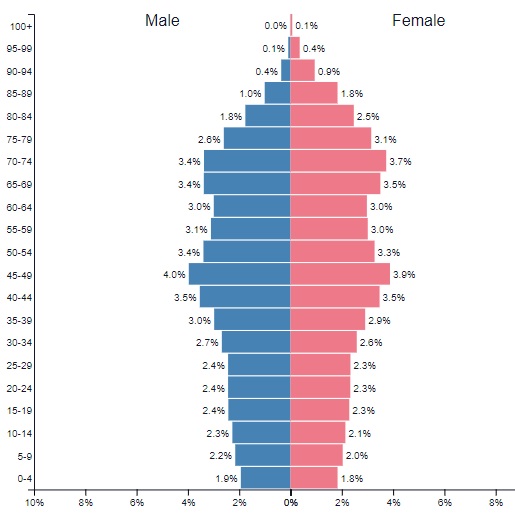
Population Pyramid
Graphical representation of the distribution of a population by age and sex
Focus on differences between male/female or the THREE different age groups (0-15) (65 and older) - It typically illustrates the proportion of dependents (ages 0-15 and 65+) versus the working-age population (ages 16-64), highlighting demographic trends.

Pronatalist policies
Government actions or societal norms that encourage or promote population growth by increasing the birth rate or fertility rate of an area
Usually implemented by MDCs (core)
Rate of Natural Increase (RNI)
Key demographic metric that measures the population growth or decline in a region, excluding the impact of migration
Typically higher in LDCs (periphery) and lower in MDCs (core)
Formula - CBR-CDR/10
Sex Ratio
The number of men to the number of women in a population
Total Fertility Rate (TFR)
The average number of children born per women during her reproductive lifetime, considered to be from 15 to 49 years of age
Typically higher in LDCs (periphery) and lower in MDCs (core)
Key indicator of population growth or decline

Human Factors - Population Distribution
Culture, economics, history, and politics influence where population settle
Physical Factors - Population Distribution
Climate, landforms, and water bodies influence where population settle
People tend NOT to settle in areas that are TOO dry, cold, wet, high
Immigration Policy
Government policies that can promote or discourage population growth by increasing or decreasing migration
Mortality Rate
Measure of deaths within a specific population, usually expressed as the number of deaths per 1,000 people per year
NO direct connection with development!!
Population Distribution
Pattern where people live (clustered/dispersed, density, and pattern)
Scale of Analysis
The geographical area or level of organization used to study and analyze data:
Global: Encompasses the entire world and ignores borders of countries
Regional: Focuses on large geographic areas or regions (e.g., West Africa, North America)
National: Focuses on a single country (France, Japan, Botswana)
Local: Focuses on a specific location within a country (e.g., a city, state, province).
Infant Mortality Rate
Number of deaths of infants under one year of age per 1,000 live births in a given year
Key indicator of a country's access to healthcare and overall development. A high IMR often suggests limited access to medical care and sanitation for infants and mothers, while a low IMR indicates better healthcare infrastructure and access to life-saving interventions
Replacement Rate
Total fertility rate (TFR) needed for a population to maintain its size over time
A TFR of 2.1 children per woman is generally considered the replacement level, as it accounts for the fact that not all children survive to reproductive age, and there's a slightly higher number of males born than females
Youth Dependency Ratio
Demographic indicator that compares the number of people under 15 years old (children) to the number of people in their working-age (typically 15-64 years old)
Helps to assess the economic burden on the working-age population by indicating how many dependents there are for every working adult. A high ratio suggests greater dependency and potential strain on resources.
Elderly Dependency Ratio
Demographic measure that compares the number of elderly individuals (typically those aged 65 and older) to the number of people in the working-age population (typically those aged 15-64)
Reflects the burden placed on the working population by supporting the elderly through social security, pensions, and healthcare