Algebra II Final
1/60
There's no tags or description
Looks like no tags are added yet.
Name | Mastery | Learn | Test | Matching | Spaced |
|---|
No study sessions yet.
61 Terms
Slope Intercept Form
of an equation of a line is y= mx + b, where m is the slope and b is the intercept.
Point Slope Form
y-y1 = m(x-x1) where (x1,y1) is a given point on a non vertical line and m is the slope of the line.
Parallel
if and only if they have the same slope.
Perpendicular Lines
if and only if the product of the slope is -1
Bivariate Data
data consisting of pairs of values
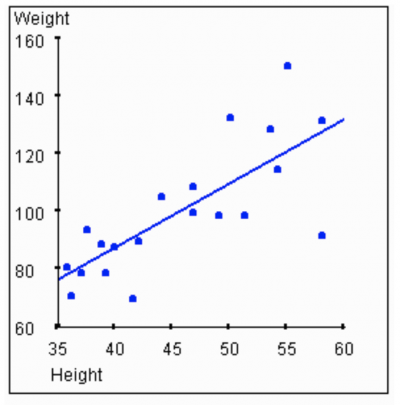
Scatter plot
a set of data graphed as ordered pairs in a coordinate plane.
Dot plot
two sets of data plotted as rodered pairs in a coordinate plane.
Positive Corrleation
when the values in a scatter plot are closely linked positively.
Negative correlation
when the values in a scatter plot are closely linked in a negative correlation.
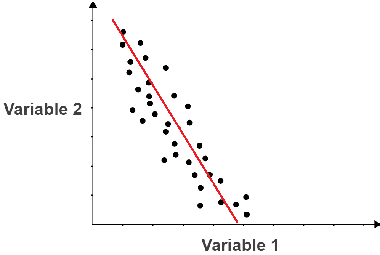
Line of fit
a line that closely approximates a set of data.
Prediction equation
an equation suggested by the points of a scatter plot to predict other points.
Regression line
line of best fit
Correlation coefficient
a measure that shows how well data are modeled by a linear equation.
Very weak
0.01 - 0.20
Weak
0.21 - 0.40
Moderate
0.41 - 0.60
Strong
0.61 - 0.80
Very Strong
0.80 - 0.99
Piecewise-defined function
a function that is written using two or more expressions.
Piecewise-linear function
contains a single expression.
Step function
consists of line segments.
Greatest integer function
written as f(x) = [[x]], is a step function.
Absolute value function
a function written as f(x) = |x|, where f(x) = x if x > 0, 0 if x = 0 for -x if x < 0.
Family of Graphs
is a group of graphs that display one or more similar characteristics.
Parent Graph (Parent Function)
is the simplest form of the graph in the family.
Translation
Moves a figure up, down, left, right.
Dialtion
stretches or compresses the graph.
Reflection
flipping over the x-axis or the y-axis.
Linear Inequality
is a mathematical statement that compares two linear expressions using inequality symbols.
Boundary
a line or curve that separates the coordinate plane into two regions.
The break-even point
is the point at which x = y.
Systems of equations
two or more equations with the same variables.
Constant
when the system of equations has at least one solution.
Inconsistent
when the system of equations has no solution.
Dependent
when the system has exactly one solution.
Independent
when the system has exactly one solution.
Substitution method
a method used to solve a system of equations in which one equation is solved for one variable in terms of the other.
Elimination method
eliminate one of the variables in a system of equations by adding or subtracting the equation.
Consistent Independent, one solution, intersect at 1 point
Identify whether it is inconsistent, consistent independent, or consistent dependent
Inconsistent, no solution, parallel lines
Identify whether it is inconsistent, consistent independent, or consistent dependent
Consistent dependent, infinite solutions, same line
Identify whether it is inconsistent, consistent independent, or consistent dependent
System of Inequalities
a set of inequalities with the same variables. It means finding the ordered pairs that satisfy all of the inequalites in the system.
Positive number
are those which are greater than 0 (>0)
Negative numbers
are those that are less than zero (<0)
Quadratic function
function described by the equation f(x) = ax2 + bx + c, ax2 is the _________________.
Linear term
in the equation f(x) = ax2 + by + c, by is the __________________.
Constant term
in the equation f(x) = ax2 + bx + c, c is the constant term.
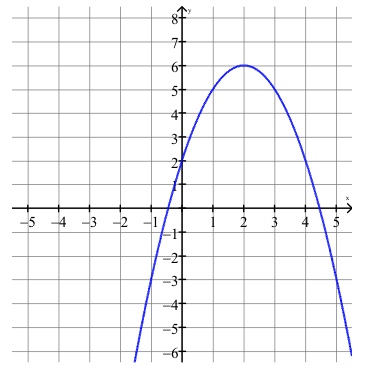
Parabola
the graph of a quadratic function. The set of all points in a plane that are the same distance from a given point is called the focus and a given line is called the vertex.
Axis of symmetry
a line about which a figure is symmetric.
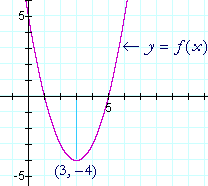
Vertex
the point at which the axis of symmetry intersects a parabola.
Maximum value
the y-coordinate of the vertex of the quadratic function f(x) = ax2 + bx + c, where n < 0.
Minimum value
the y-coordinate of the vertex of the quadratic function f(x) = ax2 + bx + c where n > 0
Quadratic Equation
are quadratic functions that are set equation to a value.
Standard Form
ax2 + bx + c = 0, where a is not equal to zero and a, b, and c are integers.
Roots
the solutions of a quadratic equation that crosses the x-axis by how many times, the point where the parabola crosses the x-axis.
Zeros
of a function are the x-intercepts of its graph.
Foil Factors
distribute properly to multiply binomials.
Imaginary unit
defined by i2= -1. The number i is the principal square root of -1 that is i = √-1
Pure imaginary numbers
the square roots of negative real numbers.
Complex numbers
are any numbers that can be written in the form of bi, where a and b are real numbers, and i is the imaginary unit. a is called the real part, and b is called the imaginary part.
Complex conjugates
are two complex numbers of a + bi and a - bi. The product of complex conjecugates is always a real number.