Methods Week 9 - Literature Synthesis (1/2)
1/17
There's no tags or description
Looks like no tags are added yet.
Name | Mastery | Learn | Test | Matching | Spaced |
|---|
No study sessions yet.
18 Terms
empirical research study
when a researcher systematically collects empirical evidence to make evidence-based conclusions
literature review
an overview and and an evaluation of the current state of knowledge about a specific area of research (doesn’t analyze the data)
meta-analysis
a technique for averaging the statistical results of multiple studies to examine the overall effect size.
why are meta-analyses important
replicability
efficacy
confound
increases Power
gaps in the literature
step 1. problem formulation of meta-analysis
what are the variables or interventions the researchers wanted to study? Operationalization? examine what research evidence the researchers claim is relevant.
find studies that use the same measure to analyze their data
step 2. searching the literature
keywords
search terms (what you put in google scholar to find this information)
backward (see what papers that paper sited and look at those) vs. forward citations (look at all the papers that cited your original paper)
gathering information and evaluate the study
theory, methods, results
coders: recruited to extract information from articles
if coders disagree, then go to supervisor to make the final discussion
how many papers are usually in a meta analysis?
10-40
step 4. analyze outcome of studies
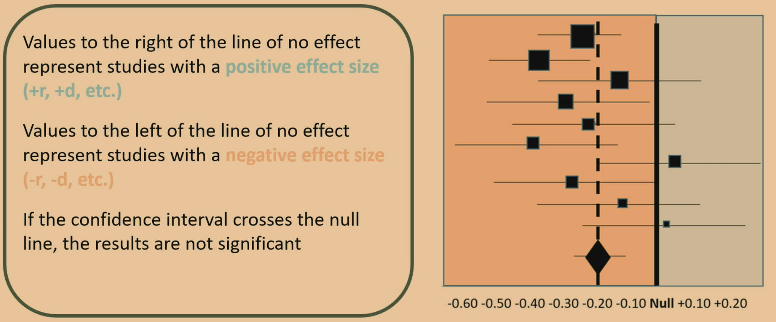
forest plots
forest plots
size of the square represents the sample size (which is better bc they matter way more)
diamond is the meta-analysis effect size
horizontal lines are the CI’s
if contains 0 then results are unreliable/insignificant
null solid line defines the null hypothesis
if diamond is on the left, the correlation is negative so long as it doesn’t cross the null line
step 5. present the results
make figures, put in paper, write paper, publish
meta-analysis elements
cohen’s d (if your comparing A and B - not the variable that would be correlation)
hedges’ g
exact same as cohen’s d, it quantifies the difference between two groups, but it takes into account the sample size better
better for meta-analysis because the sample sizes are going to be very varying
how to weigh each study
by sample size or inverse variance (how precise your data)
calculated from the sample size
how to average the weighted effect sizes
multiply the numbers by the weight distribution
if the number is representative of a sample size that has 10x more pf a sample size than the other, then you would be able to multiple your number by (0.9) and the other number by (0.1) then you will get a more representative average of your effect size. Idk watch the lecture girl
HoV
heterogeneity (I²) describles the amount of variablility among the studies
25% = low
50% = medium
75%= high
what are Q statistics and I² used for?
to measure heterogeneity in a meta-analysis
fixed effect approach: all studies capture the same effect (like if your data all comes form the same area) - high heterogeneity
remove outliers if you don’t want high heterogeneity
random effect approach: not all studies are capturing the same effect
fail safe N
number of unpublished, non-significant studies which would have to exist in researchers’ filing cabinets in order to render the meta-analysis non-significant.