AP Statistics 1.1 Summer Assignment Quiz
1/21
Earn XP
Description and Tags
statistics
Name | Mastery | Learn | Test | Matching | Spaced |
|---|
No study sessions yet.
22 Terms
Categorical Variables
A variable that can take on one of a limited, and usually fixed, number of possible values, and assign it to a group.
Categorical Variable Examples
Colors, Ice Cream Flavor
Quantitative Variables
A variable that can take an infinite amount of different variables that differ from other results.
Quantitative Variable Examples
Height, Death count
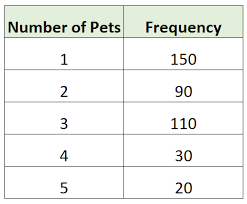
Frequency Table
Table that shows the distribution of observations based on the options in a variable.

Relative Frequency Table
A chart that shows the popularity of a certain type of data based on the population sampled.

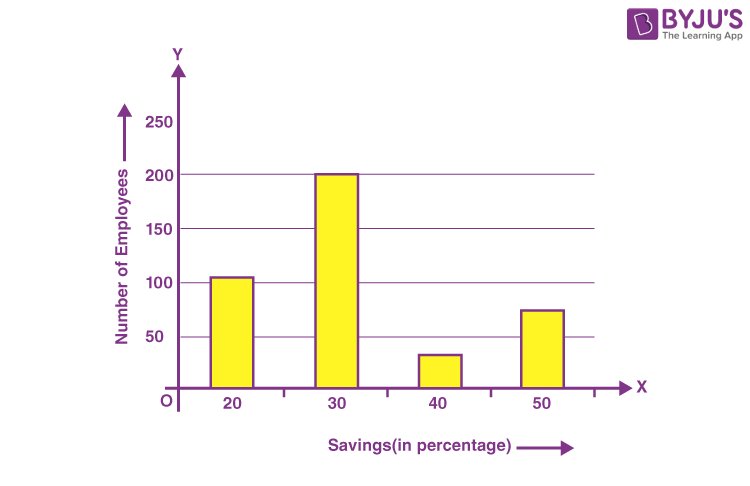
Bar Graph
A diagram in which the numerical values of variables are represented by the height or length of lines or rectangles of equal width.

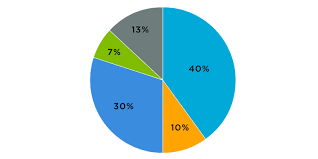
Pie Chart
Shows each category as a slice of the "pie." The areas of the slices are proportional to the category frequencies or relative frequencies.
