AP Stats - Vocab Quiz 2 (1D-E)
 Call Kai
 Learn
Learn Practice Test
 Spaced Repetition
 Match
Match Flashcards
 Knowt Play
1/14

Earn XP
Description and Tags
Quiz on 08/28 aka Friday!
Name | Mastery | Learn | Test | Matching | Spaced | Call with Kai | Chat |
|---|
No analytics yet
Send a link to your students to track their progress
15 Terms
Median
the midpoint of a distribution of quantitative data—the number such that about half the observations are smaller and about half are larger.
Mean
the average of all the individual data values
Resistant
A statistical measure not affected much by extreme data values.
Range
the distance between the minimum value and the maximum value.
Standard deviation (s)
measures the typical distance of the values in a distribution from the mean. It is calculated by finding an “average” of the squared deviations of the individual data values from the mean, and then taking the square root.
quartiles
divide an ordered data set into four groups having roughly the same number of values
first quartile (Q1)
he median of the data values that are to the left of the median in the ordered list.
Third quartile (Q3)
he median of the data values that are to the right of the median in the ordered list.
Interquartile range (IQR)
the distance between the first and third quartiles of a distribution of quantitative data
The 1.5 x IQR Rule
An observation is called an outlier if it falls more than 1.5 x IQR above the third quartile or more than 1.5 x IQR below the first quartile.
Five-number summary
consists of the minimum, the first quartile (Q1), the median, the third quartile (Q3), and the maximum.
Boxplot
A visual representation of the five-number summary of a distribution of quantitative data. The box spans the quartiles and shows the variability of the middle half of the distribution. The median is marked with a vertical line segment in the box. Lines extend from the ends of the box to the smallest and largest observations that are not outliers. Outliers are marked with a special symbol such as an asterisk (*)
Percentile
the value with p% of observations less than or equal to it.
Standardized value (z-score)
for an individual value in a distribution of quantitative data tells us how many standard deviations from the mean the value falls, and in which direction.
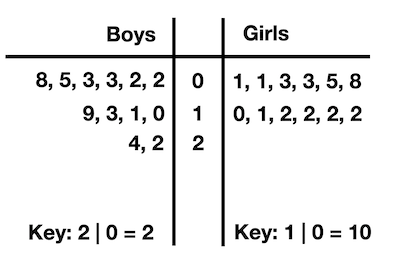
Back-to-back stemplot
a type of stem-and-leaf plot used to compare two groups of quantitative (numerical) data by sharing a single column of stems in the center, with one group’s leaves extending to the left and the other group’s leaves extending to the right