ECON 151/151G
0.0(0)
Studied by 1 personCard Sorting
1/50
Earn XP
Description and Tags
Last updated 10:33 AM on 9/16/22
Name | Mastery | Learn | Test | Matching | Spaced | Call with Kai | Chat |
|---|
No analytics yet
Send a link to your students to track their progress
51 Terms
1
New cards
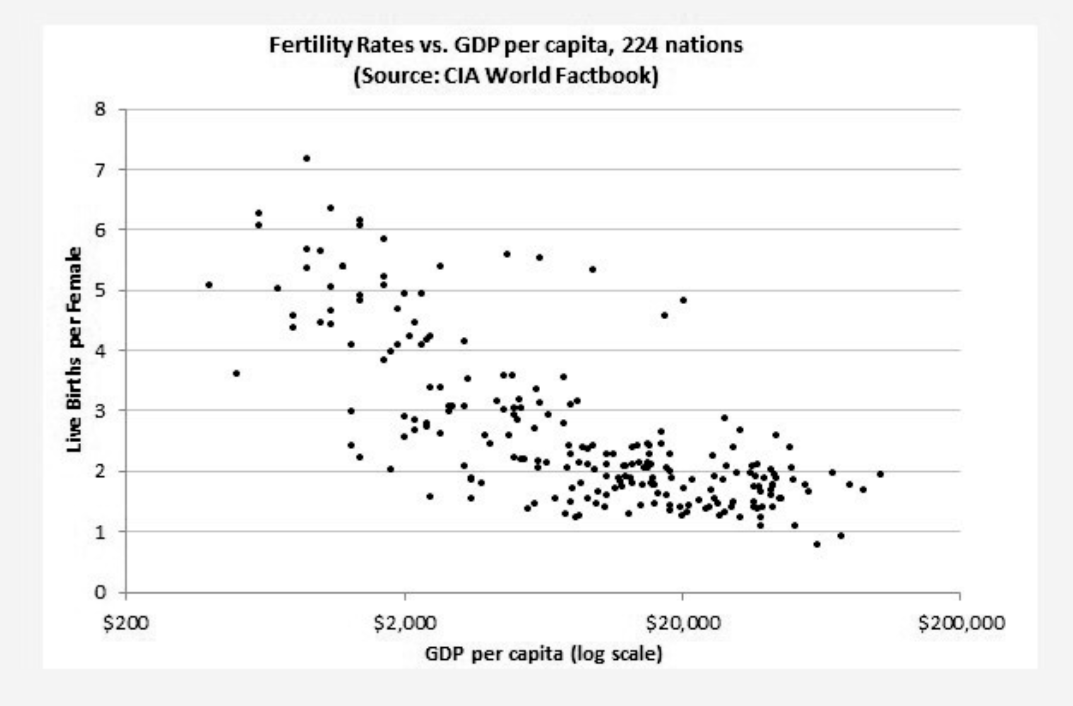
NZD GDP
- Small due to population size
- Countries with higher GDP have higher purchasing power
- Countries with higher GDP have higher purchasing power
2
New cards
Purchasing Power
- Ability to buy things
3
New cards
Less children in richer countries
- Less children => less costs => higher quality of life
Children can receive the best education and support
- People are wanting more qualifications => more studying and working much harder. Less time for children
Children can receive the best education and support
- People are wanting more qualifications => more studying and working much harder. Less time for children
4
New cards
Opportunity cost
- Value of an activity/goods/service given up in order to get something else
- Not all needs can be satisfied
- Everything is scarce
- Choices have to be made
- Value of the next best alternative
- Not all needs can be satisfied
- Everything is scarce
- Choices have to be made
- Value of the next best alternative
5
New cards
Low birth rates
- When the population becomes "older" on average (fewer young people)
- Retirement benefit comes from taxes
- Not enough young people => not enough salary/tax for benefit
- Raises retirement age
- Retirement benefit comes from taxes
- Not enough young people => not enough salary/tax for benefit
- Raises retirement age
6
New cards
Cost-Benefit Principle (Marginalism)
- Take an action if and only if the extra benefits are at least as great as the extra cost
- Costs and benefits are not just money
- Costs and benefits are not just money
7
New cards
Marginal Cost
- Increase in total cost from one addition unit of activity
8
New cards
Marginal Benefit
- Increase in total benefit from one additional unit of activity
9
New cards
Sunk costs
- Cannot be recovered
Examples: time, paying for something you don't like
Examples: time, paying for something you don't like
10
New cards
Correlation vs Causation
- If two things go together, it does not mean one causes the other
- Sometimes the correlations are purely coincidental
- Sometimes the correlations are purely coincidental
11
New cards
Correlation
- Relation between two things
12
New cards
Causation
- One thing makes another thing happen
13
New cards
Ceteris Paribus
- When looking at an effect of X on Y, only look at what happens to Y when X changes and everything else is constant
- ONLY CHANGE ON THING AT A TIME
- ONLY CHANGE ON THING AT A TIME
14
New cards
Occam's Razor
- Make as few assumptions or involve as few other variables as possible
15
New cards
Role of assumptions
- Models are simplifications of reality, making simplifying assumptions
- Real world is too complex, need models which focus on important part of reality
- Real world is too complex, need models which focus on important part of reality
16
New cards
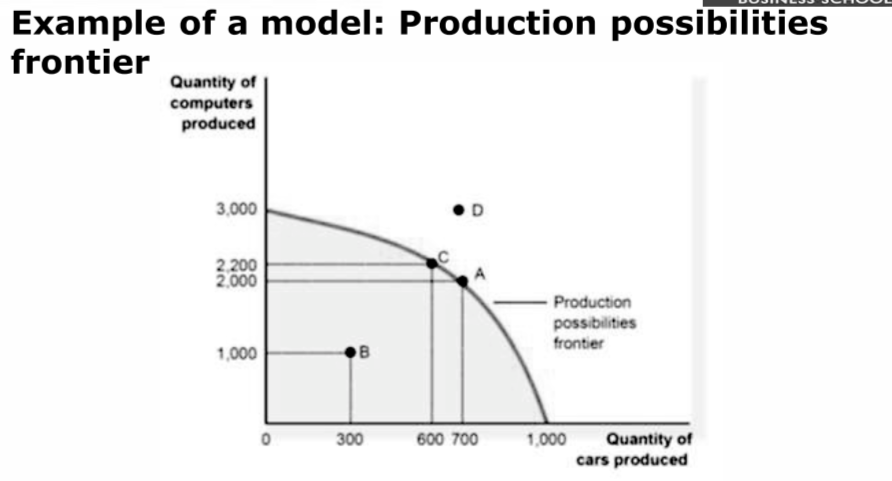
Production Possibilities Frontier (PPF)
- A graph that shows various combinations of output that the economy can possibly product given the available factors of production and the available production technology
- Simplifying assumption: economy produces only two goods
- An economy producing on the PPF is efficient
- Graph shows tradesoffs (produce more of one good and less both the other)
Example:
- Cannot produce outside the graph
- Point D is impossible (not enough resources)
- Point B is not utilising all resources
- Point C/A are ideal points, pick either more computers or more cars produced
17
New cards
Interdependence
- Relying on others to produce what we consume, which requires trade
18
New cards
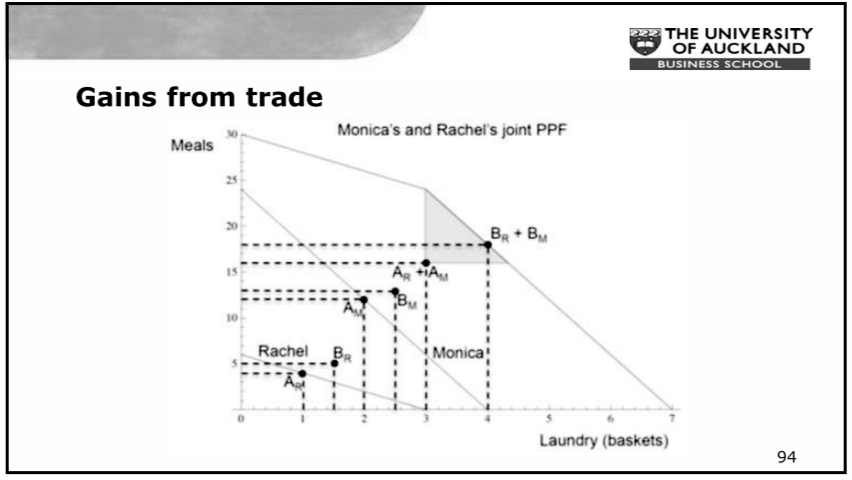
Grains from trade
- Leave the specialist to do the things
- Get the best quality item for the best price
- Get the best quality item for the best price
19
New cards
Absolute Advantage (AA)
The comparison among producers of a good according to their productivity
- held by producer who can produce the good using the least amount of resources in absolute terms
- held by producer who can produce the good using the least amount of resources in absolute terms
20
New cards
Comparative Advantage (CA)
The comparison among producers of a good according to their opportunity cost
- held by the producer who can produce it at the lowest opportunity cost (this is what economy uses!)
- held by the producer who can produce it at the lowest opportunity cost (this is what economy uses!)
21
New cards
Gains from Trade - Application
- Combine both trader's PPF to find who should make how many
22
New cards
Topic 2
Topic 2 - Demand, supply, and market equilibrium
23
New cards
Market Equilibrium
- Equilibrium may change if demand and/or supply changes
24
New cards
Demand
- Consumers wanting to buy
25
New cards
Supply
- Sellers want to sell
26
New cards
Elastic
- Sensitive to price
- Will make a decision depending on the price
- Will make a decision depending on the price
27
New cards
Inelastic
Insensitive to price
- Will pay for given price (e.g. gas)
- Will pay for given price (e.g. gas)
28
New cards
Market
- A group of buyers and sellers of a particular good or service
- Buys determine demand
- Sellers determine Supply
- Can be real (shopping centres) or online (TradeMe/NZ Stock Exchange)
- Buys determine demand
- Sellers determine Supply
- Can be real (shopping centres) or online (TradeMe/NZ Stock Exchange)
29
New cards
Market Price
- Exchange goods and services for money
- Tells us how many dollars we receive per unit sold and how much $ we must give up per unit bought
- Assume people are "price-takers" (cannot negotiate price)
- Tells us how many dollars we receive per unit sold and how much $ we must give up per unit bought
- Assume people are "price-takers" (cannot negotiate price)
30
New cards
Quantity Demanded
Amount of a good that buyers are willing and able to purchase at every price
31
New cards
Determinants of Demand
Consumer Income - ability to pay
Prices of related goods - willingness to pay
Substitutes - Cook and Pepsi, Driving vs taking the bus
Complements - hamburgers and burger buns, cars and tyres
Tastes - willingness to pay; how much you value the good
Prices of related goods - willingness to pay
Substitutes - Cook and Pepsi, Driving vs taking the bus
Complements - hamburgers and burger buns, cars and tyres
Tastes - willingness to pay; how much you value the good
32
New cards
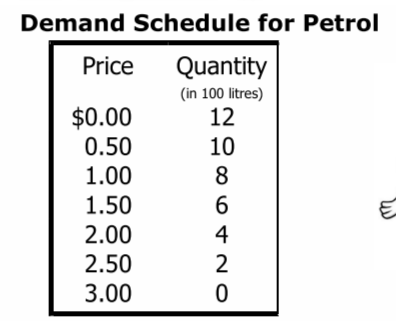
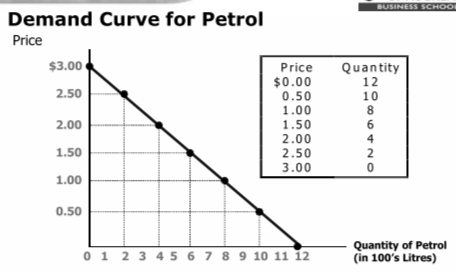
Law of Demand
- states there is an inverse relationship between price and quantity demanded
- demand schedule is a table that shows the relationship between price of a good and quantity demanded
- demand schedule is a table that shows the relationship between price of a good and quantity demanded
33
New cards
Demand Curve
- Downward sloping line relating to price and quantity demanded
Downwards because:
- lower prices imply a greater quantity demanded
- diminishing marginal benefit (consume more of the same good, less happiness from extra units)
- opportunity cost
- income effect (prices go up, have less money to spend on everything and buy less goods)
- substitutions effect
Downwards because:
- lower prices imply a greater quantity demanded
- diminishing marginal benefit (consume more of the same good, less happiness from extra units)
- opportunity cost
- income effect (prices go up, have less money to spend on everything and buy less goods)
- substitutions effect
34
New cards
Ceteris Paribus
- All variables other than the ones being studied are assumed to be constant
- Demand curve slopes downward because lower prices imply greater quantity demanded
- Demand curve slopes downward because lower prices imply greater quantity demanded
35
New cards
Linear Demand curve
- The demand curve is most likely not linear but it is possible to approximate using a straight line
- Makes calculations easier
- Makes calculations easier
36
New cards
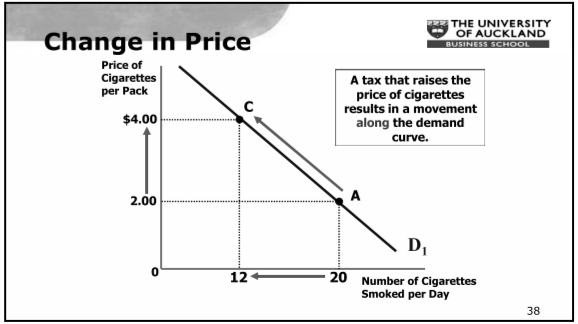
Change in Quantity Demanded
- Movement along the demand curve
- Caused by a change in price of a product
- Caused by a change in price of a product
37
New cards
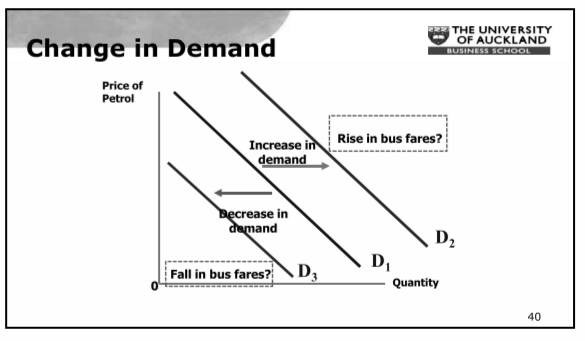
Change in Demand
- A shift in the demand curve, either to the left (decrease) or right (increase)
- Caused by a change in a determinant other than price
- Increase of consumer income will cause an increase in demand
- Caused by a change in a determinant other than price
- Increase of consumer income will cause an increase in demand
38
New cards
Substitutes and Complements
- When a fall in price of one good reduces the demand for another good, the two goods are substitutes
- When a fall in price of one good increases the demand for another good, the two goods are complements
- When a fall in price of one good increases the demand for another good, the two goods are complements
39
New cards
Rule of Thumb
- If the thing changes is one of the axis labels it will cause a MOVEMENT ALONG the curve
- If the thing that changes is not on the axis labels it will cause a SHIFT of the WHOLE CURVE
- If the thing that changes is not on the axis labels it will cause a SHIFT of the WHOLE CURVE
40
New cards
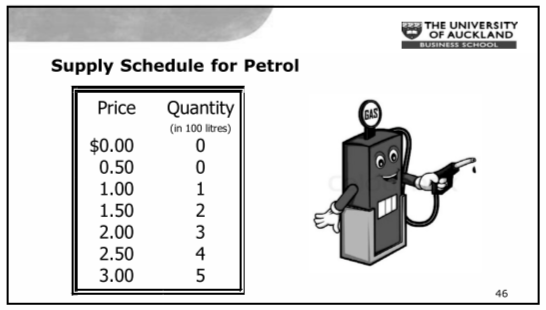
Supply
- Relationship between prices and quantity a firm can put on the market
- Technology and costs of production are major factors
- Law of Supply states that there is a positive relationship between price and quantity supplied
- Technology and costs of production are major factors
- Law of Supply states that there is a positive relationship between price and quantity supplied
41
New cards
Supply Schedule/Curve
- Upward sloping line relating price to the quantity supplied
Why:
- Market price is higher than the production price.
Why:
- Market price is higher than the production price.
42
New cards
Supply Determinants
- Cost of production
- Number of suppliers
- Technology
- Envrionment
- Number of suppliers
- Technology
- Envrionment
43
New cards
Change in Quantity Supplied
- Movement along the supply curve
- Caused by a change in market price of the product
- Caused by a change in market price of the product
44
New cards
Change in Supply
- A shift in the supply curve to the left (decrease) or right (increase)
- Cause by a change in determinant other than price
- Cause by a change in determinant other than price
45
New cards
Equilibrium Price
- The price that balances supply and demand. On graph the price at which supply and demand intersect.
- Sometimes called the Market clearing price
- Sometimes called the Market clearing price
46
New cards
Equilibrium Quantity
- The quantity that balances supply and demand. On graph its the quantity at which demand and supply intersects
47
New cards
Market Equilibrium
- Quantity demanded by consumers = quantity supplied by producers
- No tendency for market to move away from a stable equilibrium
- No tendency for market to move away from a stable equilibrium
48
New cards
Market Adjustment
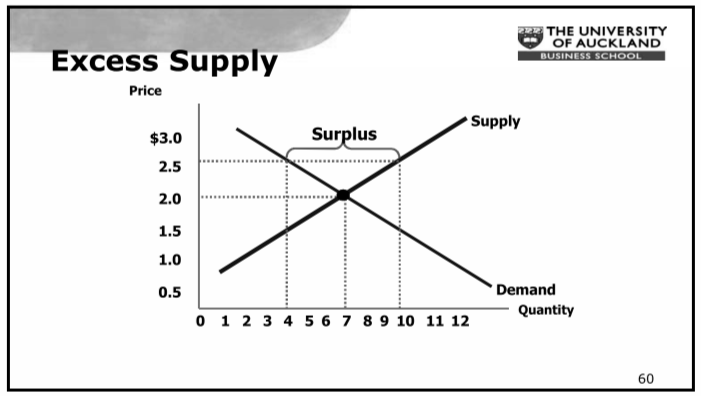
- Excess Supply (surplus) Qs>Qd
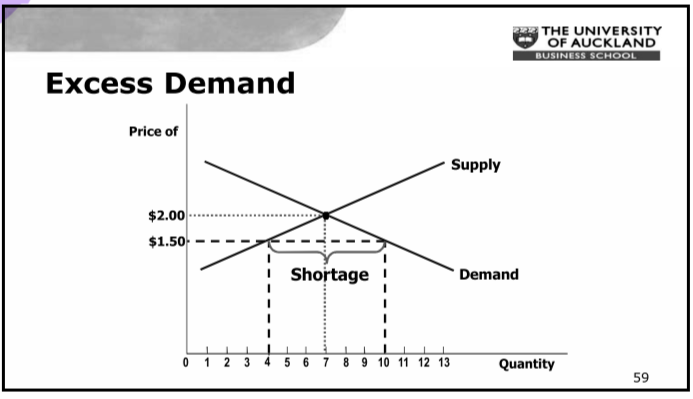
- Excess Demand (shortage) Qs<Qd
- Market forces will cause prices to adjust
- Excess Demand (shortage) Qs<Qd
- Market forces will cause prices to adjust
49
New cards
Excess Demand
50
New cards
Excess Supply
51
New cards
Page 91