Economics
1/79
There's no tags or description
Looks like no tags are added yet.
Name | Mastery | Learn | Test | Matching | Spaced | Call with Kai |
|---|
No analytics yet
Send a link to your students to track their progress
80 Terms
Choice
means to face scarcity
Incentive
to promote goods actions or actions with negative effects. Reward or penalty
Scarcity
Inability to have everything
Microeconomics
Choices of individuals and businesses
Market
Individuals
Government
Business
Macroeconomics
Performance of the national and global economy
Global
National
Goods and services
What?
How?
For whom?
What?
Changes and varieties | Determinantes? ex. what determinates what we produce
How?
Factors of production
For whom?
Consumers
Factors of Production
Labor (workers)
Land
Capital
Entrepeneurship
Labor (workers)
wages
human capital
skills, jobs
Land
rent
natural resources
oil, gas, coal, water
Capital
Interests
tools that help you produce
material goods (may be rented)
Entrepeneurship
profits
the ideal/vision
human resource that organizes labor, land, and capital
Can self-interest promote social interest?
self-interest= best choice available for you
social-interest=efficiency, best for society, fairness
*how can we align both even when it seems not possible
Economic thinking (consumption)

Social Science
Statements:
Normative:
what should be
values
how life or things should be based on values
Positive:
What is
Test
Cause vs. Effect
Models
Economics
the study of choices and its consequences
Efficient Resource Allocation
Economies must decide the best way to allocate their scarce resources to meet the needs and wants of their population
PPF (Production possibilities frontier)
Represents the production boundaries of an economy (scarcity)
2 goods
cetris paribus
Efficiency
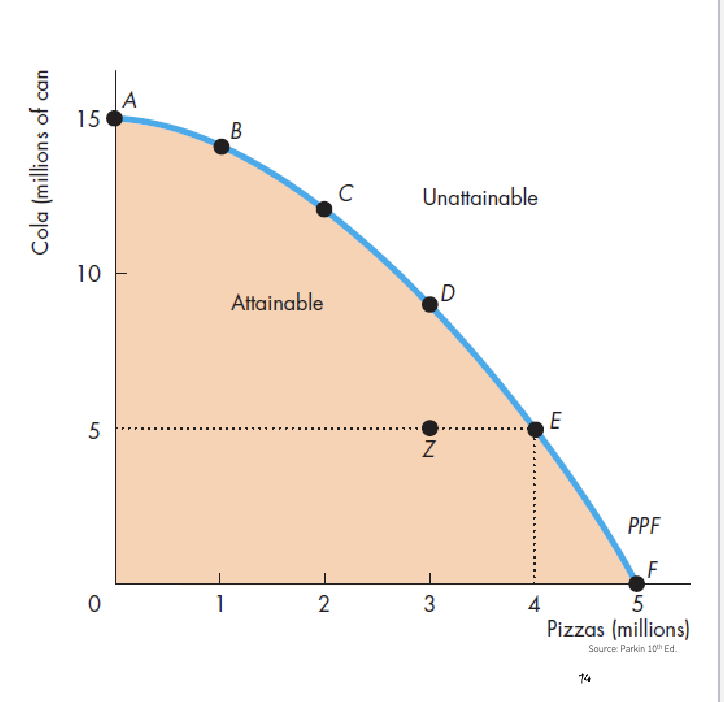
PPF efficiency
Misallocated:
not best match
skills
Unused:
Idle
Unemployment
Production efficiency: lowest cost
Inefficient production
Tradeoffs = opportunity cost
Highest value alternative
Opportunity cost
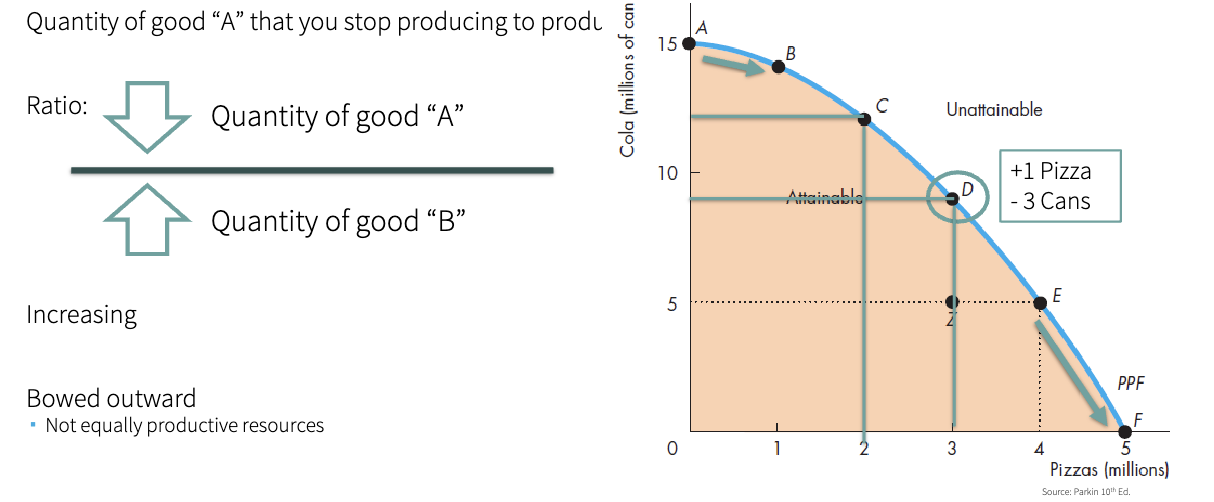
PPF
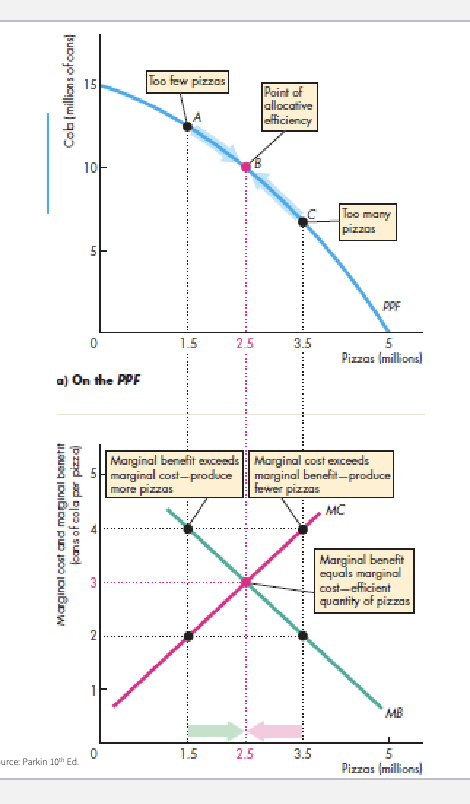
which is the most efficient point?
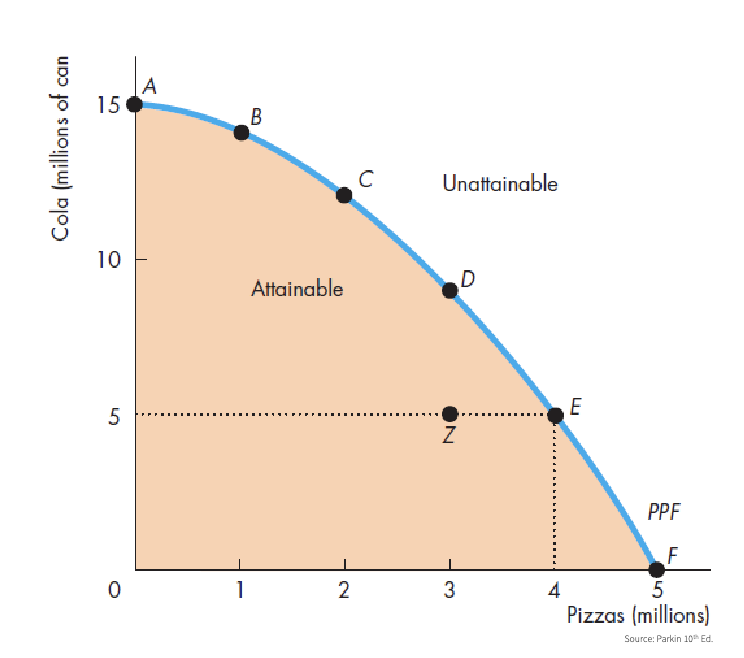
Efficiency
Production: lowest possible cost
Allocative: lowest possible cost, quanitites that provide the most benefit
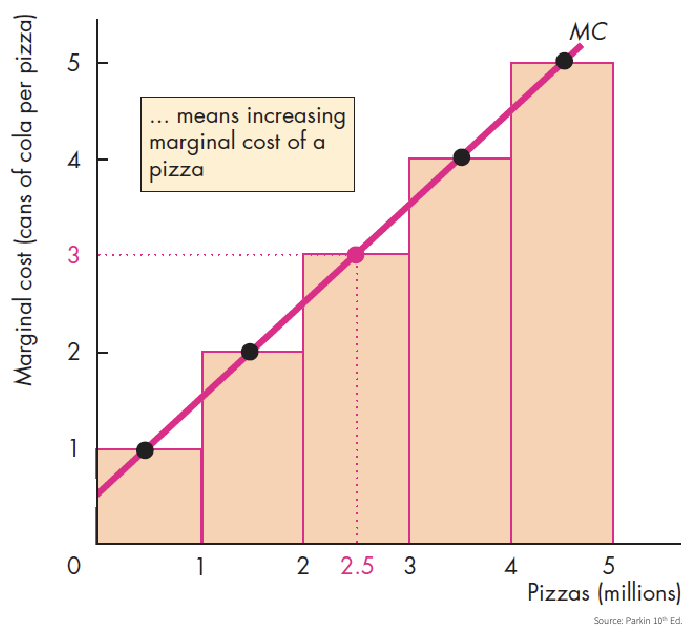
Marginal Cost (MC)
Cost of producing ONE more unit
Refers to how much the cost changes
Opportunity cost is not constant
Is the slope
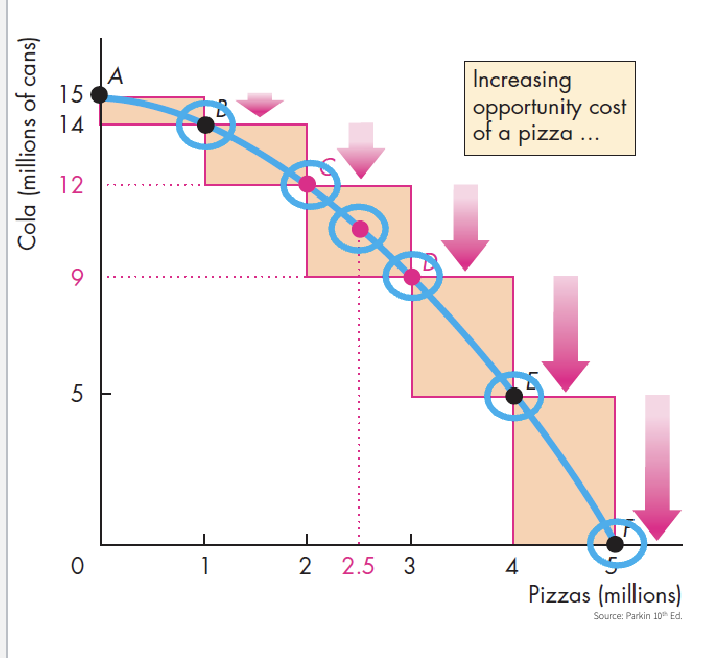
Marginal Cost Curve - MC
the results of calculating the slope
costo marginal de un bien en cada cantidad a lo largo de la FPP
Marginal Benefit
Benefit of consuming ONE more unit
Measure: the most that people are willing to pay for ONE more unit
Quantity: of other services & goods that you give up
Preferences: want -like
Decreasing marginal benefit: why?
Allocative Efficiency
PPF
Any point = tradeoff (intercambio)
Best point: tradeoff of a good that provides a greater benefit
Economic Growth
Expand production possibilities
living standards
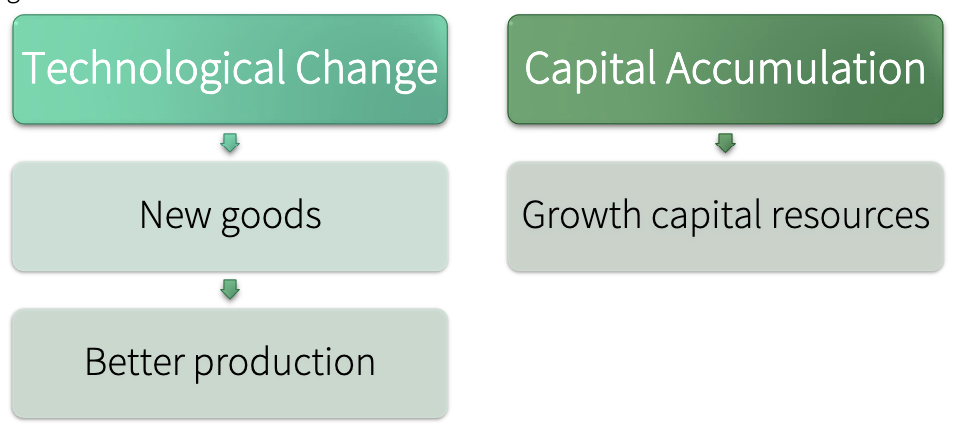
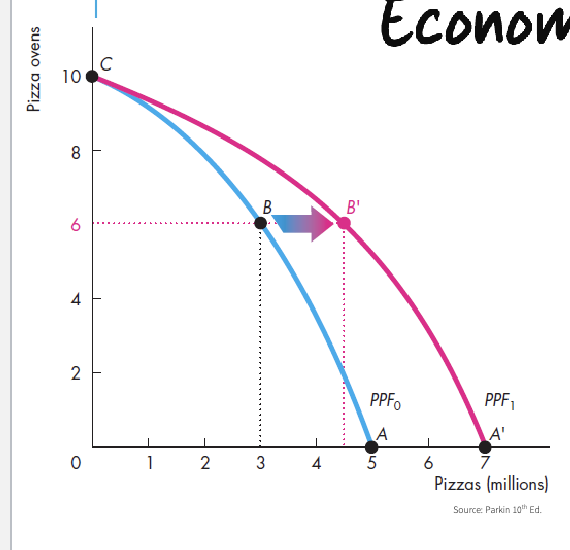
Economic Growth & the PPF
If we develop new technologies and accumulate capital:
Increase consumption in the future
Disminuye la producción actual de bienes y servicios
Opportunity cost: decrease in today’s consumption
Opportunity cost
of an action is the highest-valued alternative
Advantages:
Comparative:
lowest opportunity cost
abilities and resources
in terms of another good
Absolute
highest productivity
per hour
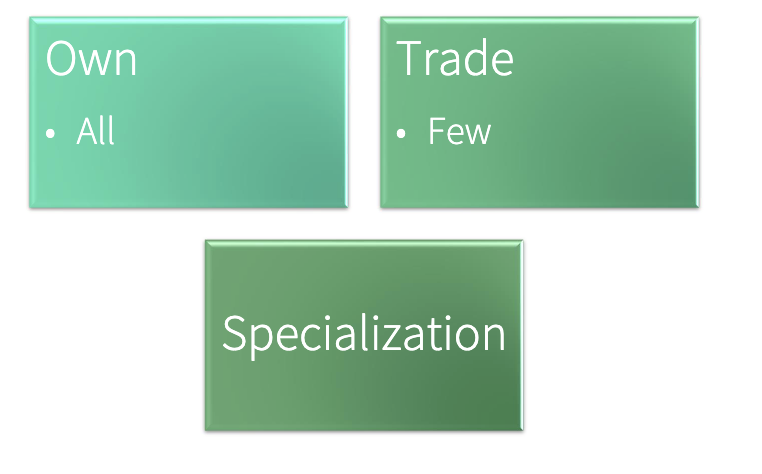
Relative price
The ratio of one price to another
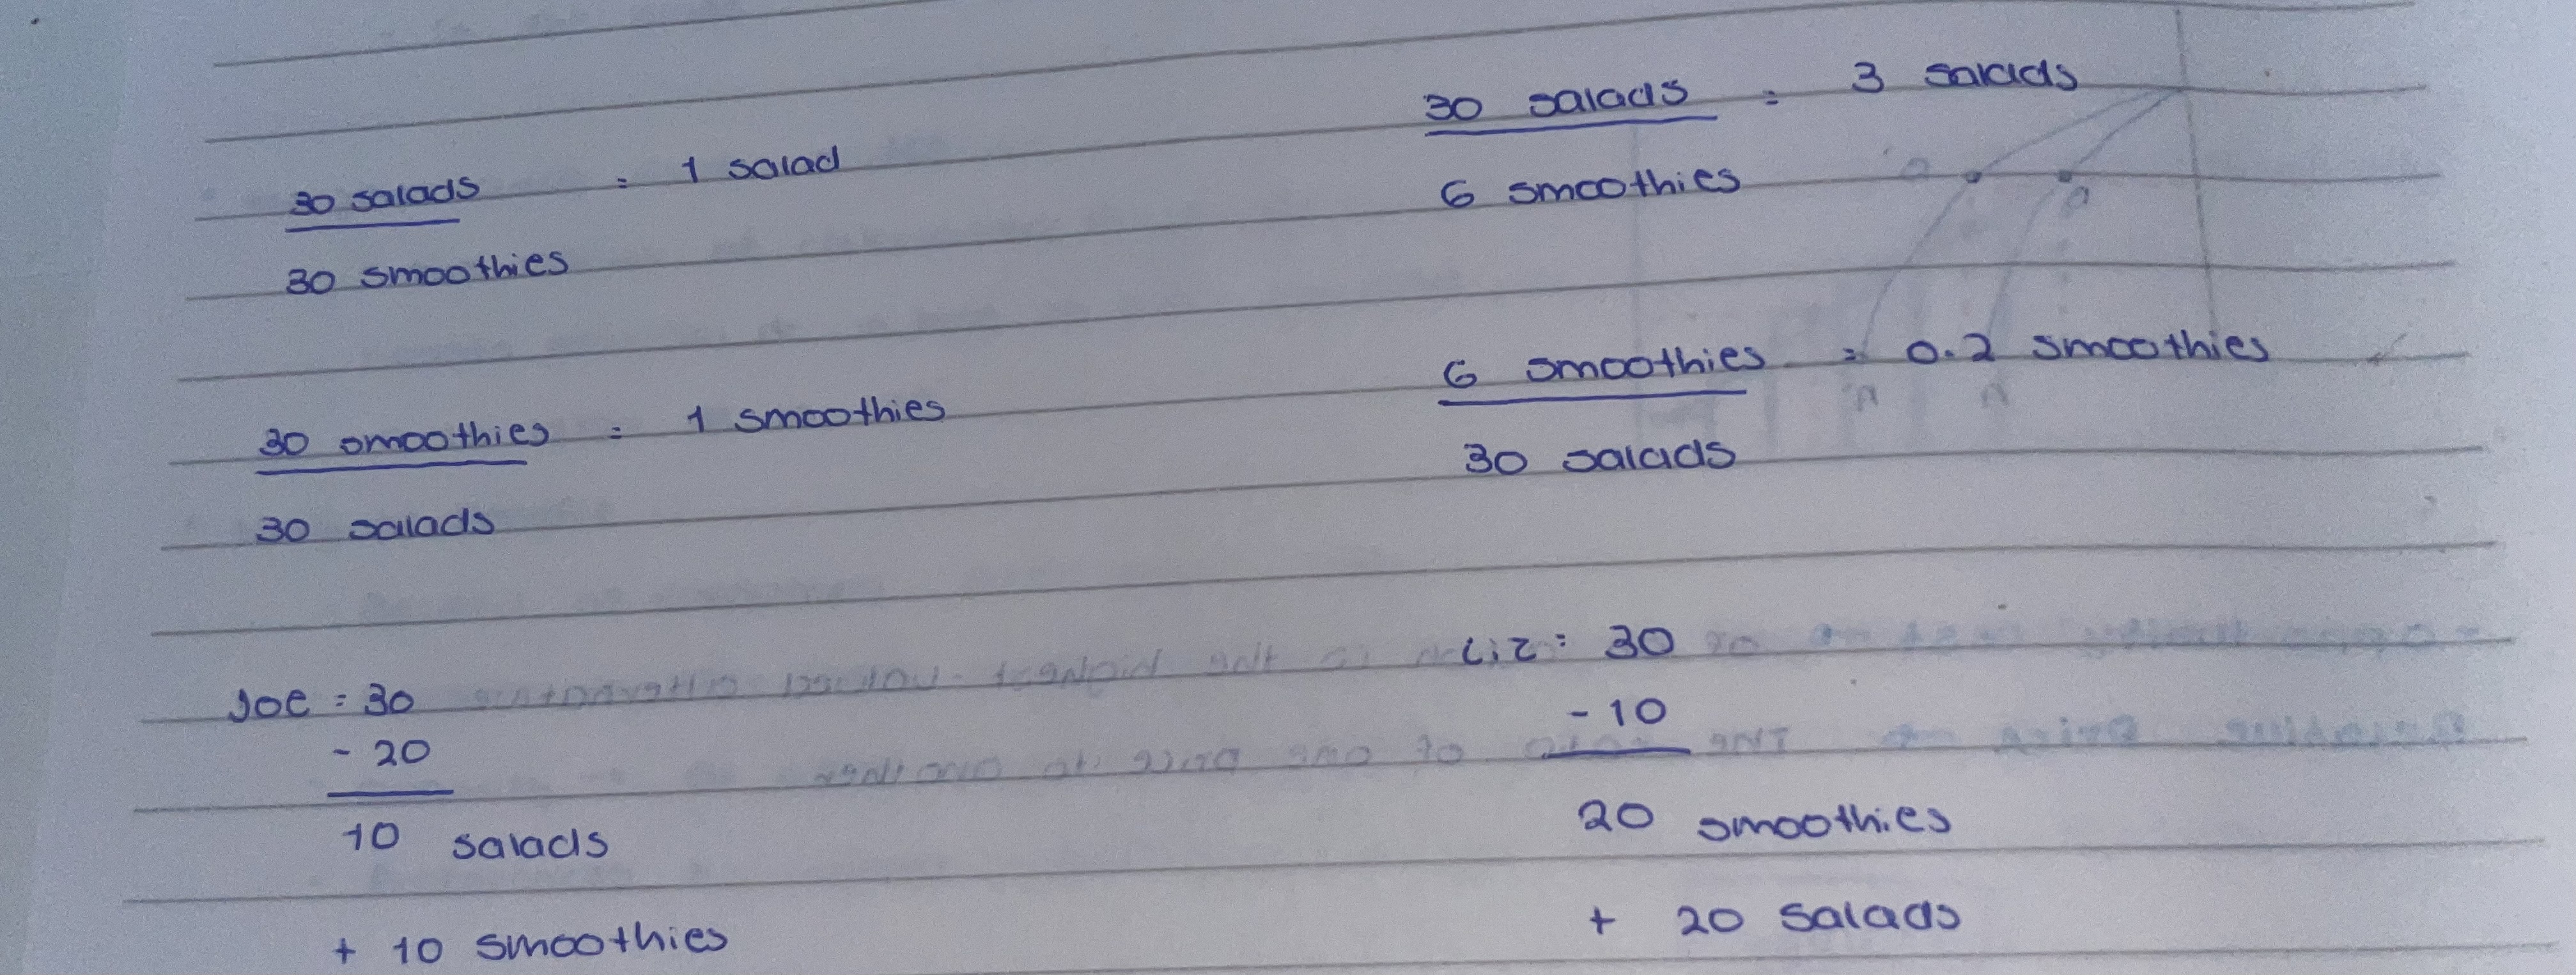
Liz and Joe example of comparative advantage
Factors that bring changes in demand
the price of related goods
expected future prices
income
expected future income increases
population
preferences
Normal good
demand increases as income increases
Inferior good
demand decreases as income increases
Circular flow diagram
Market: Firms, markets, property rights, money
Sectors: Households, firms, government, rest of the world
Dynamic: Income=expenditure
3= financial, factors of production, goods and services
Needs to work clockwise and counter-clockwise
Sectors
households
firms
government
rest of the world
households
factors of production
consumption expenditure
savings
income=salaries (dividends, interests, rent, transfers)
payments=taxes
no investments
firms
factors of production
expenditure (investments, financial conc.)
inventories
future salas
purschase goods and services
capital increase
FDI = +10% value of the company investment, power of participation gives revenue
government
expenditure
transfers
purschases
income=taxes and loans
can borrow from IMF or the world bank
rest of the world
exports
imports
prices
Money: number of currency that you give in exchange for a good or service
Relative: ratio of one price to another. opportunity cost. the value of a product and what you give up to buy it
supply and demand model
competitive markets:
producers offer goods or services, IF the price covers their opportunity cost
consumers seek cheaper goods or services
alternatives
Determines relative prices
Price = relative price
demand
it represents that you…
want (can we satisfy all our wants?
can afford (scarcity)
plan to buy
effects
Substitution:
goods have substitutes
opportunity cost increase=incentive to switch
Income:
higher prices and same income
can’t afford everything
stop buying those goods that increase the price
quantity demanded
quantity demanded vs quantity bought = not equal
quantity demanded = amount per unit of time
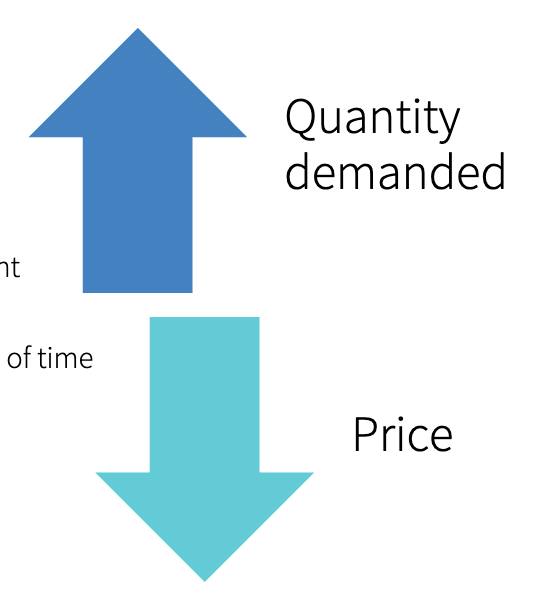
law of demand
“ceteris paribus, the higher the price of a good, the smaller is the quanity demanded. the lower the price of a good, the bigger is the quanity demadned”
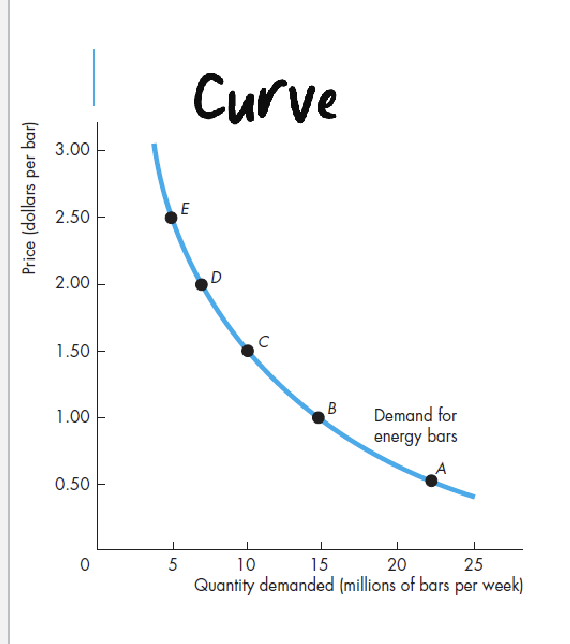
demand curve
Demand
price-quantity relationship
Demand curve
illustration
willingness and ability to pay
Demand schedule
quantities demanded at each price
changes in demand
price of related goods
substitutes: can be used in place of another
complement: used with another good
change in quantity: only price change, movement along the curve
change in demand: price remains constant, other factor changes, shift of the curve
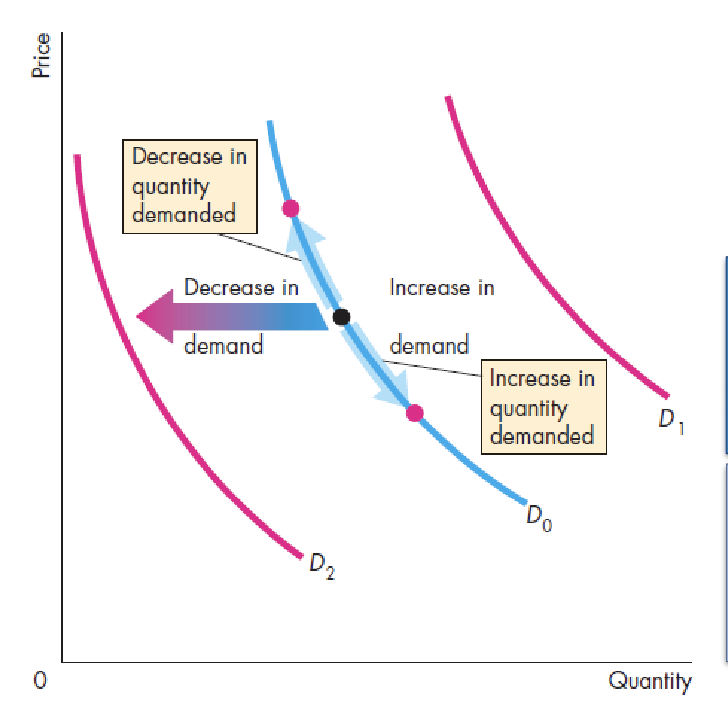
changes in demand
any factor that influences buying plans
expected future prices
income
positive relationship
normal good= demand increases with income
inferior good= demand decreases with income
expected future income and credit
easy to get credit
positive relationship
price of related goods
population
size and age structure
preferences
determine the value of a good
influenced by: weather, information, fashion
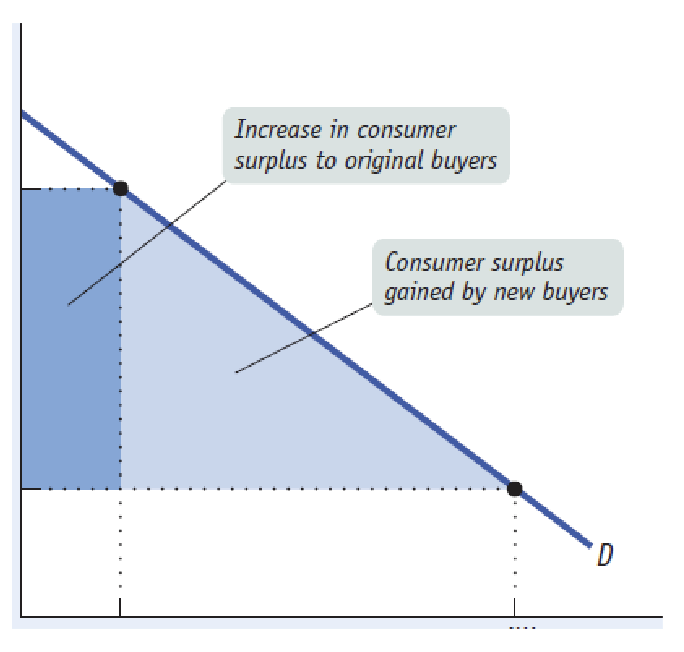
consumer surplus
the difference between the willingness to pay and the price payed
sum of individual surpluses=total consumer surplus
usually consumers pay less than their willingness to pay
price effects
supply
quantity supplied vs quantity sold
not equal
quantity supplied = amount per unit of time
supply represents
it represents that firms:
plan to produce it (what are the constraints?)
can profit (resources and technology
have resources and technology
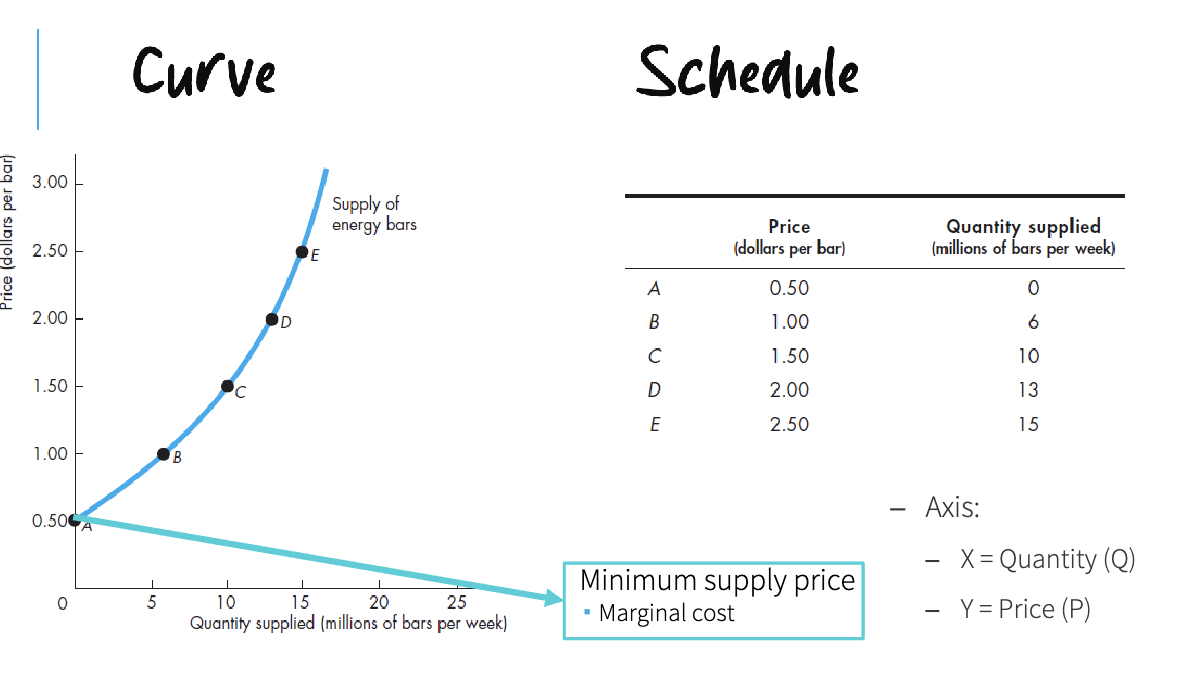
supply curve
supply
price-quantity relationship
supply curve
illustration
supply schedule
quanitities supplied at each price
changes in supply
change in quanity:
only price change
movement along the curve
change in demand:
price remains constant
other factor changes
shift of the curve
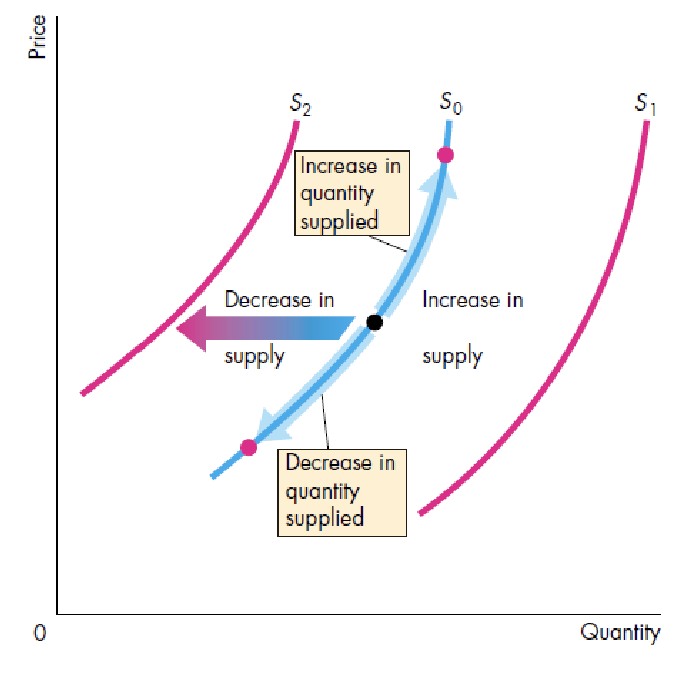
causes of changes in supply
any factor that influences selling plans
price of related goods
substitutes=goods that can be produced with the same resources
expected future prices
remaining of sales (now vs.future)
price of factors of production
lowest price willing to accept changes
number of suppliers
positive relationship
technology
ways that factors of production are used to produce
nature
natural forces that influence production
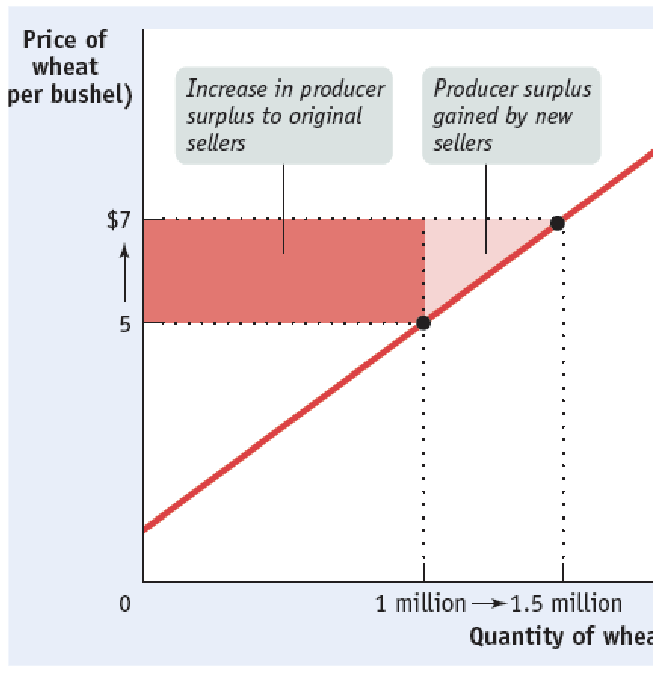
Producer surplus
the difference between the producer’s min. price (cost) and the price received
sum of individual surpluses = total producer surplus
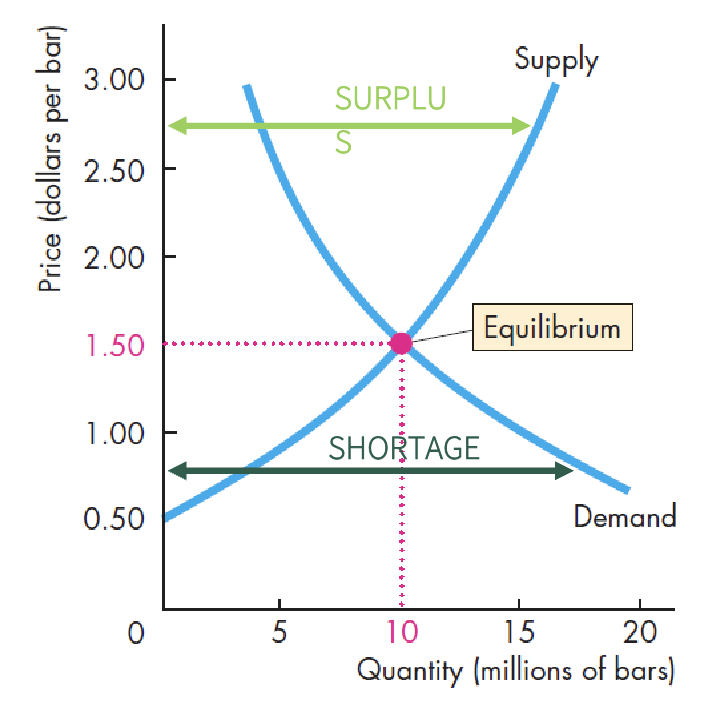
market equilibrium
no shortages or surplus
price adjustments eliminate shortages or surpluses
surplus = excedente
making sure that everything produced is sold
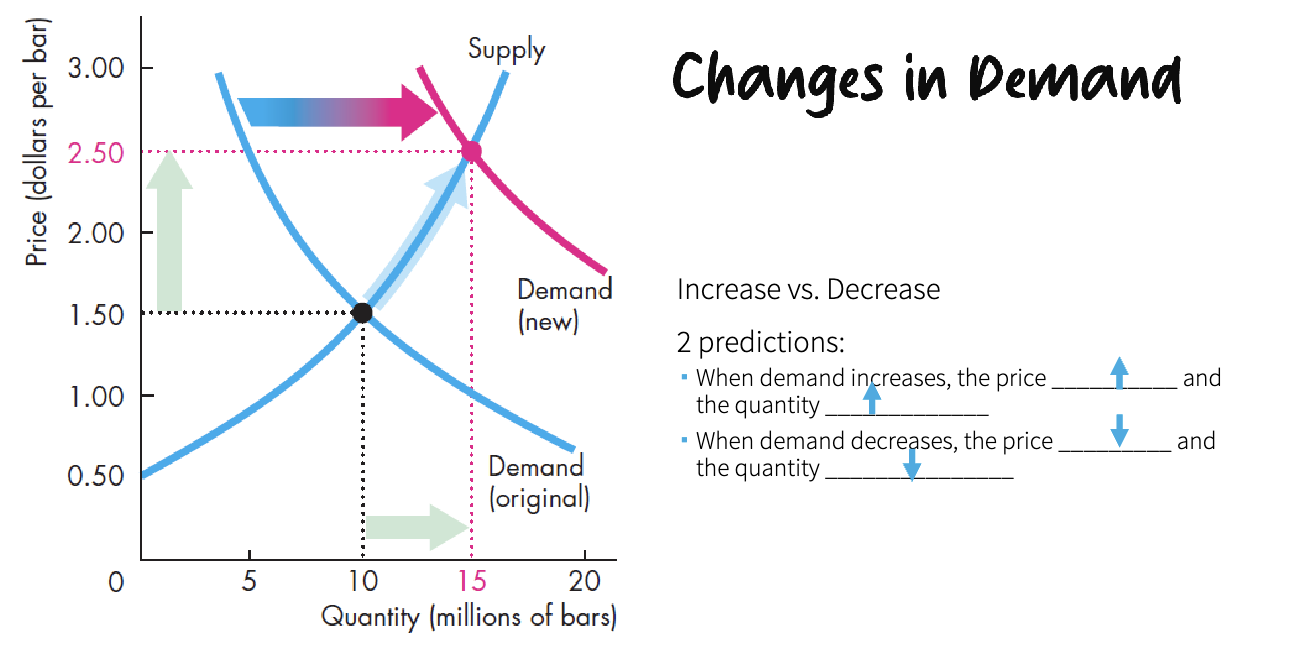
Changes in demand
increase vs. decrease
if only price changes there is only a movement
expected price increase might decrease the demand
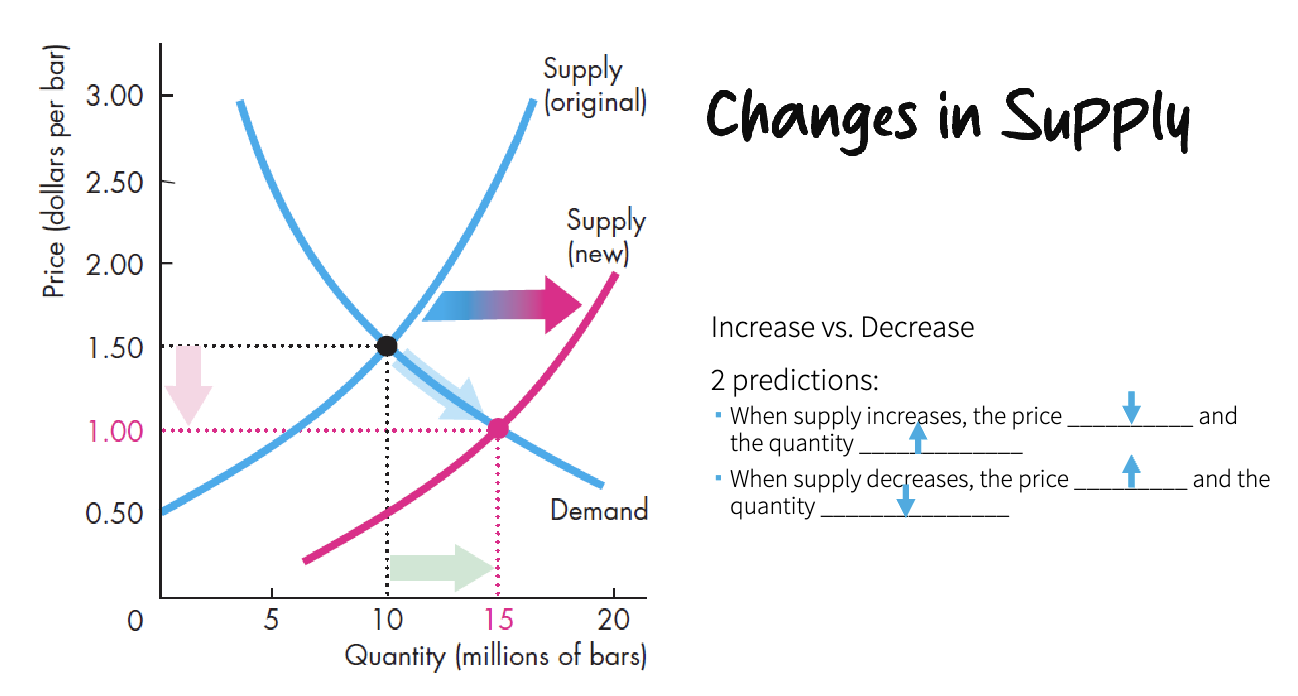
changes in supply
decrease in supply, we have a higher price to produce less
in case of the increase of suppliers price and quantity decrease
in equilibrium a price change will always end up in shortage or surplus
Equilibrium
price adjustments: coordinate buying and selling plans
equilibrium price: qty demanded= qty supplied
equilibrium quanity: qty supplied at equilibrium price
consumers value the good more than its current price
producers can’t sell all they want at high prices
produces a change in prices
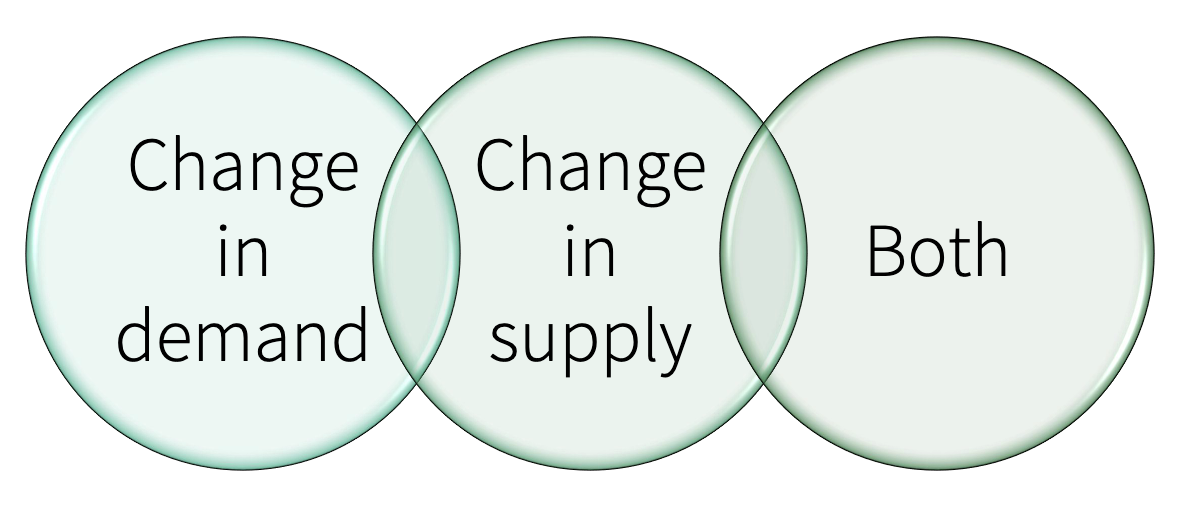
isolated changes
quantity change certain
increase in demand and supply
decrease in demand and supply
price change certain
decrease in demand and increase in supply
increase in demand and decrease in supply
important: magnitude of changes
demand curve
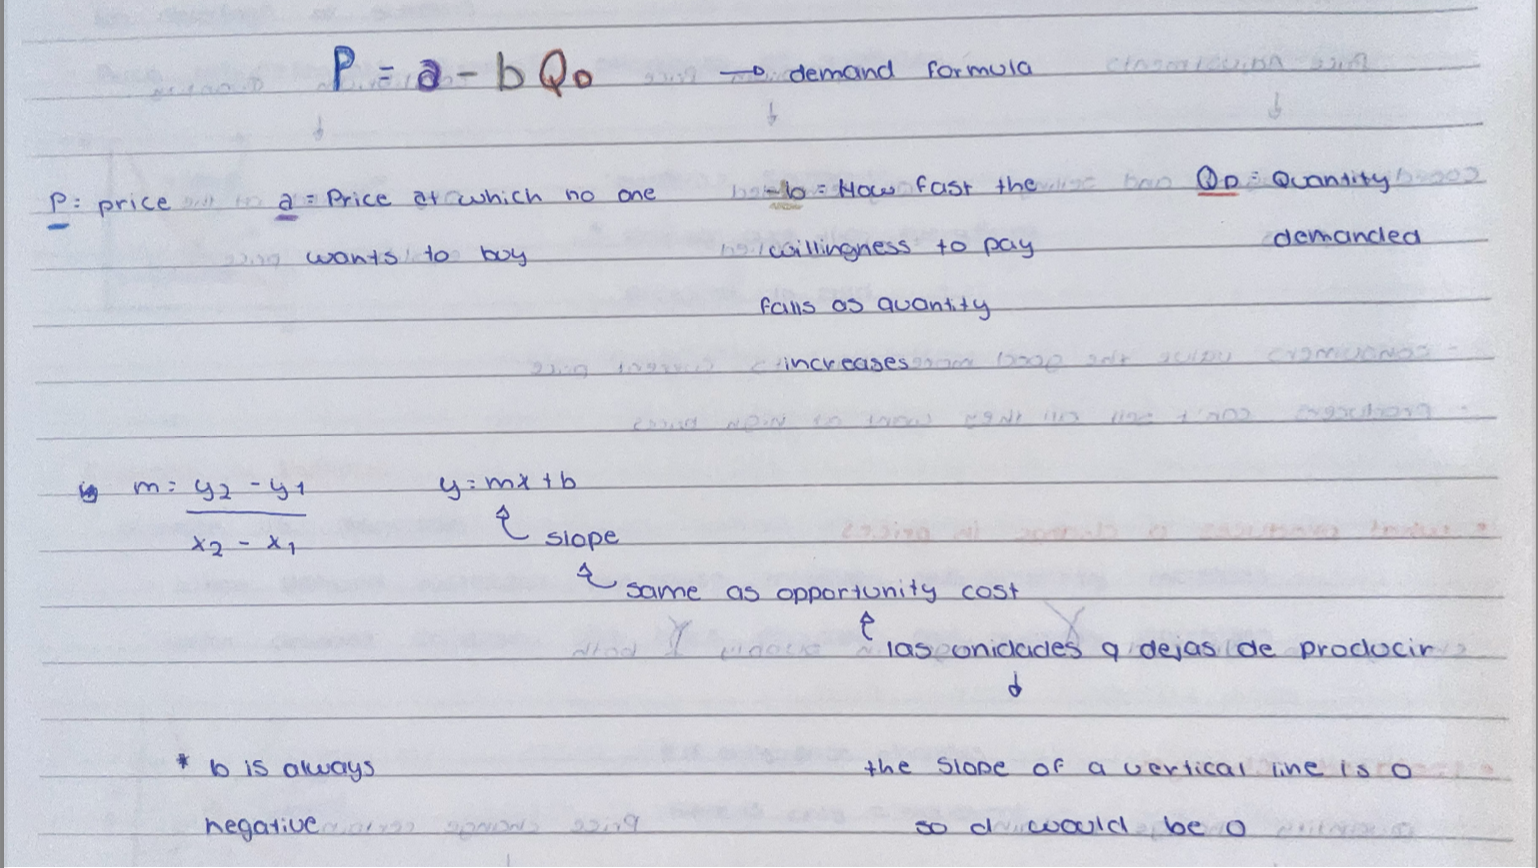
supply curve

market equilibrium

quantity equilibrium

price equilibrium
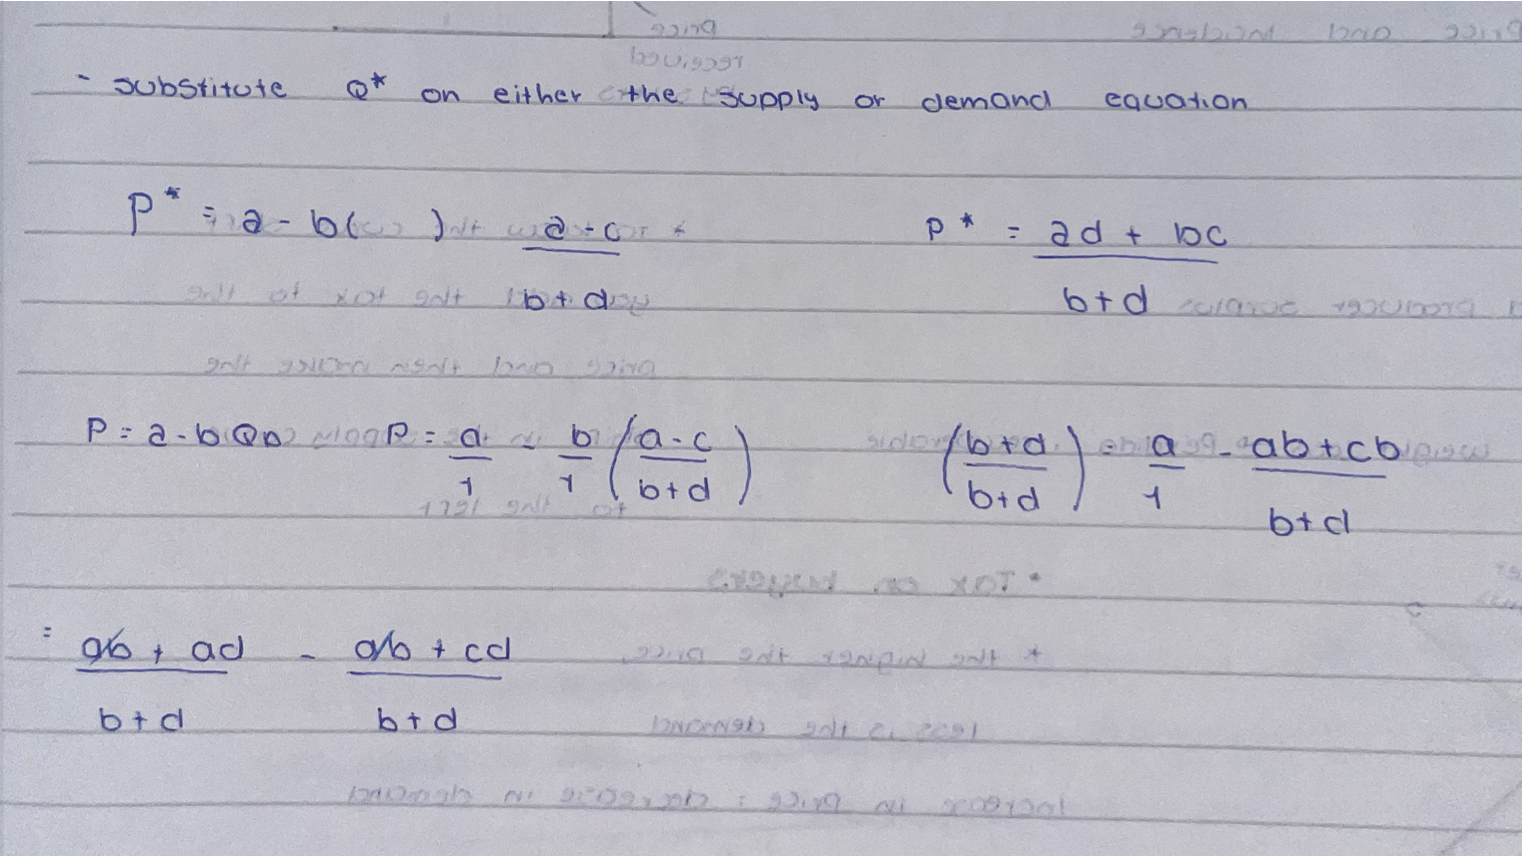
Tax incidence
division of the burden
who really pays the tax
tax on sellers
increase in cost= decrease in supply
min. selling price + tax = new equilibrium
new= price and incidence
to know the curve shift you add the tax to the price and then make the shift in the supply curve to the left
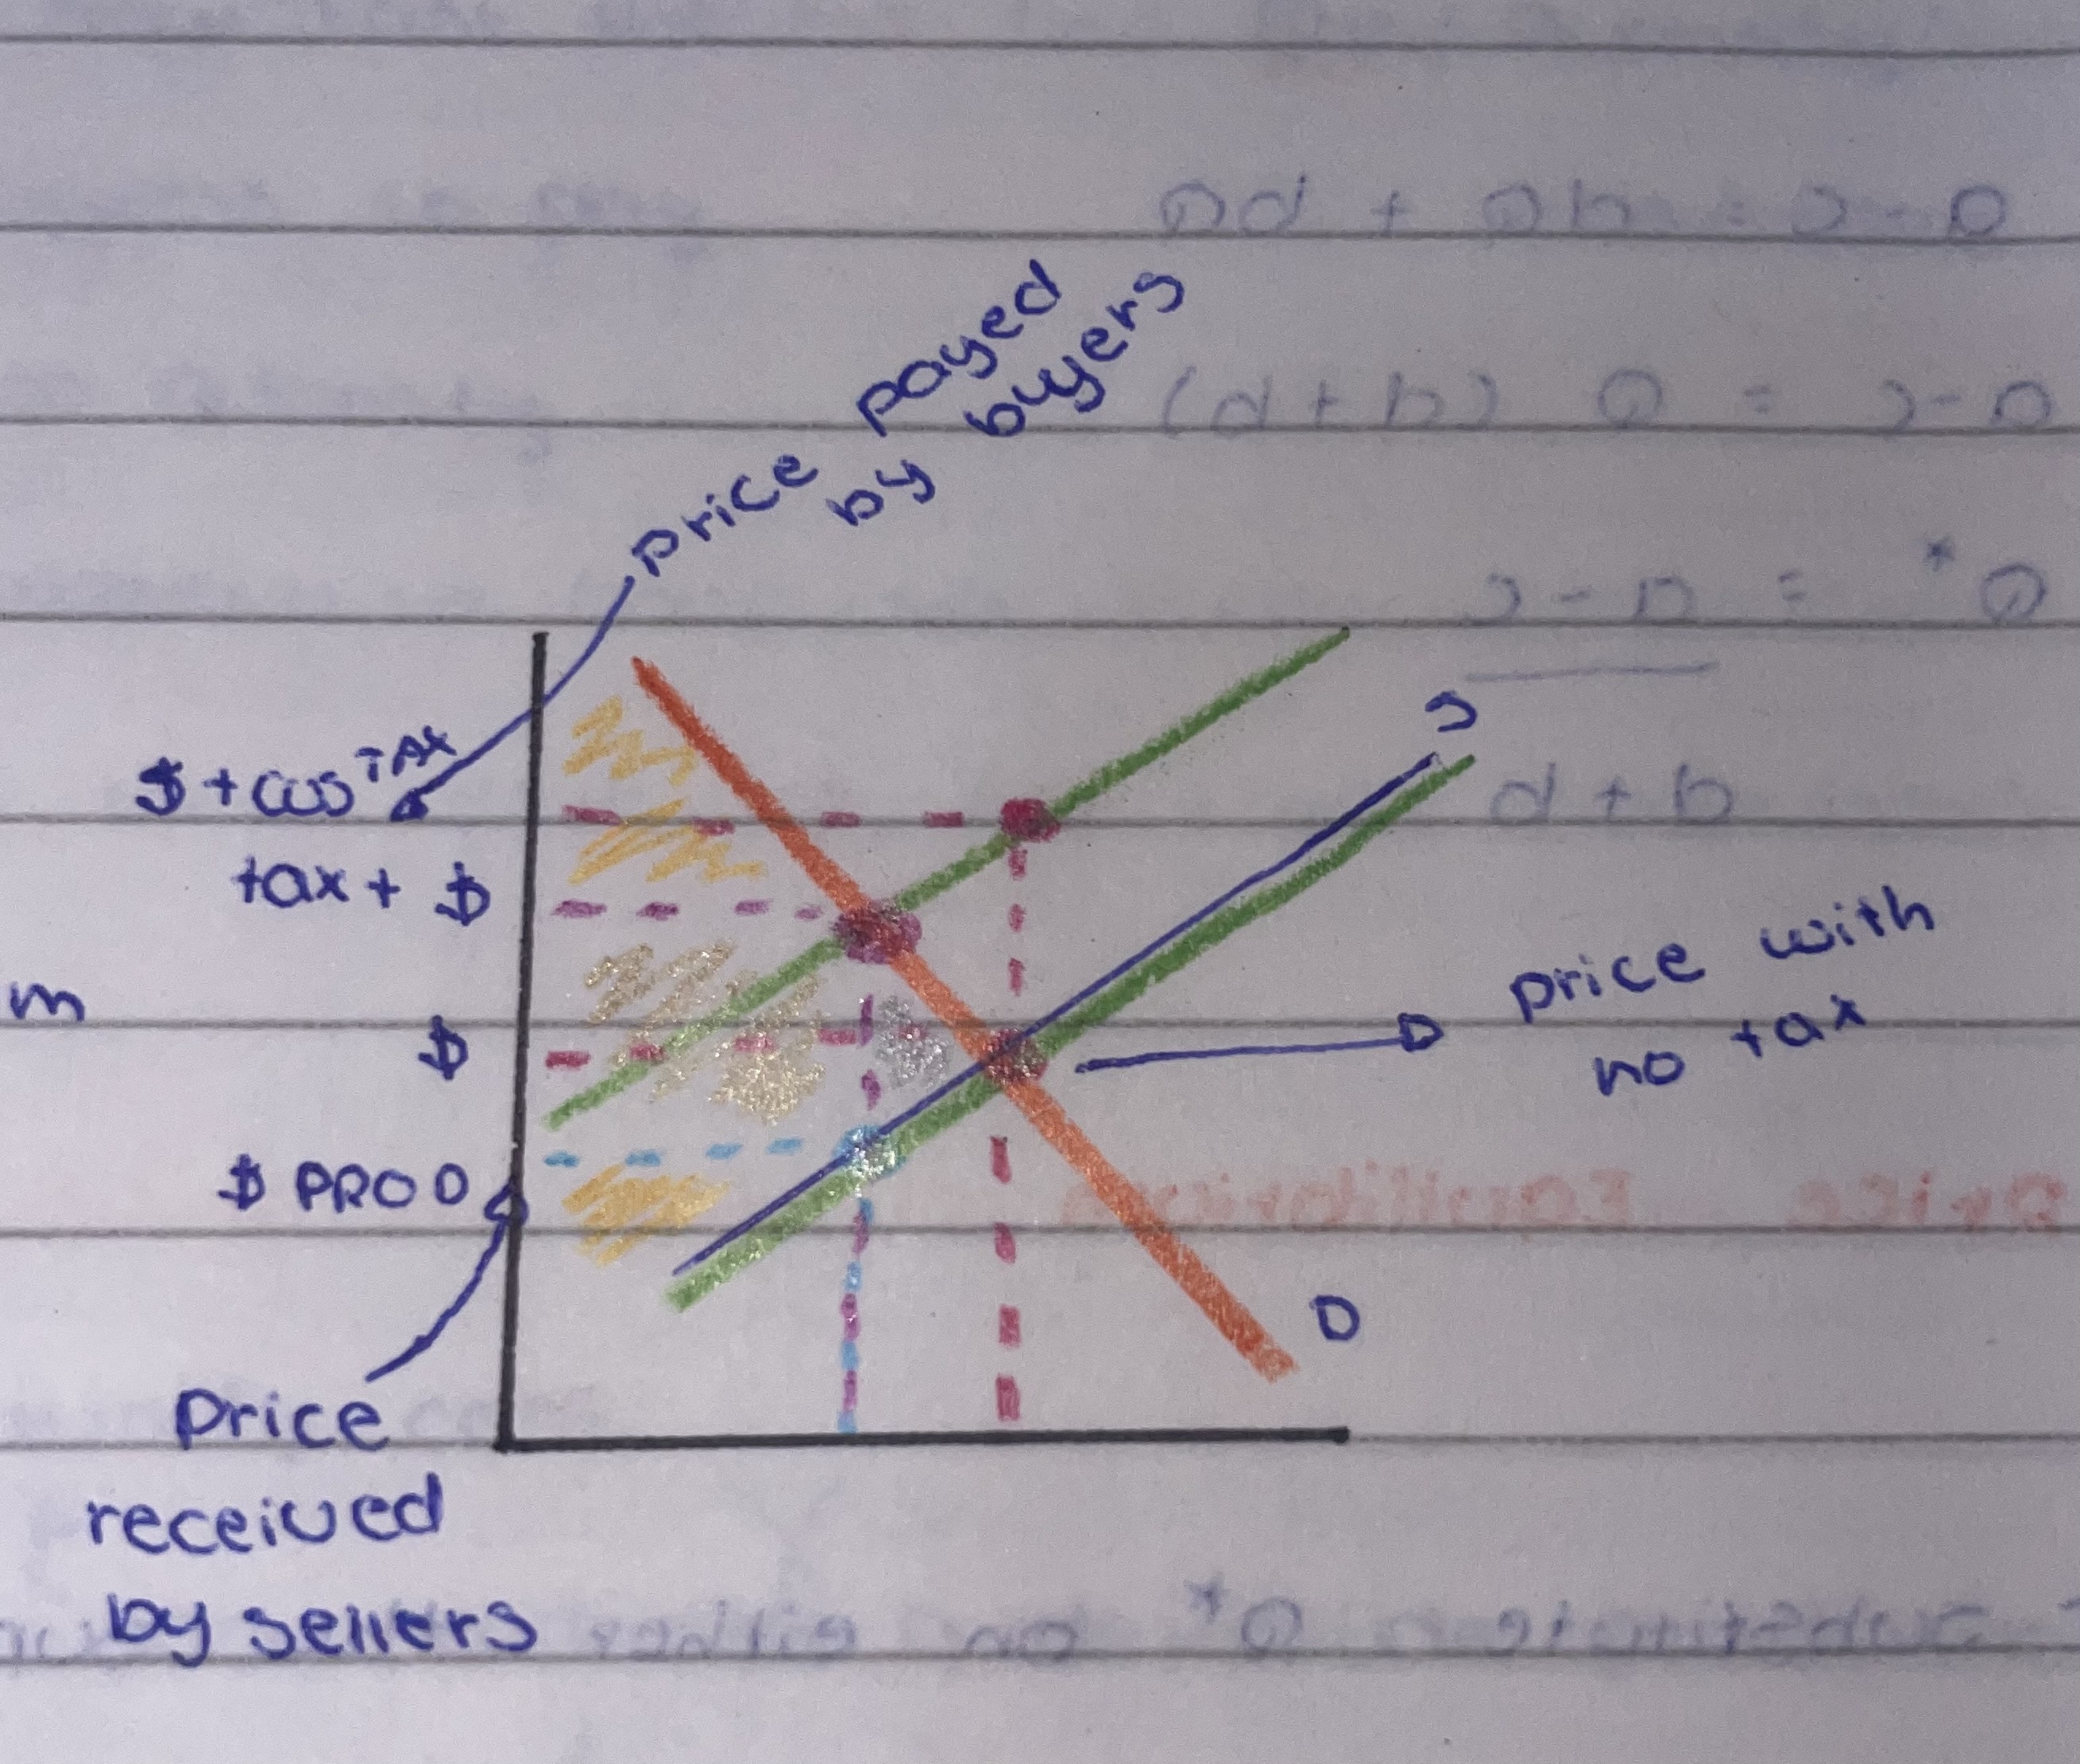
tax on buyers
the higher the price, less is the demand
increase in price= decrease in demand
$ Tax - price that producers get
$ cons - represent what consumers will pay
taxes and efficiency
wedge between buying and selling prices
underproduction
shift of consumer and producer surplus to tax revenue
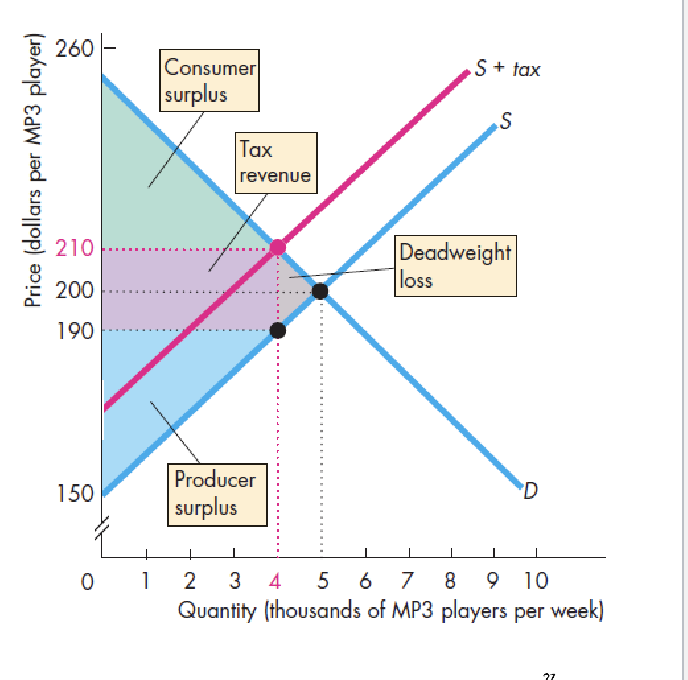
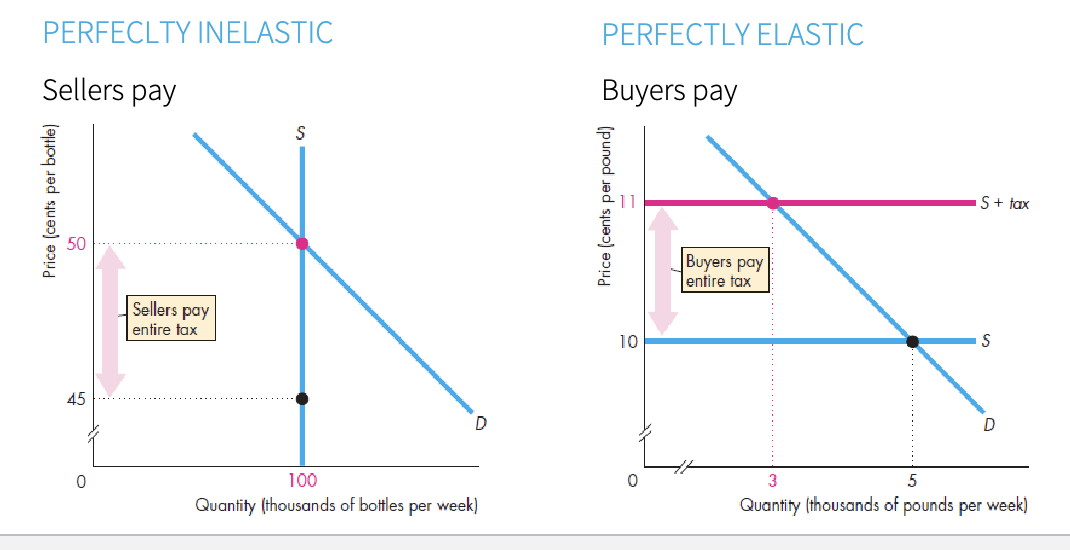
taxes and elasticities - demand
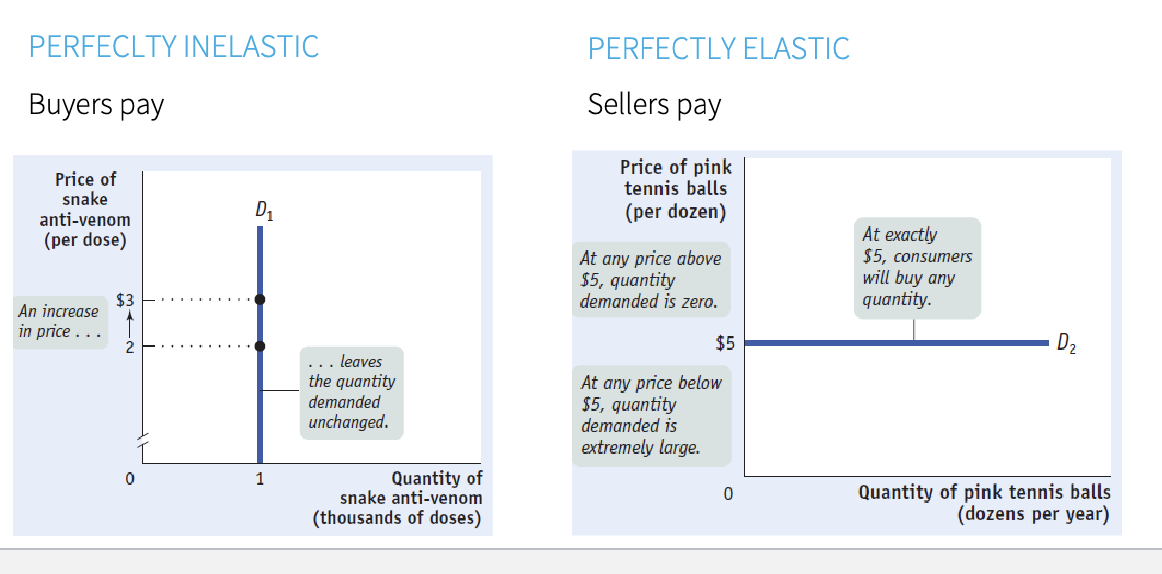
taxes and elasticities - supply
taxes and fairness
benefits
pay taxes= benefits received
ability to pay
how easily can the burden be covered
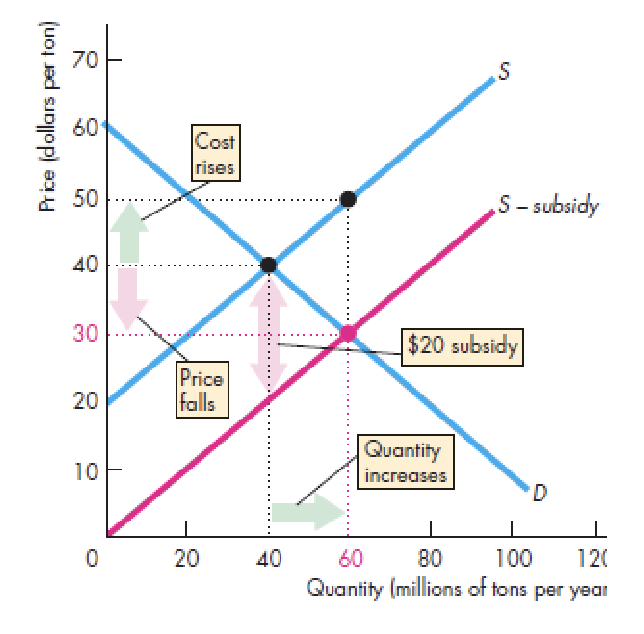
subsidies
payment from the government to a producer
effects:
supply increase
price decrease
qty produced increase
MC increase
inefficient over-production
elasticity
change in the quantity for a specific change in price
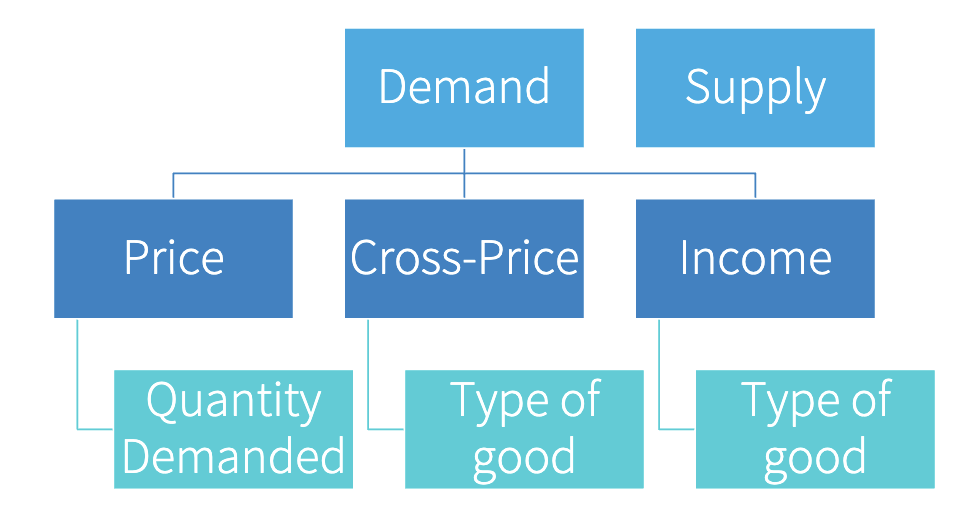
interpreting elasticity
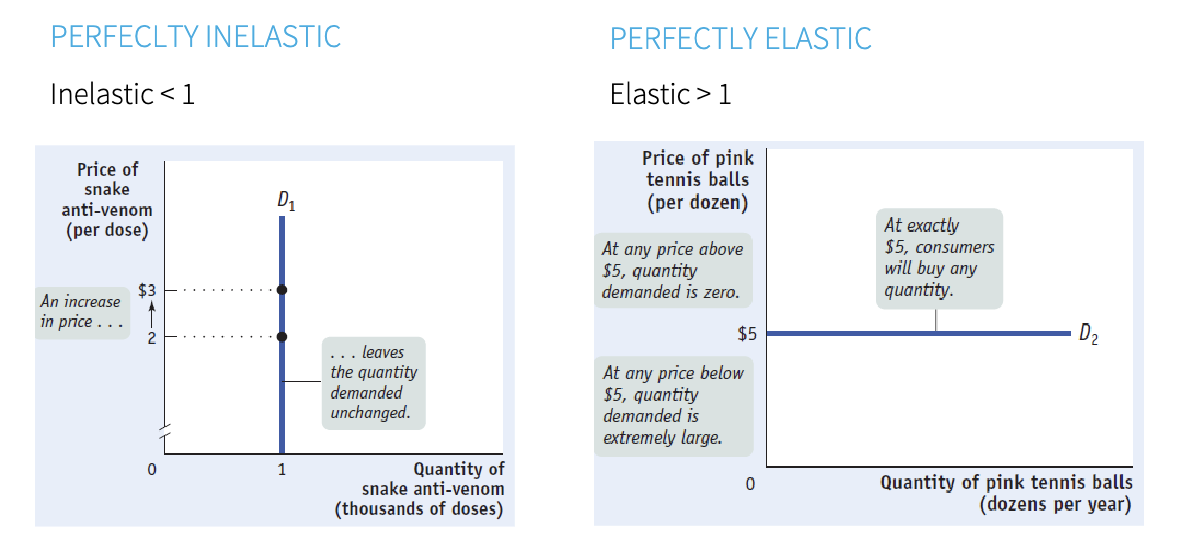
predictions
effect on TOTAL revenue
price effect
quantity effect
unit-elastic: nochange
inelastic: revenue increase
elastic: revenue decrease