biostats final
1/156
There's no tags or description
Looks like no tags are added yet.
Name | Mastery | Learn | Test | Matching | Spaced |
|---|
No study sessions yet.
157 Terms
parameter
quantity describing entire population
estimate
inferring unknown parameter from sample data
3 major goals of stats
estimate characteristics of pops
objectively answer scientific questions
describe degrees of uncertainty in scientific findings
variable
charcateristic measured on individual drawn from population
properties of good sample
ind
random
sufficiently large
random sample
each member of pop has equal and ind chance of being selected
sample is representative of the population
effects of sample size increasing
SD will become more accurate but will not systematically directionally change
SE will become smaller/narrower
1 numerical graph
histogram
2 numerical graph
scatter plot
1 categorical graph
bar graph
2 categorical graph
grouped bar graph
1 numerical 1 categorical graph
multiple histograms, dot/box plot
when is mode useful
in voting/surveys
when to use mean or median as measure of average
usually use mean but if outliers exist, use median
variance
average of the squared differences from the mean
SD
square root of variance
measure of inherent variability among individuals
coefficient of variation
SD/mean x 100
SE
variability between samples
most dangerous eq
SE
if sample size is small, SE appears more significant than it actually is. Small sample sizes can produce extreme values that can be misinterpreted
confidence interval rule of thumb
mean ± 2SE prpvides rough estimate of 95% CI
what does 95% CI mean
we are 95% confident that the true population mean lies within the 95% confidence interval
what happens to confidence interval as sample size inc
gets narrower
pseudoreplication
error that occurs when samples that are not independent are treated as though they are
characteristics of normal dist
symmetric around mean
about 2/3 of random samples are within 1 SD of the mean
about 95% of random samples are within 2 SD of the mean
mean=median=mode
bell shaped
standard normal distribution characteristics
mean=0
SD=1
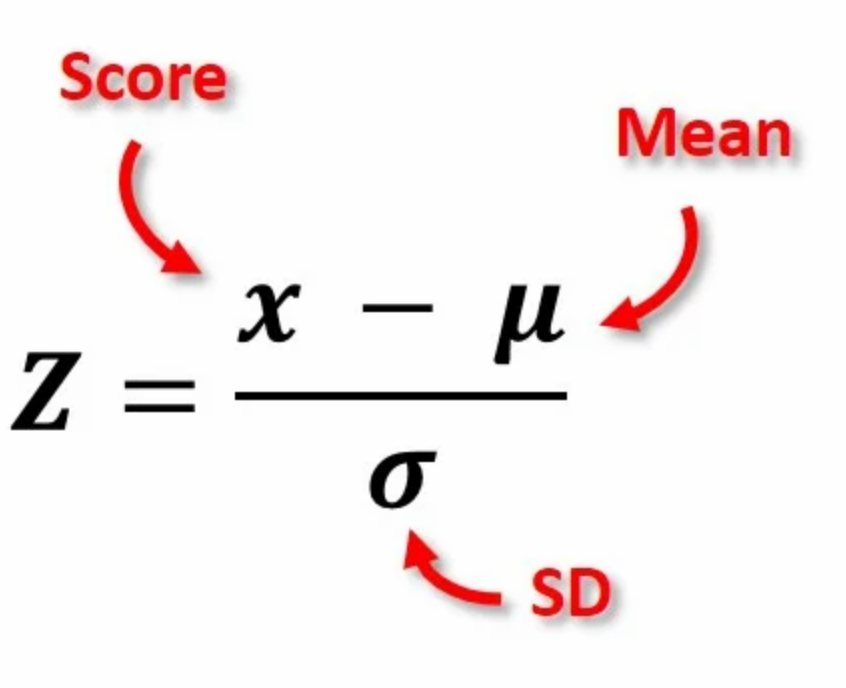
standard normal deviate
CLT
in a large sample, the mean of samples approaches a normal distribution regardless of if the population’s distribution is normal or not
how is t distribution different than z distribution
probailities based on a sample so need to account for greater uncertainty
confidence intervals wider and more probaility in the tails b/c only have estimates of mean and SD
DF
number of observations = # of parameters
1 sample t text
compares mean of random sample w population mean
1 sample t test assumptions
random sample
independent measurements
varibale is normally distributed
how is 1 sample t test robust
CLT
paired t test
1 sample t test on differences between pairs
why is paired t test good
allows you to account for extraneous variation; greater statistical power
paired t test assumptions
random sample
each pair of data is independent
the diff between the pairs is normally distributed
paired t test robust
CLT
paired t test DF
#pairs - 1
2 sample t test
compares means of 2 samples
2 sample t test assumptions
random
independent
normal distribution
equal variance
equal sample size
2 sample t test robust
performs adequately if diff in SD is 3 fold or less and sample size is moderately large and sample size is similar in both groups
unequal variance/welch test
adjusts for very unequal variances
assumptions for welch
same as 2 sample but no equal variance
why not just always use welch instead of 2 sample t test
less statistically powerful
robust definition
test performs adequately even if assumptions aren’t met exactly
Q-Q plot
straight line means perfectly normal
informal normality checks
histogram and Q-Q
leptokurtic
too pointed
platykurtic
too flat
formal tests for normality
shapiro-wilks (n<50)
kolmogorov smirnow (n>50)
steps if parametric assumptions are violated
evaluate outliers
transform data
non-parametric test
positive skew transformation
slight: square root
moderate: ln or log
extreme: inverse
transform negative skew
first try square and if that fails
reflect data so it is now pos skewed and then use the pos transformations
backtransforming
backtransform important parameters like mean and SE/ 95% CI
DONT BACKTRANSFORM SD
when transformations don’t work
use non-parametric tests
non-parametric tests have…
fewer assumptions about shape and spread of data but are less statistically pwoerful
non-parametric version of 2 sample t test
mann-whitney u test
mann-whitney u test
converts data into ranks and tests for difference between medians
mann0whitney u test assumptions
similar shape and variance
non parametric test for paired and 1 sample
wilcoxon signed rank test and sign test
wilcoxon signed rank test
test difference between sample median and hypothesized median
turned diff data into ranks
wilcoxon signed rank test assumptions
data are symmetric around the mean
sign test
tests diff between sample median and hypotheiszed median
turned differences into +1 and -1
sign test assumptions
none
low statistical power
type 1 error
incorrectly rejecting the null hypothesis
populations not diff but saying they are
p value
estimate of likelihood of committing type 1 error
type 2 error
failure to reject the null hypothesis even though it is false
populations are different but saying they arent
ANOVA
1 categorical variable (2+ groups_) and 1 numerical value
example of ANOVA`
effect of 3 drugs and a placebo on blood pressure
what does anova compare
mean of 2+ groups
null hypothesis of ANOVa
all means are the same; there is no difference
alternate hypothesis for anova
there is at least one difference
anova assumptions
same as 2 sample tt est
anova robust
same as 2 sample t test
CLT and 3 fold
anova f statistic
F= s2 between groups / s2 within groups
when F=1
groups come from same population
when F>1
groups come from diff populations
degrees of freedom for ANOVA
1: k-1 = # groups -1
2: n-k= # observations = # groups
why not just do multiple t tests instead of ANOVA
-p value no longer representative of type 1 error
large probability of erroneous results
multiple comparisons would lead to too many type 1 errors
what to do after anova shows there is a diff
tukey test
why do we need tukey test
need to see WHICH groups are diff form each other
tukey test
compares all groups and determines which pairs are different
HSD
honestly significantly difference
why is tukey test important
protects us from making false conclusions due to many comparisons
tukey test assumptions
same as 2 sample t test
fixed effects
constant across treatments
random effects
not constant; size of effect varies within groups
E.g. testing 4 drugs and their speeds of recovery
fixed: care about specific drugs and the dosage that each person in each drug treatment group gets
e.g. testing dosage of drug A on speed of recovery
Fixed; care about particular dosage
e.g. compare GPA of students from wealthiest 10% and poorest 10% if families from 45 random schools
random effect; top and bottom 10% vary by school district
e.g. survey of patients about drug use vs. recovery time
random; low med high dosage groups but still variation in dosage in each group
random effects assumptions
same as 2 sample t test AND
groups are from random sample
group means are normally distributed
welch’s ANOVA
used instead of ANOVA if variances are VERY different
welch’s anova assumptions
random
independent
normally distributed
similar sample sizes
post hoc test used for welch’s anova
games-howell post hoc test
games- howell post hoc test
like tukey test but handles unequal variances
games-howell assumptions
same as welch’s anova
random, independent, normal dist, similar sample size
non-parametric ANOVA
kruskal-wallis
kruskal wallis test assumption
similar shape and variance (like mann whitney U)
null hypothesis of kruskal wallis
all medians and distributions are equal
alterante hypothesis kruskal wallis
all medians are not the same; at least one group is different