PL-300 Actual Exam Questions
1/353
There's no tags or description
Looks like no tags are added yet.
Name | Mastery | Learn | Test | Matching | Spaced |
|---|
No study sessions yet.
354 Terms
You have a Power BI semantic model named Model1.
You need to create a measure that will display the sales result for all blue units. The solution must maintain the existing filter context.
How should you complete the DAX expression? To answer, select the appropriate options in the answer area.
NOTE: Each correct selection is worth one point.

CALCULATE
KEEPFILTERS
You have an on-premises data gateway.
You need to reduce the amount of data sent through the gateway by semantic models that run in Import storage mode.
Solution: You decrease the dashboard cache update frequency.
Does this meet the goal?
No
You use Power BI Desktop to import two tables named Customer and Contacts.
The Customer table contains the following columns:
• Customer_Name
• Customer ID
• Website
The Contacts table contains the following columns:
• Contact ID
• Contact Email
• Contact Name
• Customer Name
A web-based contact form is used to fill the Contacts table. The data is not sanitized.
You need to create a merge for the Customer and Contacts tables.
What should you do?
Enable fuzzy matching
You need to create a semantic model in Power BI Desktop. The solution must meet the following requirements:
• The model must contain a table named Orders that has one row per order. Each row will contain the total amount per order.
• The orders must be filtered to the selected CustomerID value.
• Users must select the CustomerID value from a list.
• The list of customers must come from an OData source.
Which three objects should you create in Power Query Editor? Each correct answer presents part of the solution.
an Orders query that has a filter on CustomerID
a Customers query that has a single column containing a list of customer IDs
a parameter for CustomerID that uses a query to populate the suggested values
You have a Power BI semantic model that contains three tables named Products, OrderHistory, and Date.
The Products table is a dimension table that contains the following columns:
• ProductID
• ProductName
The OrderHistory table is a fact table that contains the following columns:
• OrderID
• ProductID
• OrderDate
The Date table is a dimension table that contains the following columns:
• Year
• Date
• Week
• Month
You need to define a relationship from Products to OrderHistory and from OrderHistory to Date.
Which cardinality should you configure? To answer, select the appropriate options in the answer area.
NOTE: Each correct answer is worth one point.

One-to-many
One-to-one
You create a Power BI workspace named Workspace1.
You publish a semantic model and a report to Workspace1.
You need to configure Workspace1 to meet the following requirements:
• Provide access to a group named Sales.
• Ensure that Sales can invite other users to Workspace1.
• Follow the principle of least privilege.
Which role should you assign to Sales?
Member
You are creating a Power BI single-page report.
Some users will navigate the report by using a keyboard, and some users will navigate the report by using a screen reader.
You need to ensure that the users can consume content on a report page in a logical order.
What should you configure on the report page?
the tab order
You have a Power BI semantic model.
You need to configure row-level security (RLS) to restrict data access for users that have the Viewer permissions.
Which three actions should you perform in sequence? To answer, move the appropriate actions from the list of actions to the answer area and arrange them in the correct order.
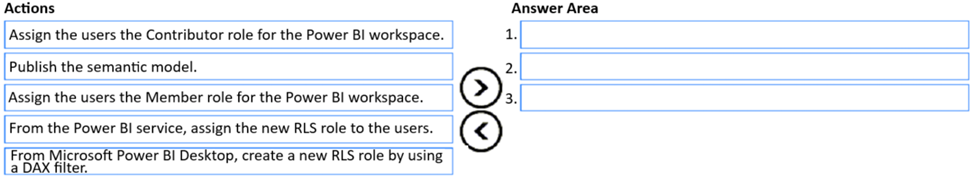
From Microsoft Power BI Desktop, create a new RLS role by using a DAX filter.
Publish the semantic model.
From the Power BI service, assign the new RLS role to the users.
You have a Power BI tenant that contains a workspace named WS1. WS1 contains the following items:
• A semantic model named SM1.
• A report named RPT1 that is connected to SM1.
• A report named RPT2 that is connected to SM1.
• A report named RPT3 that is connected to SM1.
• A dashboard named DB1 that contains content from RPT1 and RPT2.
You need to grant workspace access to a group named Group1. The solution must meet the following requirements:
• Group1 must be able to view RPT1, RPT2, and DB1.
• Group1 must be prevented from viewing RPT3.
• Group1 must be prevented from creating new reports and dashboards by using SM1.
• Group1 must be prevented from sharing the reports and dashboards to other users.
• Administrative effort must be minimized.
What should you do?
Publish an app
You use Microsoft Power BI Desktop to review the data shown in the following exhibit.
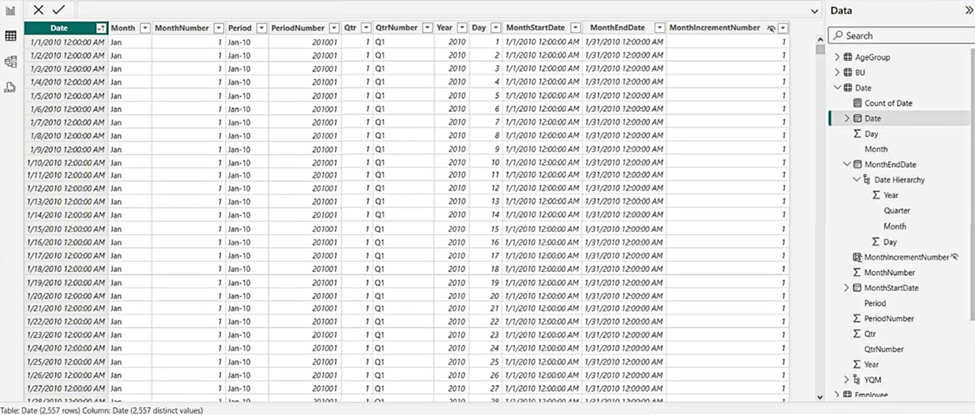
Use the drop-down menus to select the answer choice that completes each statement based on the information presented in the graphic.
NOTE: Each correct selection is worth one point.
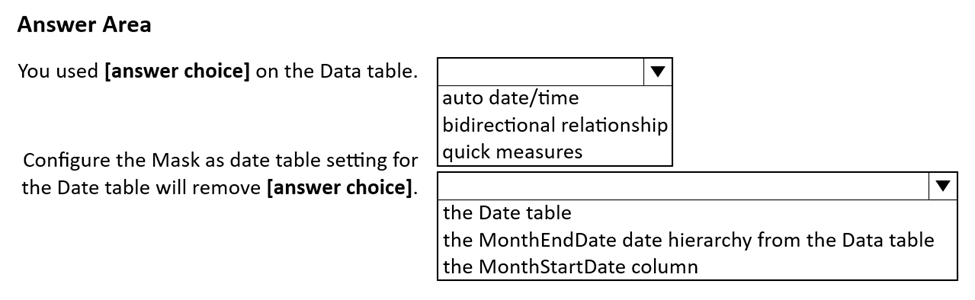
quick measures
the MonthStartDate column
You have a Power BI report named Report1.
You plan to share Report1 with multiple users.
You need to add the users to a group.
Which two types of groups can you use? Each correct answer presents a complete solution.
Security group
Microsoft 365 group
You have a Microsoft Power BI Desktop report named Report1 that uses an Azure SQL database as a data source.
A user named User1 plans to create a report by using the same data source as Report1.
You need to simplify the connection to the data source for User1.
Which type of file should you create?
PBIDS
You plan to create a Power BI semantic model named Model1 that will contain data from an Azure SQL database named DB1.
Model1 must show updated data within two minutes of the data being updated in DB1.
You need to select a connectivity mode for the connection to DB1.
What should you choose?
DirectQuery
You are creating a new semantic model in Microsoft Power BI Desktop.
You connect to a recently used data source and receive an error message indicating that the password is expired.
You need to update the credentials for the data source.
What should you do?
From Data Source settings, select the data source, and then select Edit Permissions.
You have a Power BI semantic model named Model1 that contains a table named Sales.
Sales contains 10 million records and the following data.
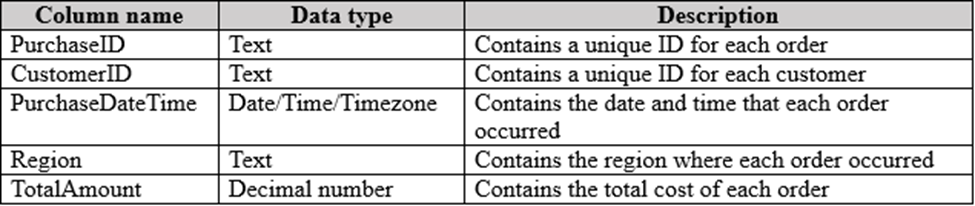
The related report displays the weekly sales per region.
You need to minimize the size of Model1.
How should you modify the CustomerID column and the PurchaseDateTime column? To answer, select the appropriate options in the answer area.
NOTE: Each correct selection is worth one point.
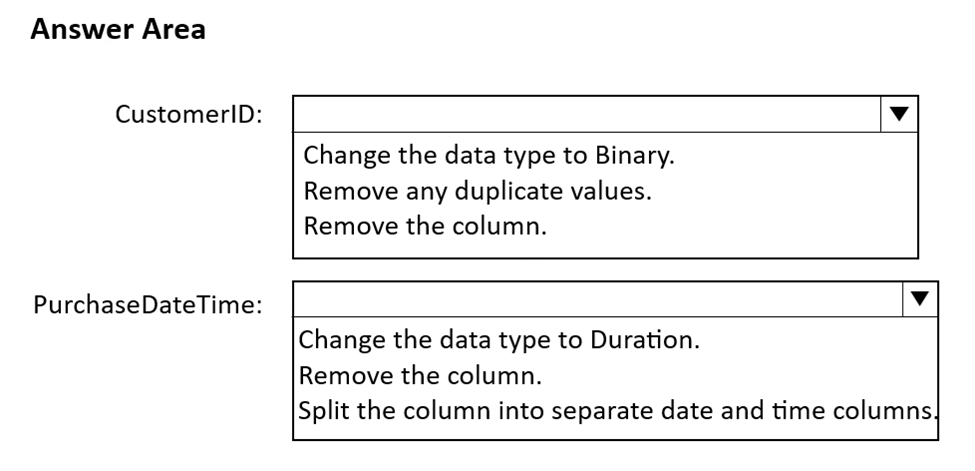
Remove the column
Split the column into separate date and time columns
You have a Power BI report that contains a bar chart. The bar chart displays sales by country.
You need to ensure that a summary of the data shown on the bar chart is accessible by using a screen reader.
What should you configure on the bar chart?
alt text
You have a Power BI semantic model named Model1 that runs in Import storage mode.
You need to reduce the size of Model1. The solution must NOT increase report query response times.
What should you do?
Remove unnecessary columns.
You have a Power BI semantic model that contains the following data.

You need to create a solution that meets the following requirements:
• Presents transaction amount totals for each month for the current and prior year
• Follows the star schema modeling approach
• Minimizes the data model size
Which three actions should you perform? Each correct answer presents part of the solution.
Create one-to-many relationships between the tables.
In the Transactions query, group by AccountID and MonthStartDate for TransactionDate. Aggregate by summing the TransAmt column.
In the Transactions query, add a column that contains the MonthStartDate value for TransactionDate.
You use Power Query Editor to review the query shown in the following exhibit.

Each Region value appears only on the row where it first occurred. Each subsequent occurrence of the Region value is blank.
You need to ensure that every row contains the correct non-blank value. The solution must minimize development effort.
Which column should you select, and which action should you perform on the column? To answer, select the appropriate options in the answer area.
NOTE: Each correct selection is worth one point.

Region
Fill down.
You have a Power BI semantic model that contains two tables named Sales and Forecast. Both tables contain a date column.
You need to create a calculated table that will cover the range of dates in both tables.
How should you complete the DAX expression? To answer, select the appropriate options in the answer area.
NOTE: Each correct selection is worth one point.

CALENDAR MINXX MAXX
You have a Power BI semantic model named Model1 that contains two tables named DimDate and FactSales. There is an active relationship between DimDate and FactSales. DimDate is marked as the date table. FactSales contains the following data.

Model1 contains the following measure.
Previous Year Sales = CALCULATE([Sales Amount], PREVIOUSYEAR('Date'[Date]))
You have a report that uses Model1. The report has a single report page that has a page level filter set to May 9, 2024. The result of the Previous Year Sales measure is displayed in a card visual.
Which value will appear in the card visual?
15
You have a Power BI workspace named Workspace1 and a group named Group1.
You need to ensure that the members of Group1 are notified when there are issues in Workspace1. The solution must follow the principle of least privilege.
What should you do?
Update the contact list to include Group1.
You have a Power BI semantic model that contains a table.
You need to create a Power BI report page that contains two visuals that meet the following requirements:
• Visual 1: Displays the distribution of hierarchical data
• Visual 2: Search and then filter by values
Which type should you choose for each visual? To answer, drag the appropriate visual types to the correct visuals. Each visual type may be used once, more than once, or not at all. You may need to drag the split bar between panes or scroll to view content.
NOTE: Each correct selection is worth one point.

Treemap
Slicer
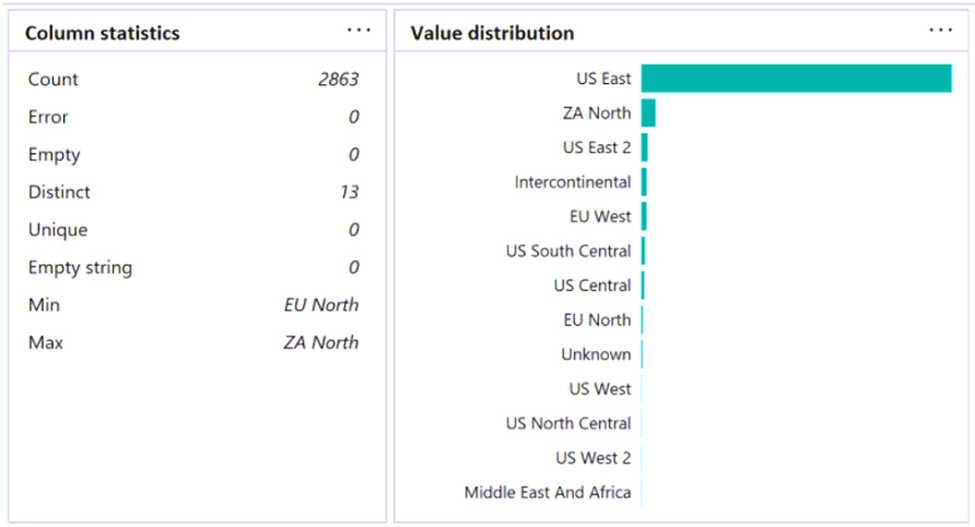
You have a Power BI semantic model named ModelA that contains the following columns:
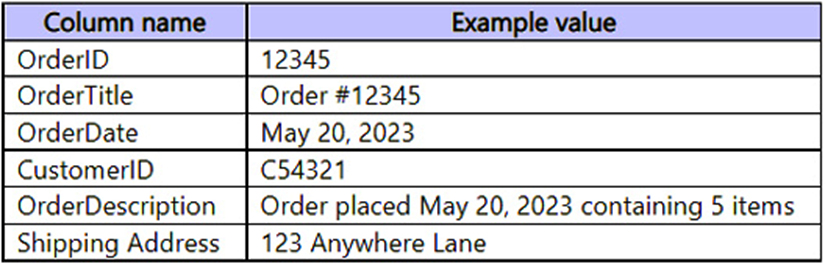
All of the columns use the Text data type.
Based on the model, you create a report named ReportA that contains the following columns:
• OrderID
• OrderDate
• CustomerID
• ShippingAddress
ReportA is the only report connected to ModelA.
You discover that ReportA has performance issues caused by the size of ModelA.
What should you do to optimize and reduce the size of ModelA? To answer, select the appropriate options in the answer area.
NOTE: Each correct selection is worth one point.
Change Data Type of OrderID to Whole Number.
Delete the OrderTitle and OrderDescription columns.
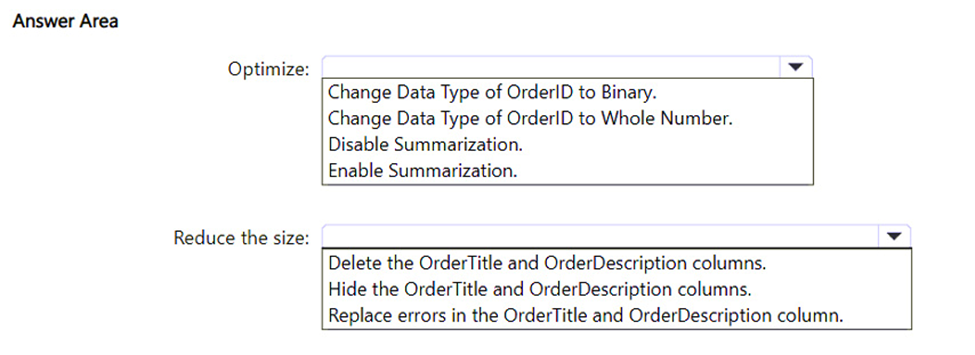
You use Power Query Editor to preview the data in a column named Resource Location.
The column statistics and value distributions of Resource Location appear as shown in the following exhibit.
Use the drop-down menus to select the answer choice that completes each statement based on the information presented in the graphic.
NOTE: Each correct selection is worth one point.
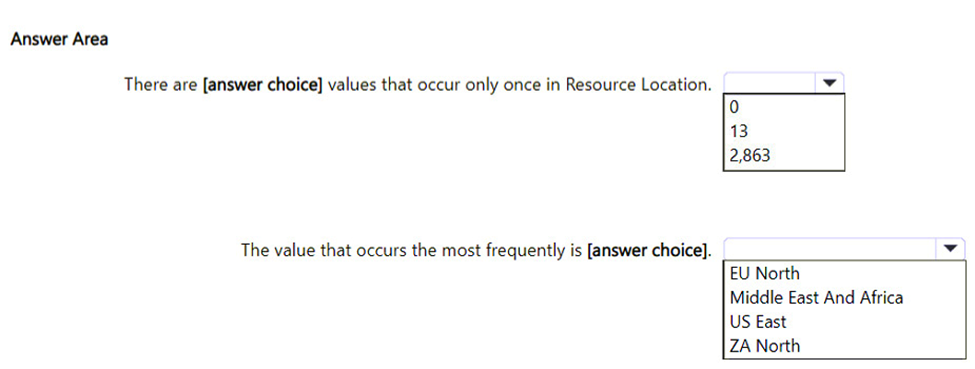
0
US East
You publish a semantic model to the Power BI service. The semantic model contains data from the following data sources:
• Source1: A Microsoft Excel file stored in Microsoft OneDrive for Business
• Source2: An Azure SQL database on a virtual network
• Source3: A public website
Which data sources require an on-premises data gateway?
Source2
You have a Power BI report that contains the visual shown in the following exhibit.

You need to make the visual more accessible to users who have color vision deficiency.
What should you do?
Add icons to represent the sales status of each product.
You have a Power BI app that contains a report named Report1.
You add a new page to Report1.
You need to ensure that users can view the new page. The solution must minimize administrative effort.
What should you do?
Update the app
You have an on-premises data gateway.
You need to reduce the amount of data sent through the gateway by semantic models that run in import storage mode.
Solution: You configure incremental refresh.
Does this meet the goal?
Yes
You are configuring a Power BI report for accessibility as shown in the following table.

You need to change the default colors of all three visuals to make the report more accessible to users who have color vision deficiency.
Which two settings should you configure in the Customize theme window? Each correct answer presents part of the solution.
NOTE: Each correct selection is worth one point.
Theme colors
Divergent colors
You have a Power BI report that contains a table visual. The visual contains a column.
The column contains whole numbers ranging from of 1 to 20.
You need to use conditional formatting to meet the following requirements:
• Visually compare the values without having to read the text containing the number.
• Show a different format for each distinct value.
• Hide the numeric value of ColumnA.
• Minimize development effort.
Which formatting should you use?
data bars
You have a Power BI workspace.
You need to create two reports that meet the following requirements:
• Report1: Optimized for printing and can be delivered to users via a scheduled email subscription
• Report2: Optimized for dynamic user interactivity
Which format should you use for each report? To answer, select the appropriate options in the answer area.
NOTE: Each correct selection is worth one point.

Power BI paginated (.rdl)
Power Bi (.pbix)
You plan to use Power BI Desktop to create a bug tracking dashboard that will pull data from Analytics in Azure DevOps.
From Power BI Desktop, you need to configure a data connector to authenticate to Azure DevOps. The solution must meet the following requirements:
• Use Analytics views.
• Filter data from the cloud.
Which connector should you use?
OData Feed
You have an organization dimension named DimOrganizations.
You have four related tables as shown in the following exhibit.

Use the drop-down menus to select the answer choice that completes each statement based on the information presented in the graphic.
NOTE: Each correct selection is worth one point.

snowflake
DimOrgSubVertical
You have a Microsoft Excel file in a Microsoft OneDrive folder.
The file must be imported to a Power BI semantic model.
You need to ensure that the semantic model can be refreshed in PowerBi.com.
Which two connectors can you use to connect to the file? Each correct answer presents a complete solution.
NOTE: Each correct selection is worth one point.
Web
SharePoint folder
You have a semantic model that has the permissions shown in the following exhibit.

Use the drop-down menus to select the answer choice that completes each statement based on the information presented in the graphic.
NOTE: Each correct selection is worth one point.

Use Analyze in Excel with
grant the Read permission for
You have a Power BI semantic model that contains four queries named Query 1, Query2. Query3, and Query4.
Query1 loads customer data into the model and is referenced by the other three queries.
You discover that data refresh for the model is slow.
You need to improve the data refresh time. The solution must minimize costs.
What should you do?
Reconfigure Query1 as a dataflow entity.
You have a Power BI semantic model that contains the data sources shown in the following table.

You need to configure the privacy level s of the data sources.
What should you configure for each data source? To answer, select the appropriate options in the answer area.
NOTE: Each correct answer is worth one point.

Private
Organizational
You use Power Query Editor to pull data from a Microsoft SharePoint Online list.
You plan to use Advanced Editor to build a Power Query M formula language query.
You need to create a query that loads the data, expands a column named location, and hides a column named CountryOrRegion from the dataset.
How should you complete the query? To answer, select the appropriate options in the answer area.
NOTE: Each correct answer is worth one point.
Table.ExpandListColumn
Table.RemoveColumns
You need to use Power BI to create a visual that will allow users to compare the sales performance of five sales regions for the current month.
Which visual should you use?
a stacked bar chart
You have a Power BI semantic model that contains a table named Opportunity.
The Opportunity table contains a column named Qualification. The Qualification column contains values between 0 and 1.
You need to build a new measure to score the opportunities on a scale of low. medium, and high.
How should you complete the DAX formula? To answer, select the appropriate options in the answer area.
NOTE: Each correct selection is worth one point.

IF.EAGER
HIGH
MEDIUM
You use Power Query Editor to import three tables named Customers, Address, and Country.
In the source system, not every customer has a related address, but every address has a related country.
You need to merge all the tables into a single query. The solution must optimize query refresh performance.
Which type of join should you use for each merge operation? To answer, drag the appropriate join types to the correct operations. Each join type may be used once, more than once, or not at all. You may need to drag the split bar between panes or scroll to view content.
NOTE: Each correct selection is worth one point.

Left outer
Inner
You create a Power BI report named Summary1.
You discover that Summary1 is slow.
You run Performance analyzer to identify performance metrics for Summary1.
Which two metrics display the execution duration in Performance analyzer? Each correct answer present part of the solution.
NOTE: Each correct answer is worth one point.
DAX Query
Visual display
You use Power Query Editor to preview the data shown in the following exhibit.

You confirm that the data will always start on row 3, and row 3 will always contain the column names.
How should you shape the query? To answer, select the appropriate options in the answer area.
NOTE: Each correct selection is worth one point.

Remove top rows
Use first rows as headers
You have a Power BI semantic model.
You need to create a column that will contain year-over-year (YOY) revenue. The column must contain a ratio of change factor compared to the previous year's monthly revenue.
How should you complete the DAX formula? To answer, select the appropriate options in the answer area.
NOTE: Each correct selection is worth one point.
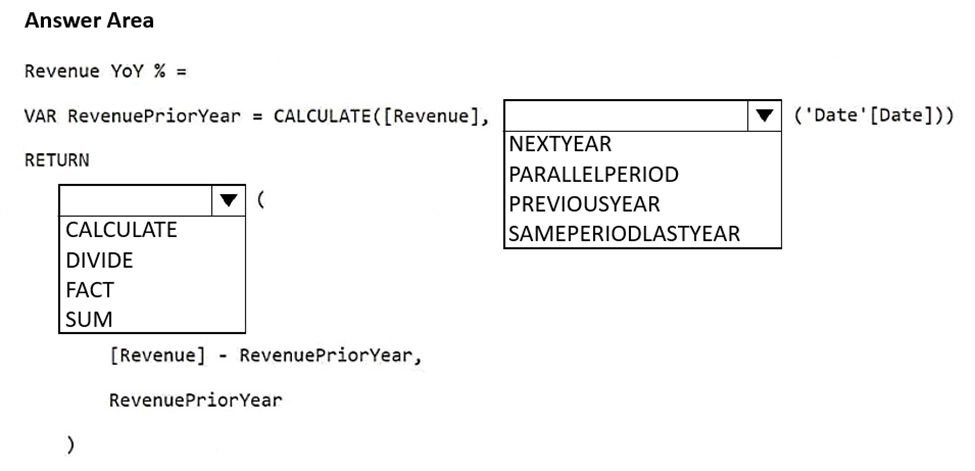
SAMEPERIODLASTYEAR, DIVIDE
You have a Power BI report that contains the table shown in the following exhibit.

The table contains conditional formatting that shows which stores are above, near, or below the monthly quota for returns.
You need to ensure that the table is accessible to consumers of reports who have color vision deficiency.
What should you do?
Change the icons to use a different shape for each color
You have a Power BI semantic model that connects to a streaming data source. The data source is updated frequently.
You need to create a Power BI report that meets the following requirements:
• Supports real-time analytics
• Minimizes performance impact on the data source
• Displays the most recent data without performing a data refresh
Which connectivity mode should you use for the dataset?
push mode
You have a Power BI tenant that contains a workspace. The workspace contains a dataset named datasetA.
You need to build a pivot table report in Microsoft Excel. The report must use datasetA as the data source. The solution must meet the following requirements:
• Ensure that the report can be refreshed to get the latest available data from the Power BI service.
• Ensure that all the visible data in datasetA is available for use in Excel.
What should you do to connect Excel to datasetA, and which element in datasetA will be incompatible with the Excel connection? To answer, select the appropriate options in the answer area.
NOTE: Each correct selection is worth one point.

Select Analyze in Excel
Field parameters
You have a data source that contains a column. The column contains case sensitive data.
You have a Power BI semantic model in DirectQuery mode.
You connect to the model and discover that it contains undefined values and errors.
You need to resolve the issue.
Solution: You add an index key and normalize casing in the data source.
Does this meet the goal?
Yes
You have an on-premises data gateway.
You need to reduce the amount of data sent through the gateway by semantic models that run in import storage mode.
Solution: You increase Automatic page refresh intervals.
Does this meet the goal?
No
You have a Power BI semantic model that contains item, price, and country data. The data is displayed in a report that uses filters.
You need to calculate the average item price for a given country. The solution must support the existing filters.
Which type of quick measure should you use?
Average per category
You create a report by using Microsoft Power BI Desktop.
The report uses data from a Microsoft SQL Server Analysis Services (SSAS) tabular model located on your company's internal network.
You plan to publish the report to the Power BI Service.
What should you implement to ensure that users who consume the report from the Power BI Service have the most up-to-date data from the tabular model?
an On-premises data gateway
You have a Power BI report that contains the table visual shown in the following exhibit.

You need to modify the visual to display as shown in the following exhibit.

How should you configure the visual? To answer, select the appropriate options in the answer area.
NOTE: Each correct selection is worth one point.

Matrix
Set Switch values to rows to On
You have a data source that contains a column. The column contains case sensitive data.
You have a Power BI semantic model in DirectQuery mode.
You connect to the model and discover that it contains undefined values and errors.
You need to resolve the issue.
Solution: You implicitly convert the values into the required type.
Does this meet the goal?
No
You have a data source that contains a column. The column contains case sensitive data.
You have a Power BI semantic model in DirectQuery mode.
You connect to the model and discover that it contains undefined values and errors.
You need to resolve the issue.
Solution: You change the semantic model mode.
Does this meet the goal?
No
You have a data source that contains a column. The column contains case sensitive data.
You have a Power BI semantic model in DirectQuery mode.
You connect to the model and discover that it contains undefined values and errors.
You need to resolve the issue.
Solution: You normalize casing in the source query or Power Query Editor.
Does this meet the goal?
Yes
You use Power Query Editor to load two queries named Query1 and Query2.
Query1 results in the following error.

Query2 results in the following error.

Which type of error occurred for each query? To answer, drag the appropriate error types to the correct queries. Each error type may be used once, more than once, or not at all. You may need to drag the split bar between panes or scroll to view content.
NOTE: Each correct selection is worth one point.

Step-level
Cell-level
You have a Power BI model that contains two tables named Sales and Date. The Sales table relates to the Date table by using a many-to-one relationship. The Sales table contains the following columns:
• Date
• Product
• SalesAmount
You need to create a DAX measure for a rolling 31-day sales total that will return the total sales amount for a selected date and the previous 30 days.
Which DAX expression should you use?
CALCULATE(SUM(Sales[SalesAmount]), DATESBETWEEN(Date[Date], Max('Date'[Date])-30, Max('Date'[Date])))
You have a Power BI semantic model that contains two tables as shown in the following exhibit.

Use the drop-down menus to select the answer choice that completes each statement based on the information presented in the graphic.
NOTE: Each correct selection is worth one point.

Single
define the relationship is active
You are designing the data model for a Power BI semantic model.
You have the following tables in the star schema.

Which table is the fact table of the star schema, and which column in the Patient table is the surrogate key of the star schema? To answer, select the appropriate options in the answer area.
NOTE: Each correct selection is worth one point.

Test Result
Patient Key
You have a Power BI report that contains one visual.
You need to provide users with the ability to change the visual type without affecting the view for other users.
What should you do?
From Report settings, select Personalize visuals
You use Power Query Editor to preview a query that contains sales order data in the following columns:
• Tax Amount
• Sales Order ID
• Freight Amount
• Subtotal Amount
• Total Item Quantity
The Sales Order ID column uniquely identifies each sales order. The Subtotal Amount and Total Item Quantity columns are always populated, but the Tax Amount and Freight Amount columns are sometimes null when an order has no associated amount.
You need to query the data to identify the following metrics by month:
• The average item quantity per order
• The average freight amount per order
• The maximum item quantity per order
How should you modify the query?
In the Freight Amount column, replace the null values with 0
You have a Power BI report. The report contains a line chart that displays sales data for several regions.
You need to add an element to the report that will enable users to filter the sales data to include only a selected region.
Which two elements achieve the goal? Each correct answer presents a complete solution.
NOTE: Each correct selection is worth one point.
a slicer visual
a drillthrough filter
You have a Power BI report that contains the visuals shown in the following table.

You need to modify the location of each visual.
What should you modify for each visual?
the position
You have a Power BI model that contains a table named Employees. The table contains the following columns:
• Employee ID
• First Name
• Last Name
• Department
• Salary
Each employee is uniquely identified by using Employee ID.
You need to create a DAX measure that will calculate the average salary of all the employees in the sales department.
Which DAX expression should you use?
CALCULATE(AVERAGE(‘Employees’[Salary]), ‘Employees’[Department] = “Sales”)
You have the CSV file shown in the following table.

You use Power Query Editor to preview the data in the file.
You need to transform the data to meet the following requirements:
• The first column must contain the month.
• The second column must contain the year.
• The third column must contain the order amount for the month and year.
Which transformation should you use first?
unpivot
You have a folder that contains 50 JSON files.
You need to use Power BI Desktop to make the metadata of the files available as a single dataset. The solution must NOT store the data of the JSON files.
Which type of data source should you use, and which transformation should you perform? To answer, select the appropriate options in the answer area.
NOTE: Each correct selection is worth one point.

Folder
Delete the Content column
You have a PBIX file that imports data from a Microsoft Excel data source stored in a file share on a local network.
You are notified that the Excel data source was moved to a new location.
You need to update the PBIX file to use the new location.
What are three ways to achieve the goal? Each correct answer presents a complete solution.
NOTE: Each correct selection is worth one point.
From the Data source settings in Power BI Desktop, configure the file path.
From Power Query Editor, use the formula bar to configure the file path for the applied step.
From Advanced Editor in Power Query Editor, configure the file path in the M code
You have a Power BI query named Expenses that imports the following data.

Users only use the date portion of the TransactionDate value when performing data analysis.
You need to minimize the model size without affecting the analysis.
Which two actions should you perform? Each correct answer presents part of the solution.
NOTE: Each correct selection is worth one point.
Change the data type of the TransactionDate column to Date.
Remove the PostDate column
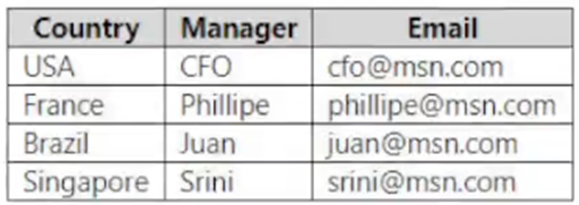
You have the Power BI data model shown in the following exhibit.
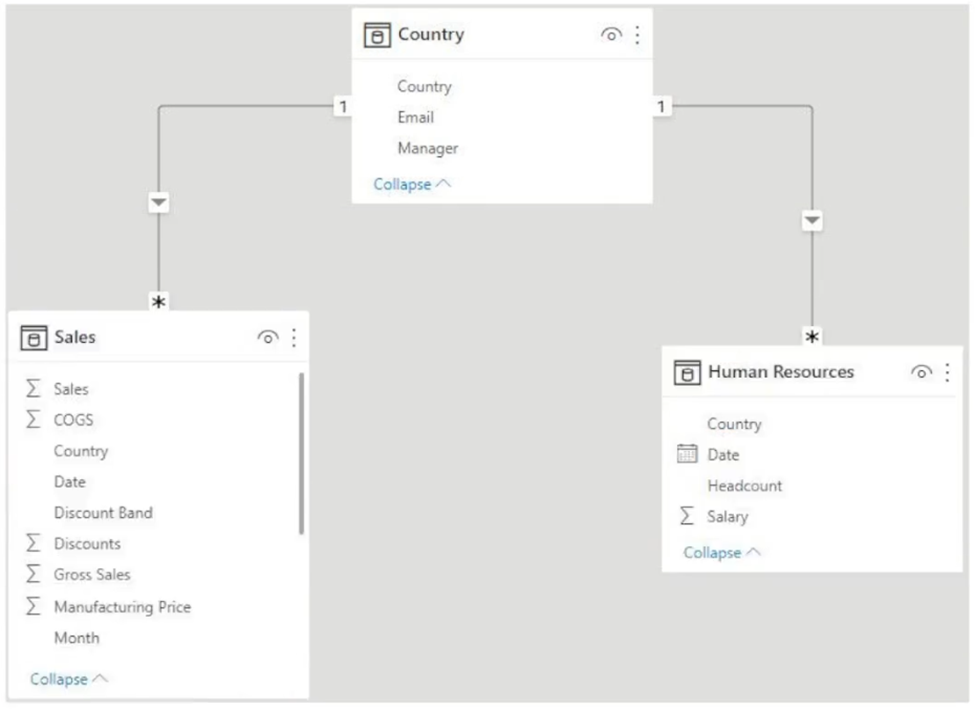
The Country table contains the following data.
You create two row-level security (RLS) roles named Manager and CFO.
You plan to publish the dataset to the Power BI service.
You need to create DAX expressions for the RLS filters. The solution must meet the following requirements:
• Each manager must see only the data in the Sales and Human Resources tables for their own country.
• The CFO must be prevented from seeing the data in the Human Resources table.
• The CFO must see the sales data of all countries.
How should you complete the DAX expressions to meet the requirements? To answer, drag the appropriate expressions to the correct targets. Each expression may be used once, more than once, or not at all. You may need to drag the split bar between panes or scroll to view content.
NOTE: Each correct selection is worth one point.
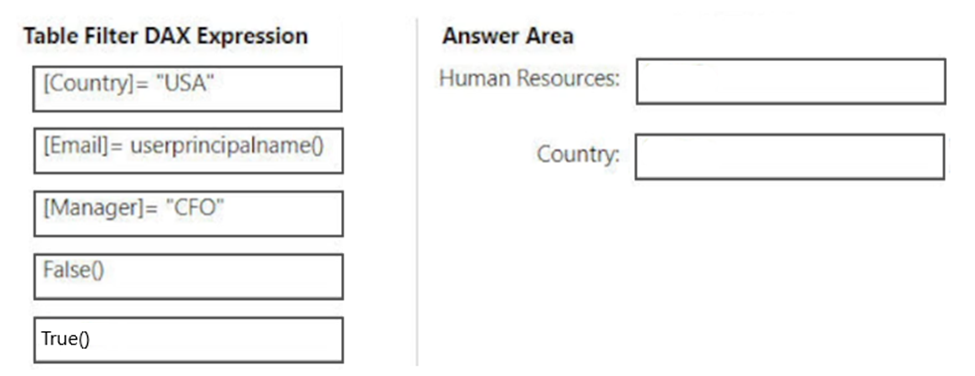
[Manager]= “CFO”
[Email]= userprincipalname()
You are building a financial report by using Power BI.
You have a table named financials that contains a column named Date and a column named Sales.
You need to create a measure that calculates the relative change in sales as compared to the previous quarter.
How should you complete the measure? To answer, select the appropriate options in the answer area.
NOTE: Each correct selection is worth one point.
Hot Area:

CALCULATE
DATEADD
DIVIDE
You have a Power BI report that contains three pages. The pages are used to analyze sales across various countries.
You add a slicer named Country to each page of the report.
You need to configure the report to meet the following requirements:
• When a user selects a country on the first page, the report must filter the other pages.
• The second and third pages must display only the filtered results.
Which task should you perform for each requirement? To answer, drag the appropriate task to the correct requirement. Each task may be used once, more than once, or not at all. You may need to drag the split bar between panes or scroll to view content.
NOTE: Each correct selection is worth one point.
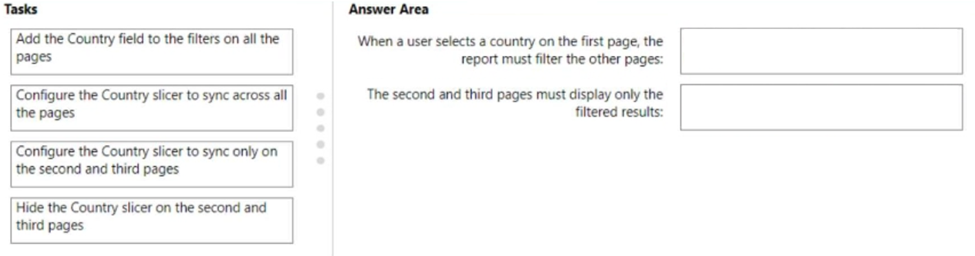
Configure the Country slicer to sync across all the pages
Hide the Country slicer on the second and third pages
You have a Power BI table named Customer that contains a field named Email Address.
You discover that multiple records contain the same email address.
You need to create a calculated column to identify which records have duplicate email addresses.
How should you complete the DAX expression for the calculated column? To answer, drag the appropriate values to the correct targets. Each value may be used once, more than once, or not at all. You may need to drag the split bar between panes or scroll to view content.
NOTE: Each correct selection is worth one point.
Select and Place:
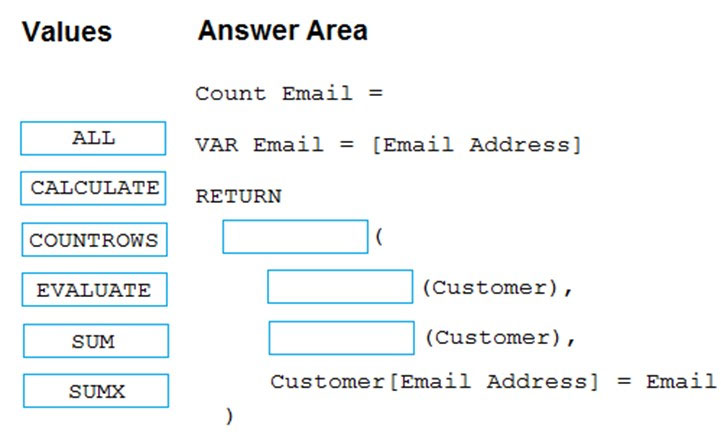
CALCULATE
COUNTROWS
ALL
You are modifying a Power BI model by using Power BI Desktop.
You have a table named Sales that contains the following fields.
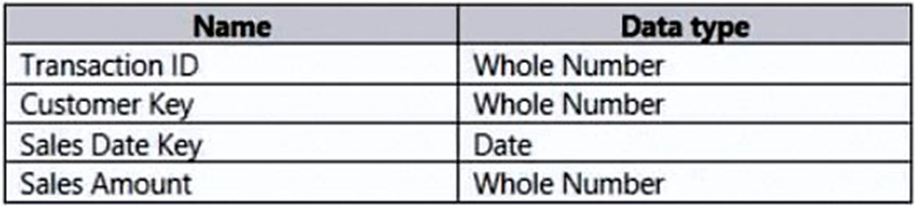
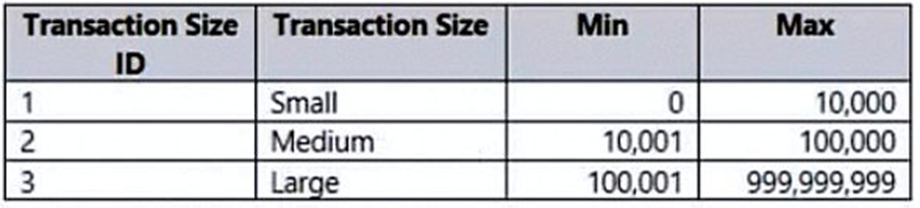
You have a table named Transaction Size that contains the following data.
You need to create a calculated column to classify each transaction as small, medium, or large based on the value in Sales Amount.
How should you complete the code? To answer, drag the appropriate values to the correct targets. Each value may be used once, more than once, or not at all.
You may need to drag the split bar between panes or scroll to view content.
NOTE: Each correct selection is worth one point.
Select and Place:
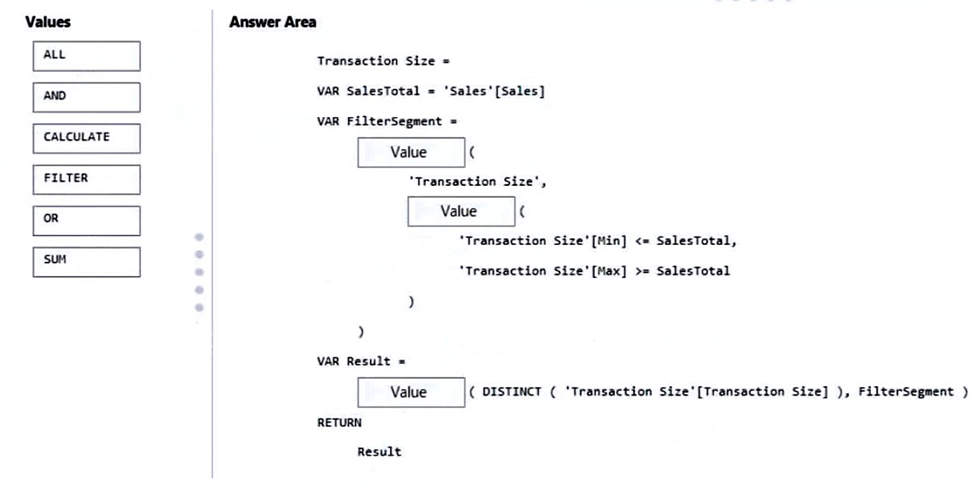
FILTER
AND
CALCULATE
You have more than 100 published datasets.
Ten of the datasets were verified to meet your corporate quality standards.
You need to ensure that the 10 verified datasets appear at the top of the list of published datasets whenever users search for existing datasets.
What should you do?
Certify the datasets
You have a project management app that is fully hosted in Microsoft Teams. The app was developed by using Microsoft Power Apps.
You need to create a Power BI report that connects to the project management app.
Which connector should you select?
Dataverse
You need to use AI insights to add a column of enhanced data based on the customer feedback. The solution must identify the following:
• What the customers most often provide feedback about
• Whether the customers like your company’s product
• The language of the feedback
Which AI insights service should you use for each output? To answer, drag the appropriate services to the correct outputs. Each service may be used once, more than once, or not at all. You may need to drag the split bar between panes or scroll to view content.
NOTE: Each correct selection is worth one point.
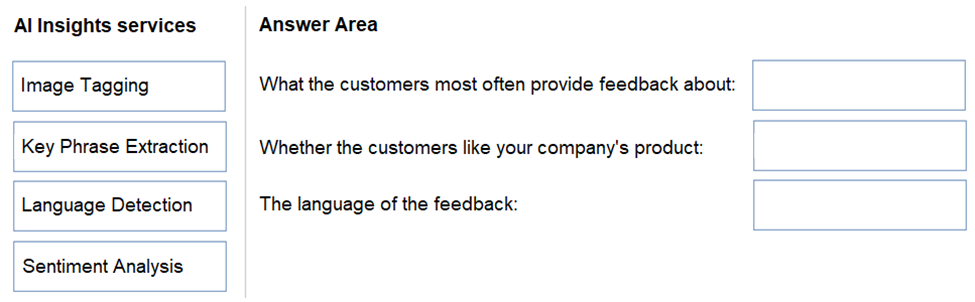
Key Phrase Extraction
Sentiment Analysis
Language Detection
You are creating a quick measure as shown in the following exhibit.

You need to create a monthly rolling average measure for Sales over time.
How should you configure the quick measure calculation? To answer, select the appropriate options in the answer area.
NOTE: Each correct selection is worth one point.

Total Sales
Date
Months
You are using the key influencers visual to identify which factors affect the quantity of items sold in an order.
You add the following fields to the Explain By field:
✑ Customer Country
✑ Product Category
✑ Supplier Country
✑ Sales Employee
✑ Supplier Name
✑ Product Name
✑ Customer City
The key influencers visual returns the results shown in the following exhibit.
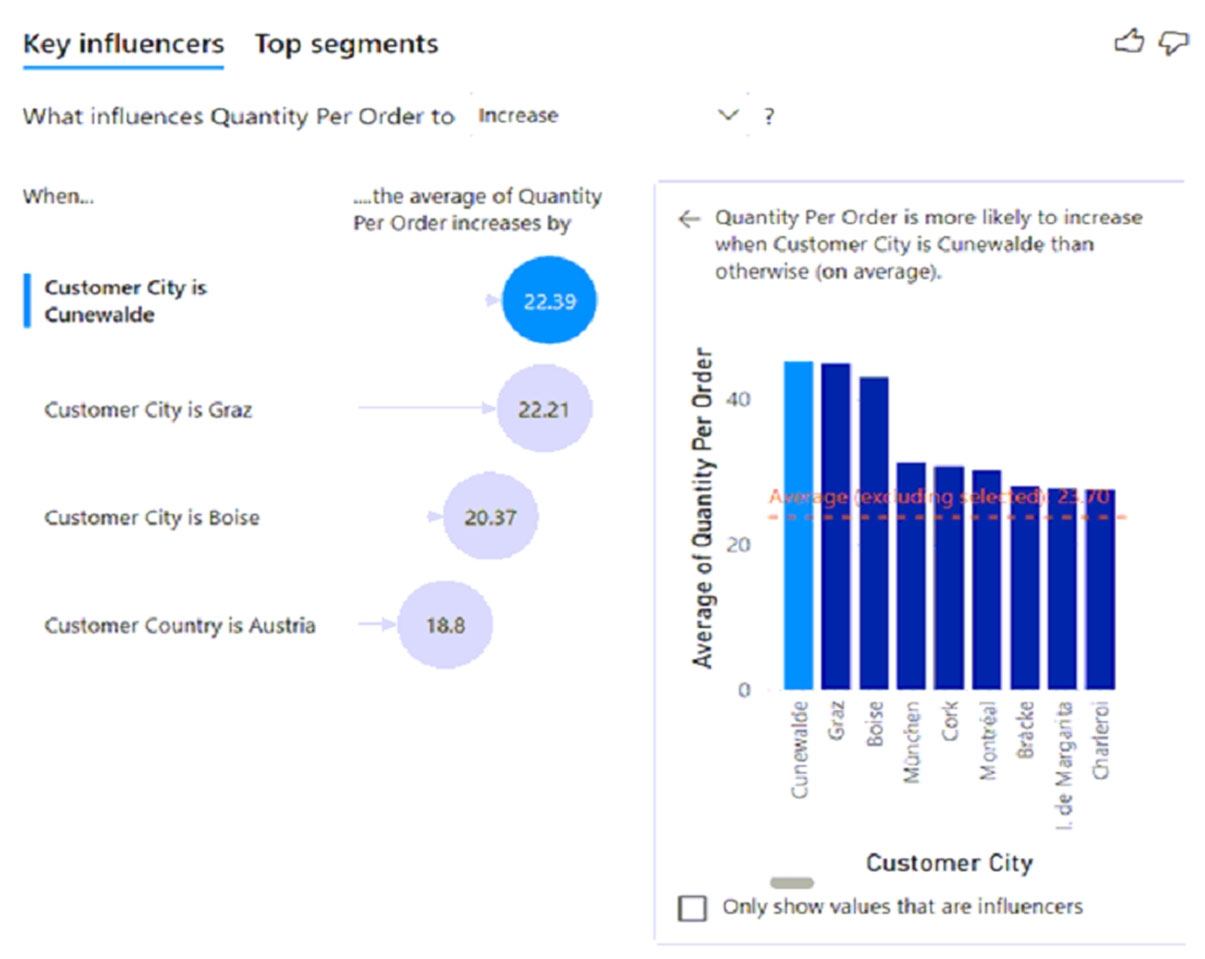
What can you identify from the visual?
Customers in Austria order 18.8 more units than the average order quantity.
You have a Power BI dashboard named DashboardA that contains a tile named TileA. TileA contains a treemap visual from a report named ReportA.
You need to provide the users of DashboardA with additional tiles that relate to the contents of TileA.
Which three actions should you perform in sequence? To answer, move the appropriate actions from the list of actions to the answer area and arrange them in the correct order.
Select and Place:
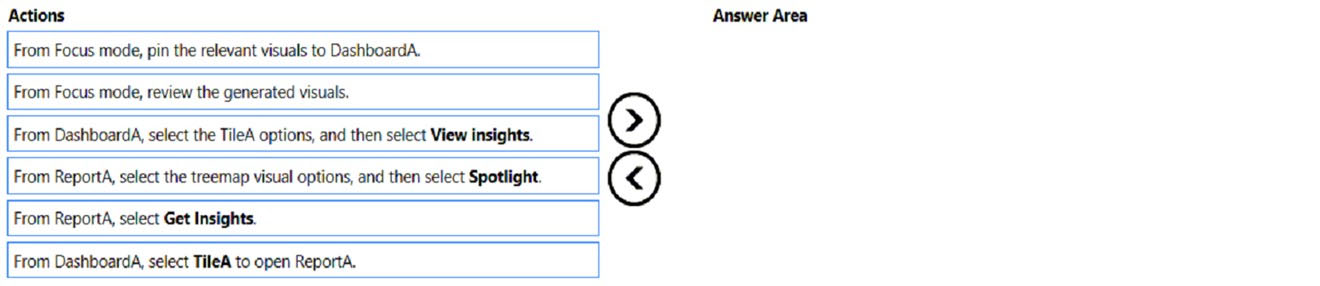
From DashboardA, select the TileA options, and then select View Insights
From Focus mode, review the generated visuals
From Focus mode, pin the relevant visuals to DashboardA
You need to configure access for the sales department users. The solution must the meet the security requirements.
What should you do?
Distribute an app to the users in the Azure Active Directory group of the sales department
You have a Power BI report that contains a visual. The visual contains a measure.
You need to ensure that the report meets the following requirements:
• All values must be set to two decimal places.
• All negative values must be displayed in red font and parentheses.
Which two actions should you perform? Each correct answer presents part of the solution.
NOTE: Each correct selection is worth one point.
Configure the measure to use a custom format.
For the visual, apply conditional formatting to the font color.
You have a Power BI report that will be rendered on a vertical display.
You need to maximize the portion of the screen area used by the report.
What should you do?
From the Canvas settings of Power BI Desktop, set a custom width and height
You have a Power BI dataset named Finance that is hosted in a Power BI workspace.
The finance team at your company is NOT currently a member of any Power BI workspace roles.
You need to enable the finance team to use Microsoft Excel to analyze the Finance dataset.
What should you do?
Grant the finance team build permissions to the Finance dataset
You are enhancing a Power BI model that has DAX calculations.
You need to create a measure that returns the year-to-date total sales from the same date of the previous calendar year.
Which DAX functions should you use? To answer, select the appropriate options in the answer area.
NOTE: Each correct selection is worth one point.
Hot Area:
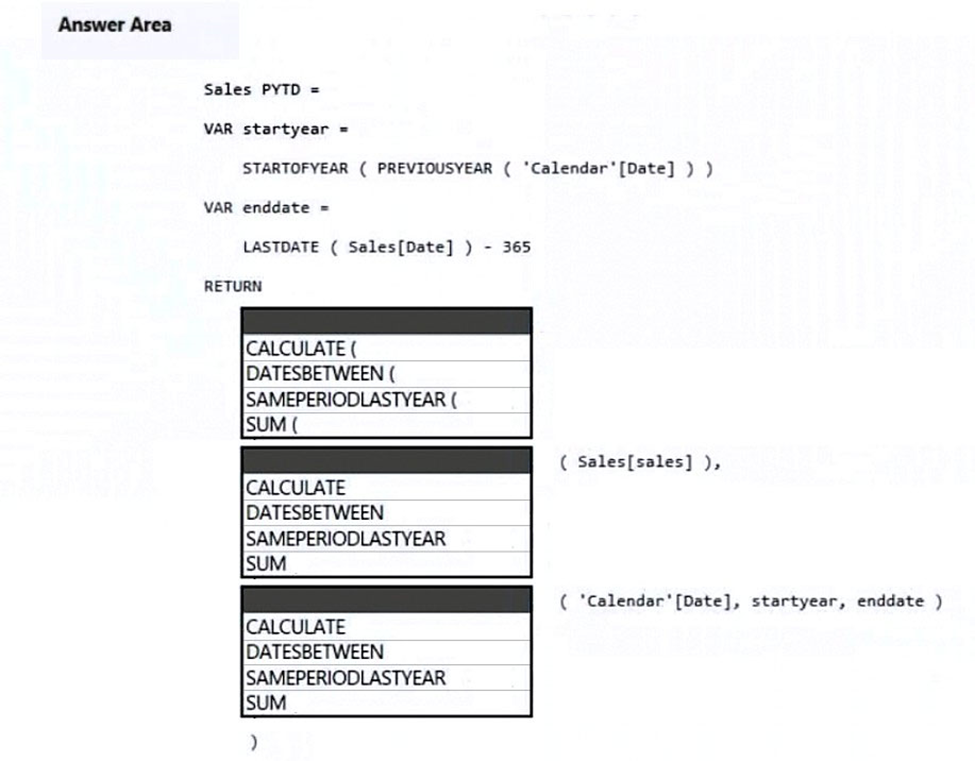
CALCULATE
SUM
SAMEPERIODLASTYEAR
You need to create a calculated column to display the month based on the reporting requirements.
Which DAX expression should you use?
FORMAT('Date'[date],"MMM YYYY")
You maintain a Power BI workspace that contains a supplier quality dashboard. The dashboard contains 10 card visuals, two map visuals and five bar chart visuals.
The dashboard mobile layout is shown in the exhibit. (Click the Exhibit tab.)
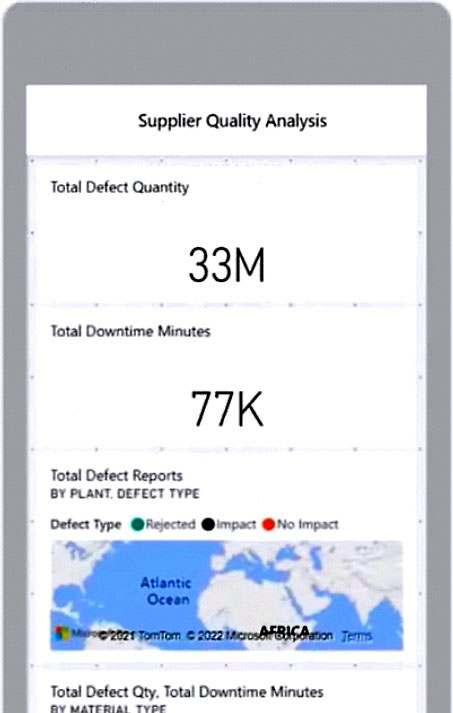
You need to modify the dashboard mobile layout to meet the following requirements:
✑ Only show single-value visuals.
✑ Minimize scrolling.
What should you do?
Decrease the size of the card visuals. Remove the map and bar chart visuals.
You have the Azure SQL databases shown in the following table.

You plan to build a single PBIX file to meet the following requirements:
• Data must be consumed from the database that corresponds to each stage of the development lifecycle.
• Power BI deployment pipelines must NOT be used.
• The solution must minimize administrative effort.
What should you do? To answer, select the appropriate options in the answer area.
NOTE: Each correct selection is worth one point.

One parameter
Text
You have a Power BI workspace that contains a dataset, a report, and a dashboard. The following groups have access:
✑ External users can access the dashboard.
✑ Managers can access the dashboard and a manager-specific report.
✑ Employees can access the dashboard and a row-level security (RLS) constrained report.
You need all users, including the external users, to be able to tag workspace administrators if they identify an issue with the dashboard. The solution must ensure that other users see the issues that were raised.
What should you use?
comments
You create a dashboard by using the Microsoft Power BI Service. The dashboard contains a card visual that shows total sales from the current year.
You grant users access to the dashboard by using the Viewer role on the workspace.
A user wants to receive daily notifications of the number shown on the card visual.
You need to automate the notifications.
What should you do?
Create a subscription
You need create a date table in Power BI that must contain 10 full calendar years, including the current year.
How should you complete the DAX expression? To answer, select the appropriate options in the answer area.
NOTE: Each correct selection is worth one point.
Select and Place:
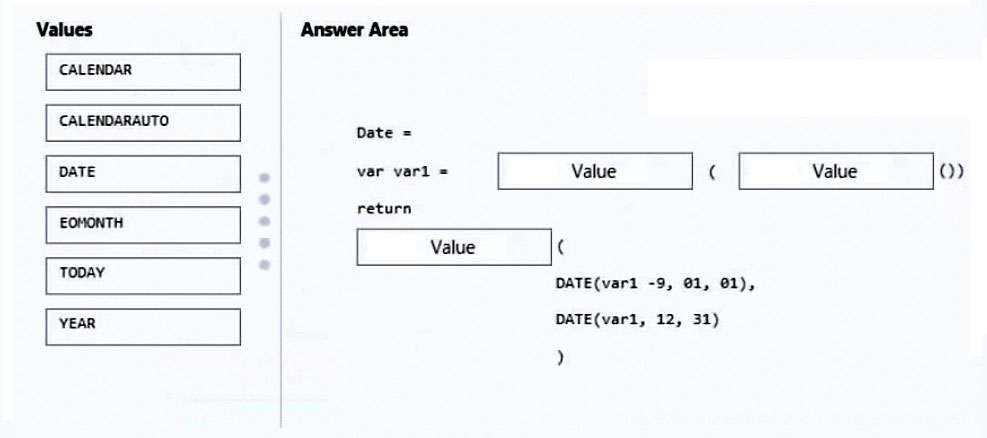
Year
Today
Calendar
Once the profit and loss dataset is created, which four actions should you perform in sequence to ensure that the business unit analysts see the appropriate profit and loss data? To answer, move the appropriate actions from the list of actions to the answer area and arrange them in the correct order.
Select and Place:
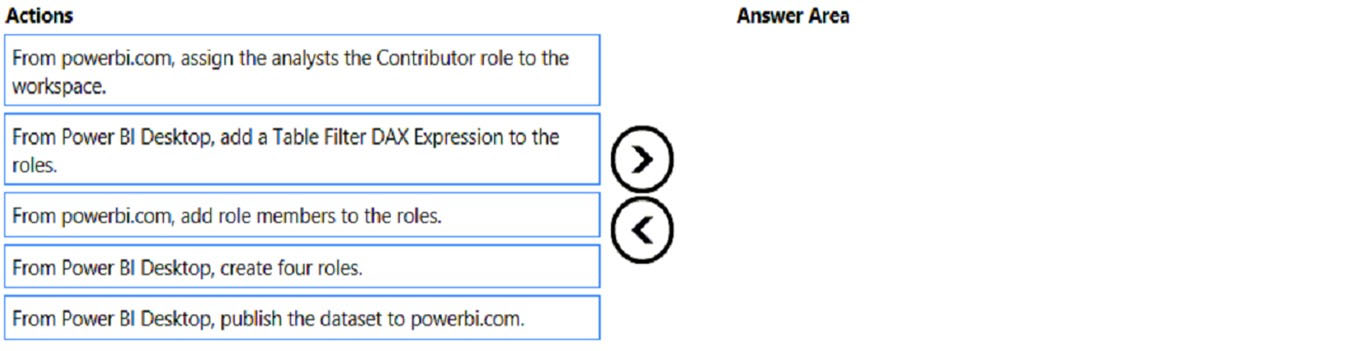
From Power BI Desktop, create four roles
From Power BI Desktop, add a Table Filter DAX Expression to the roles
From Power BI Desktop, publish the dataset to powerbi.com
From powerbi.com, add role members to the roles
You have the dashboard shown in the following exhibit.

You need to modify the dashboard to display as shown in the following exhibit.

What should you do?
Create and apply a custom dashboard theme
You have a Power BI report that imports a date table and a sales table from an Azure SQL database data source. The sales table has the following date foreign keys:
✑ Due Date
✑ Order Date
✑ Delivery Date
You need to support the analysis of sales over time based on all the date foreign keys.
Solution: From Power Query Editor, you rename the date query as Due Date. You reference the Due Date query twice to make the queries for Order Date and
Delivery Date.
Does this meet the goal?
Yes
You have a report page that contains the visuals shown in the following exhibit.
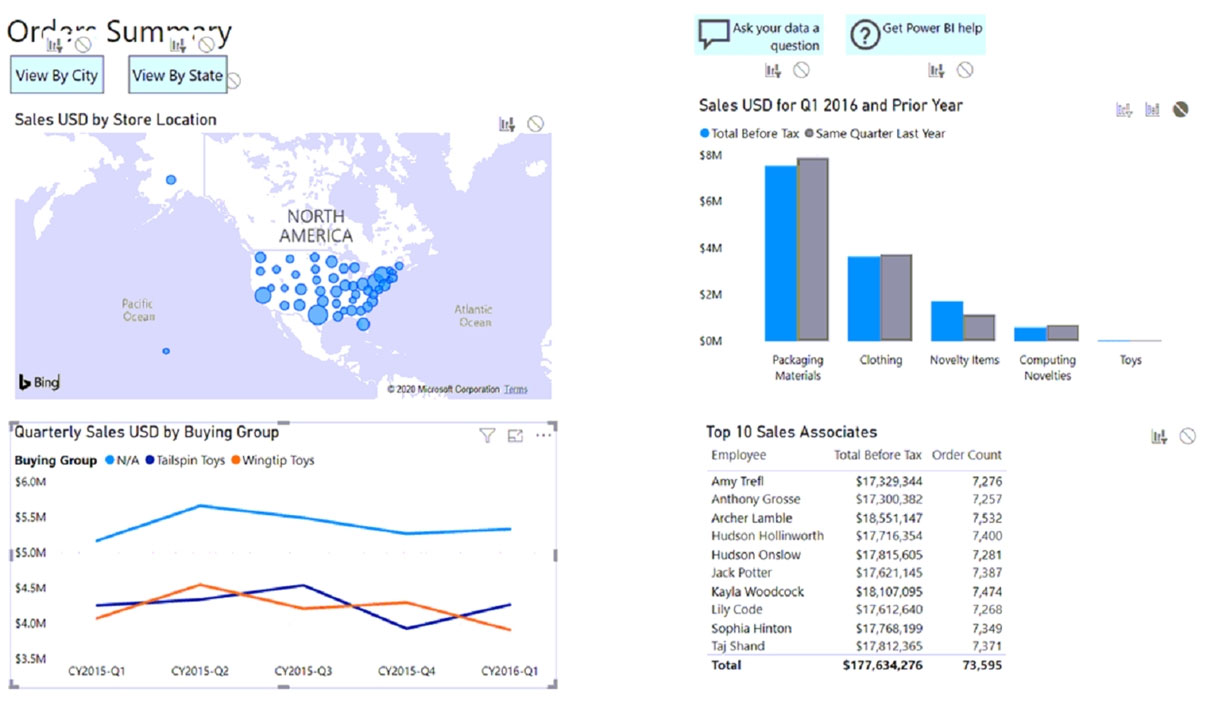
Use the drop-down menus to select the answer choice that completes each statement based on the information presented in the graphic.
NOTE: Each correct selection is worth one point.
Hot Area:
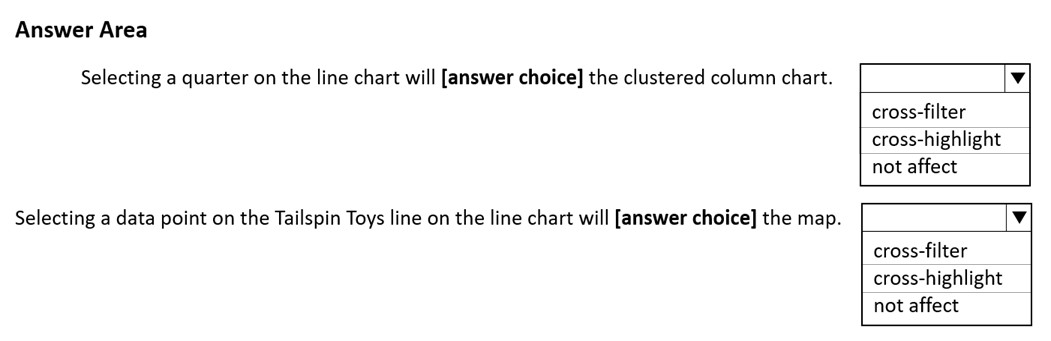
not affect
cross-filter
After you answer a question in this section, you will NOT be able to return to it. As a result, these questions will not appear in the review screen.
From Power Query Editor, you profile the data shown in the following exhibit.

The IoT GUID and IoT ID columns are unique to each row in the query.
You need to analyze IoT events by the hour and day of the year. The solution must improve dataset performance.
Solution: You split the IoT DateTime column into a column named Date and a column named Time.
Does this meet the goal?
Yes
Your company has employees in 10 states.
The company recently decided to associate each state to one of the following three regions: East, West, and North.
You have a data model that contains employee information by state. The model does NOT include region information.
You have a report that shows the employees by state.
You need to view the employees by region as quickly as possible.
What should you do?
Create a new group on the state column and set the Group type to List
You have a Power BI workspace that contains several reports.
You need to provide a user with the ability to create a dashboard that will use the visuals from the reports.
What should you do?
Add the user as a member of the workspace
You plan to create the chart shown in the following exhibit.
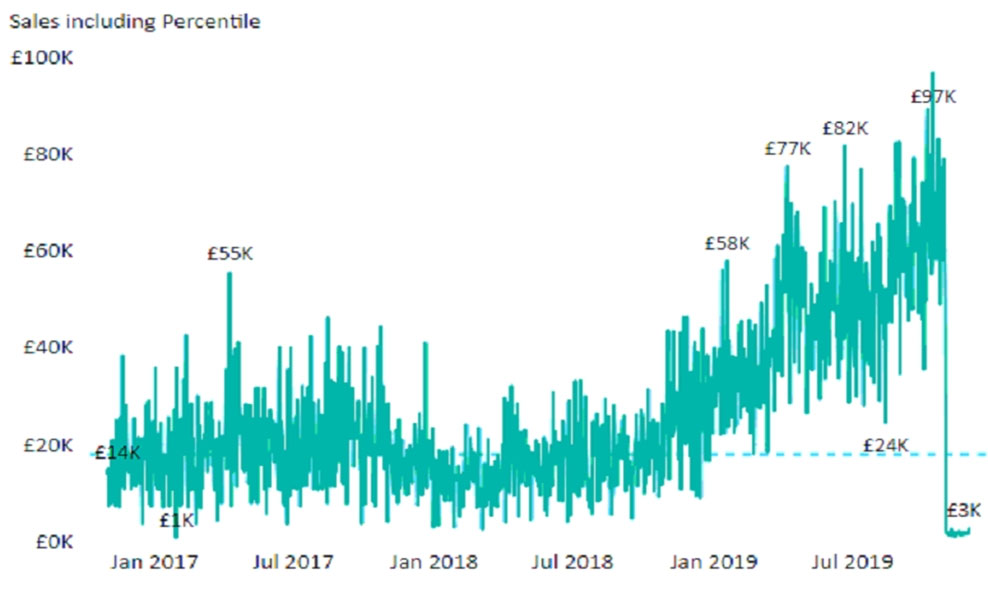
How should you create the dashed horizontal line denoting the 40th percentile of daily sales for the period shown?
Add a new percentile line that uses Total Sales as the measure and 40% as the percentile
You have a Power BI data model that contains two tables named Products and Sales.
A one-to-many relationship exists between the tables.
You have a report that contains a report-level filter for Products.
You need to create a measure that will return the percent of total sales for each product. The measure must respect the report-level filter when calculating the total.
How should you complete the DAX measure? To answer, drag the appropriate DAX functions to the correct targets. Each function may be used once, more than once, or not at all. You may need to drag the split bar between panes or scroll to view content.
NOTE: Each correct selection is worth one point.

CALCULATE ALLSELECTED