Module 10
1/20
There's no tags or description
Looks like no tags are added yet.
Name | Mastery | Learn | Test | Matching | Spaced | Call with Kai |
|---|
No analytics yet
Send a link to your students to track their progress
21 Terms
Linear regression
A method that is used for analyzing how the variation in one variable can explain the variation in another variable.
Dependent variable (Y)
This is the variable we want to explain its variation
Independent variable (X)
This is the variable used to explain the variation of Y
Simple linear regression
In simple linear regression we assume a linear relationship exists between the dependent and independent variables
Line of best fit
With regression, we can graph the relationship between the variables and graph it using the line of best fit, which is a line that best fits the observations, this helps visualizes the relationship.
This line of best fit is the line the minimizes the sum of the squared critical distances between the observation and the regression line (Sum of squared errors (SSE)). This is also known as the least squares criterion.
Cross-section Regression
A cross-sectional regression is a type of regression analysis used to examine the relationship between variables at a single point in time across multiple entities, such as different companies, countries, or assets.
Time Series Regression
A time-series regression is a statistical method used to analyze the relationship between variables over time for a single entity, such as a company, market index, or economic indicator. It examines how a dependent variable (like stock price or GDP) is influenced by one or more independent variables (such as interest rates or inflation) across different time periods.
Assumptions for linear regression
Linearity: The relationship between X and Y is linear, which implies the independent variable (X) is not random. To check this assumption, the error terms (known as residuals) when plotted against the independent variable should be random and not display any patterns. If they show patterns the relationship is not linear.
Normality assumption: The error term is normally distributed, however this does not mean that the independent and dependent variable need to come from a normal distribution. To detect violation, the histogram for the error term is not bell shaped and has skewness.
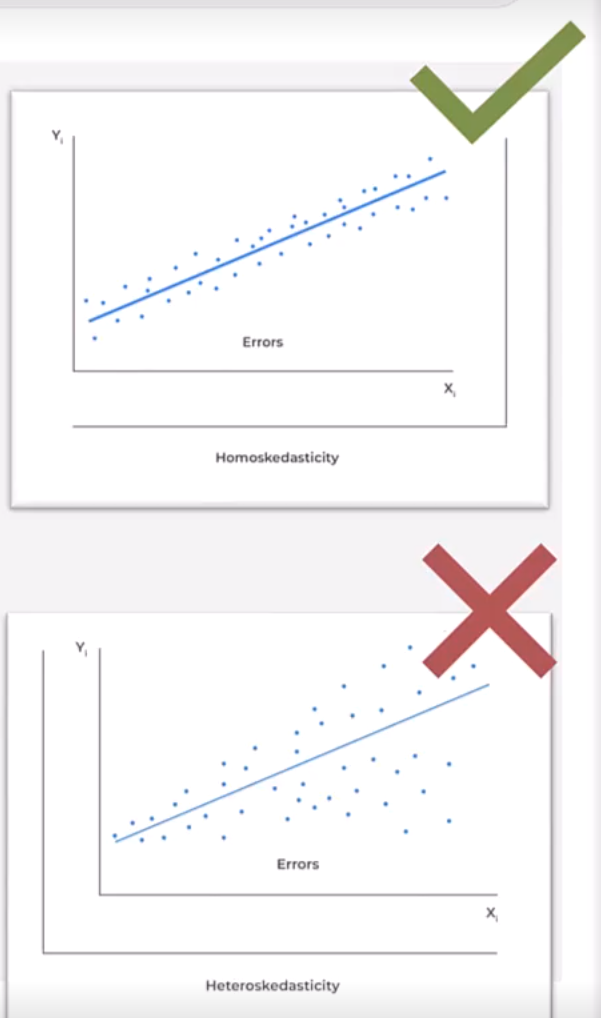
Homoscedasticity Assumption: The variance of the error term is constant for all observations, known as homoscedasticity. To determine violation, you will see the residuals increase as the predicted values increase, which is known as heteroscedasticity (see graph).
Independence Assumption: The observation X and Y are independent of each other
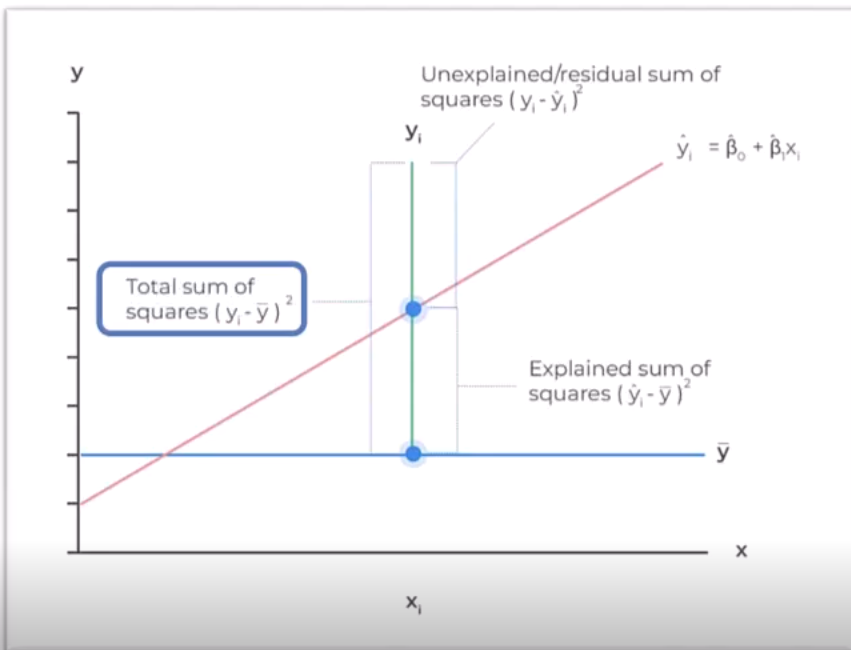
Sum of Squares Total
A measure of the total variation of the dependent variable.
SST = Explained Variation (SSR) + Unexplained Variation (SSE)
Explained variation SSR is the green line below the red line, this is the variation explained
Unexplained variation SSE is the green line above the red line, we need to explain this using the predicted y-value.
Total gives you the sum of squares total
Coefficient of Determination
Its the percentage of the total variability explained by the model. R2 lies between 0-1, a higher R2 means the model explains variability better
F-Test
The F-test determines how effectively a group of independent variables explain the variation of the dependent variable; a higher F-test suggests the model does a good job of explaining the variation in the dependent variable
The null hypothesis: b1 = 0 (Slope is 0, no linear relationship between X and Y)
Alternative hypothesis: b1 =/ 0 (Slope is other than 0, some sort of relationship, positive or negative,e between Y and X)
To calculate the F-test, you need
Total number of observations (n)
Total number of independent variables (k)
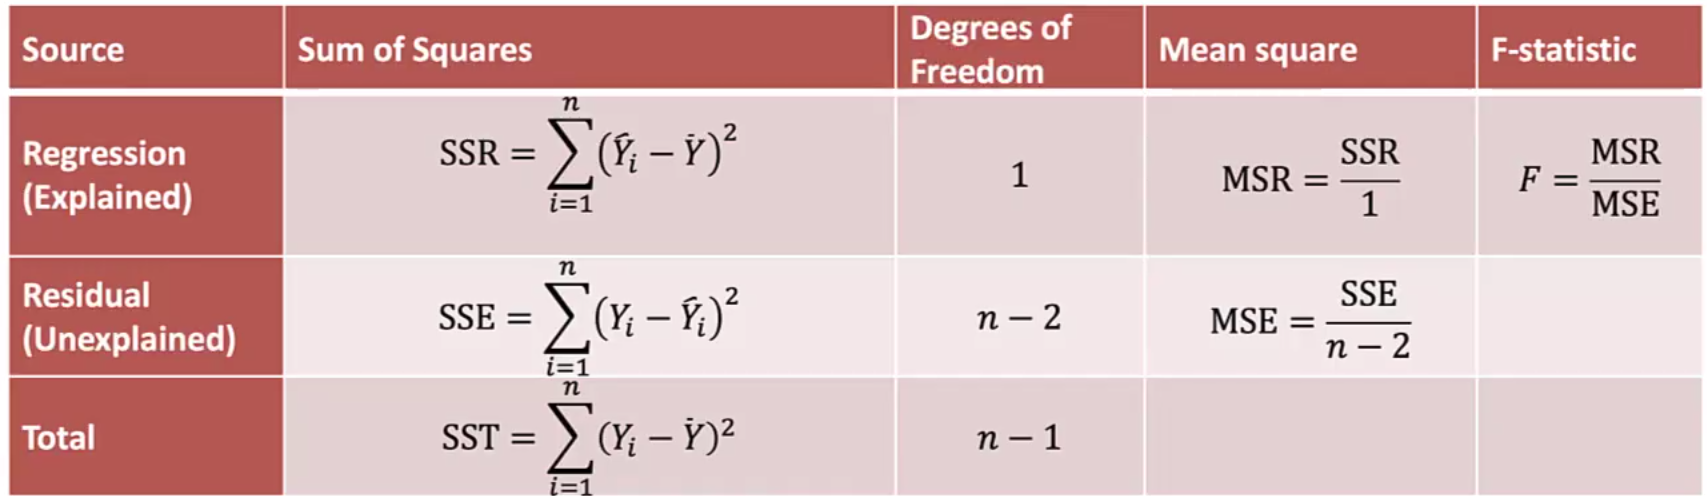
SSE and SSR, which we use to calculate MSE and MSR
F Statistic = MSR / MSE
Reject the null hypothesis if Fvalue > Fcritical
Standard Error of Estimate (SEE or Se)
Measures the distance between observed dependent variables and the dependent variables predicted by the regression model, measures the fit of the regression line. The smaller the SEE, the better the fit
Hypothesis tests of Regression Coefficients
State the hypothesis (where b1 the slope is 0 or not, this is two sided, we can also do greater or less than for one sided test)
Identify the test-statistic
State the level of significance
State the decision rule
Calculate the test statistic and make a decision
Correlation testing and Linear regression model
The test statistic value for linear regression model will give the same value for a pairwise correlation as these two tests are related.
Dummy Variables
These are known as indicator variables or binary variables, which are used in regression analysis to represent categorical data with two or more categories. Used for qualitative information that requires numerical input.
Analysis of Variance (ANOVA)
A statistical procedure used to partition the total variation of a variable into components that can be ascribed to different sources.
It is used to determine the effectiveness of the independent variable in explaining the variation of the dependent variable
ANOVA Table
F test and t-test for hypothesis testing
The F-Statistic is the squared term of the t-statistic for the slope of coefficient, meaning it infers the same thing as the t-test. Both tests can help hypothesis testing for the slope or intercept coefficient.
Confidence Interval / Prediction interval
This is an interval for a predicted value of the dependent variable
How do we deal with regression if either the dependent or independent variable is not linear
We can transform these types of models using the following transformations
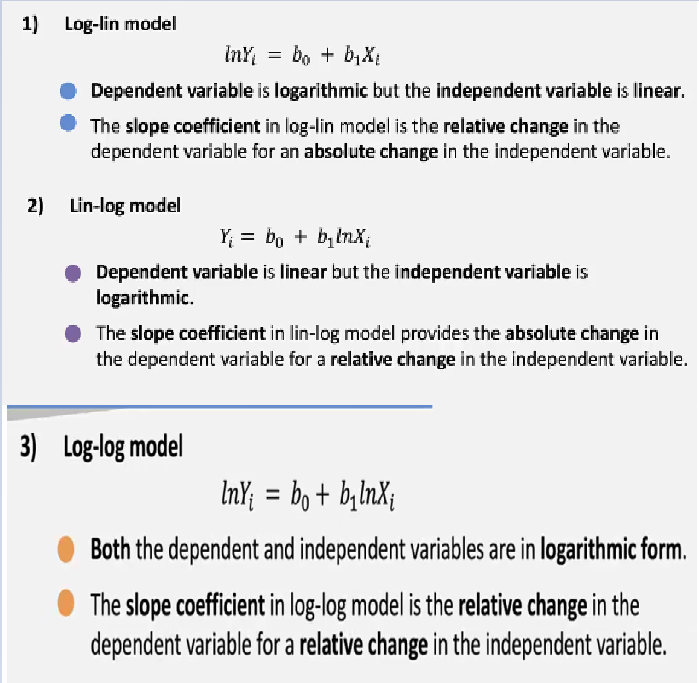
Log-linear model
Dependent variable is logarithmic, but the independent variable is linear
Linear-log model
Dependent variable is linear but the independent variable is logarithmic
Log-log model
Both the independent and independent variable are in logarithmic form
How do we know to select the correct functional form?
Coefficient of determination (R2): A higher value is better
F-Statistic: A high value is better
Standard error of estimate (Se): a lower value is better
Look at the residuals, they should be random and uncorrelated for the model
These are some measure to see if the model is good, or if transformations may be needed and how you can test if after the transformation if the model improved.