Ap HUG Unit 1
1/112
Earn XP
Description and Tags
self study
Name | Mastery | Learn | Test | Matching | Spaced | Call with Kai | Chat |
|---|
No analytics yet
Send a link to your students to track their progress
113 Terms
What is Unit 1 all about?
Understanding maps & map projection, spatial patterns and concepts of data & how data is collected, scales of analysis on maps, and how humans interact with the environment
What cannot be depicted on maps?
relative concepts related to spatial patterns (Relative direction & distance)
What will always happen when attempting to represent a 3D object onto a 2D surface/map?
Distortion of some kind will always happen - always some kind of lie
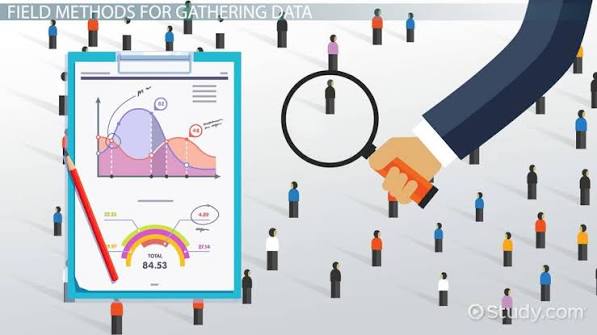
Why do geographers gather all kinds of data?
Because it drives decision making
What do you often have to define on the AP test?
The scale of the map (Scales of analysis)
What is one concept that Geographers question?
Why certain spatial patterns exist
Why does a region exist?
No matter how big it is, a region exists because of some shared characteristic among the people who lived there - geographers often use more than one type of regional unit to define a region
What are often subjects of disputes between nations?
The boundaries of regions or areas
What happens to the scale of analysis when zooming in on the map (showing more detail)?
The scale of analysis is larger
What does understanding maps represent in Human Geography?
Is represents the heart of human geography
Spatial patterns
How and where different geographic features occur on the Earth’s surface
How many different kinds of spatial patterns are there? `
4 kinds of spatial patterns

Absolute Distance - Spatial pattern 1
Distance that can be measured in feet, miles, kilometers, etc
What is an example of absolute distance?
Example: How far away a restaurant is from you in exact miles
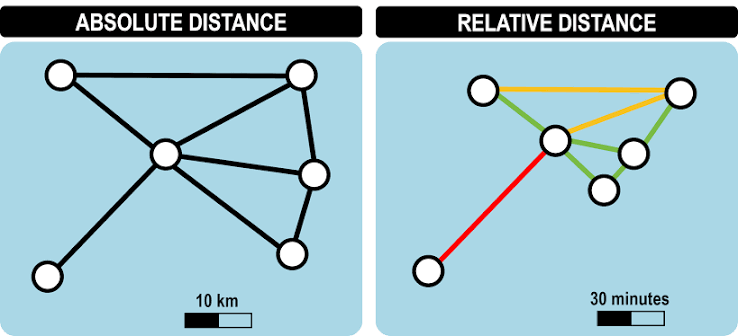
Relative Distance:
A different form of absolute distance that measures social, cultural ,economic, or political differences of similarities between two locations - can be measured in time (hours, minutes, etc)
Example of relative distance?
two locations may be close together from a distance perspective, but the culture of the area could be vastly different
Example: Minneapolis & Twin Cities, MN
How does Minneapolis and Twin Cities, MN show relative distance?
Despite both cities being 7-8 miles apart from each other, Minneapolis is much more fast-paced and progressive, whereas Twin Cities is slower and more traditional
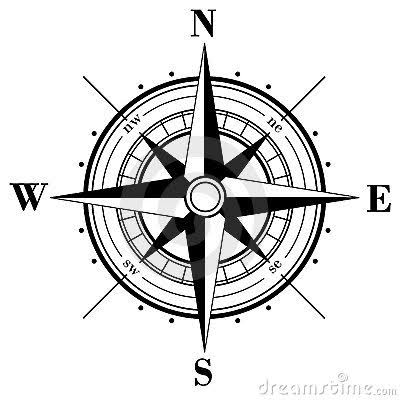
Absolute Direction - Spatial pattern 2
The cardinal directions (north, south, east, west)
Example: A compass
Relative direction
A different form/sub-type of absolute direction that describes one location in reference to another
Example of relative direction?
Example: Giving directions to a classroom in school using visual markers (water fountains, room numbers, etc)

Clustering & Dispersal - Spatial pattern 3
Shows how different phenomena are organized across an area
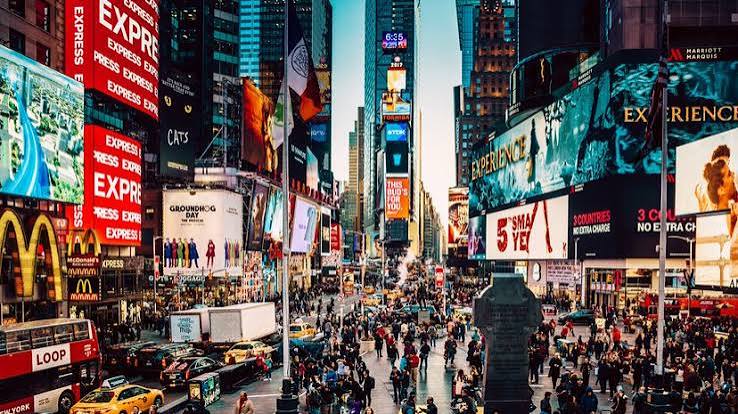
Example of clustering?
Cities - they have many building and residential areas that are packed together
Example of dispersal?
Rural areas - the area is much more spacious and residential areas are spread far apart
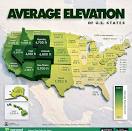
Elevation - Spatial pattern 4
Measures the height of geographic features relative to sea level
How does elevation influence spatial patterns?
Elevation can influence how people create settlements and agriculture
What are map features?
they are details on the map that give context to the data on the map
Map Scale
A map feature that tells the reader how the distance on the map relates to distance in the real world
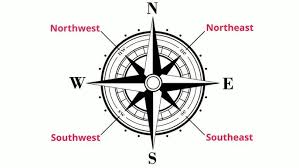
Direction
A map feature that is represented on the map by a compass rose (shows the cardinal directions & sometimes intermediate directions)
Scale
A map feature that shows how much of the world is visible on the map
How are Scale and Map Scale different?
Scale shows how much of the world is visible on the map, whereas map scale shows the distance relative to the real world
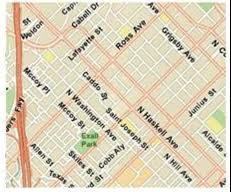
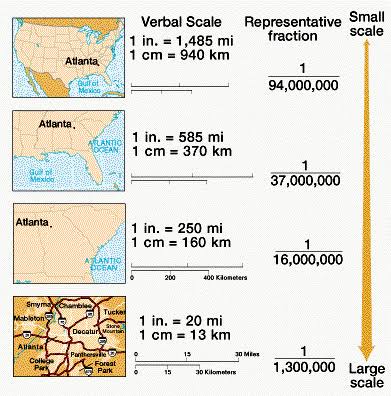
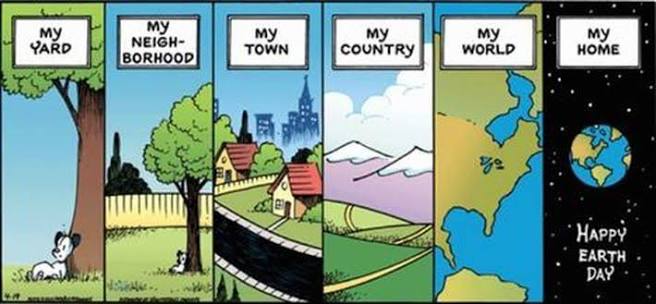
Large-scale map
Focuses on smaller locations - cities, towns, countries
Shows more detail
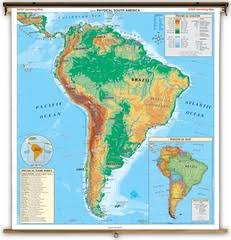
Small-scale map
Focuses on a larger location - nations or on a global scale
less detail
What category do reference maps and thematic maps fall under
They are part of the broad map category
Reference maps
They display specific geographic locations
Thematic maps
They display specialized geographic information
How many different thematic maps are there?
5 of them
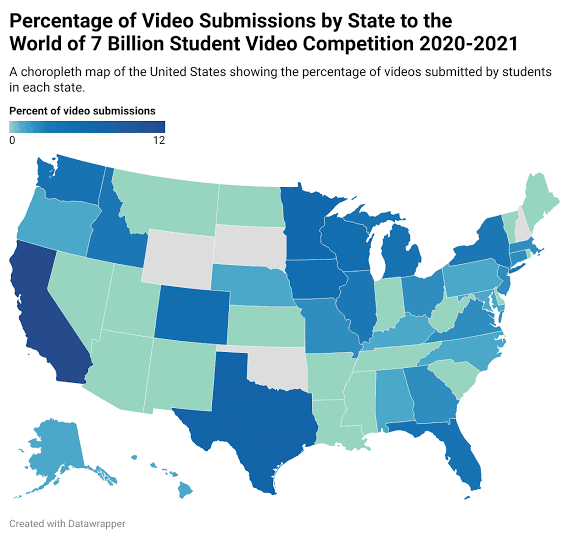
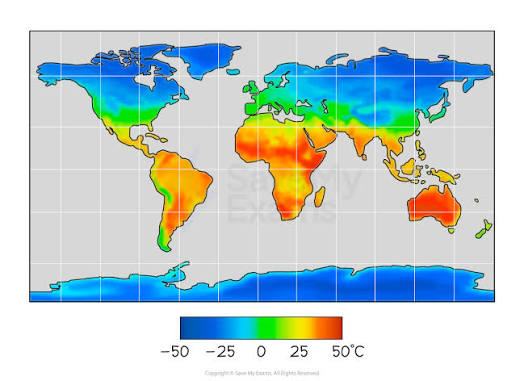
Choropleth map - thematic map 1
It visualizes data from a specific geographic region in different colors
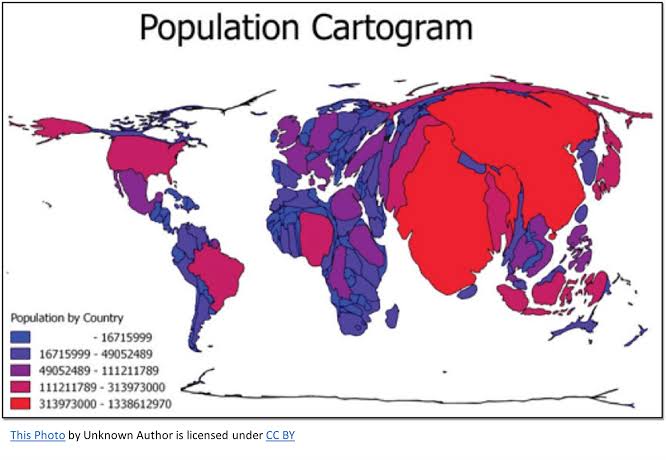
Cartogram map - thematic map 2
Is distorts the size of geographic shapes to display differences in data
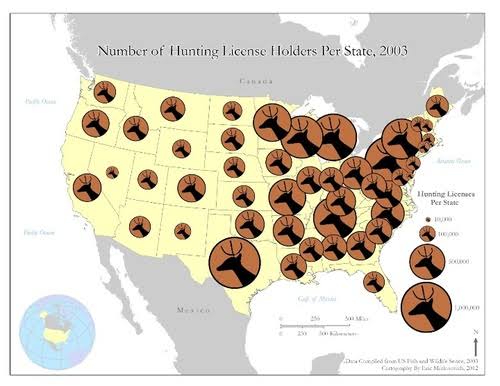
Graduated Symbol map - thematic map 3
Also known as a “proportional map”, this map shows symbols of different sizes in proportion to the data represented
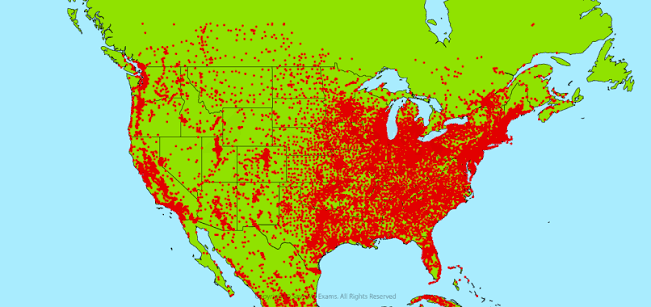
Dot Distribution map - thematic map 4
It uses dots to visualize the location of certain data points
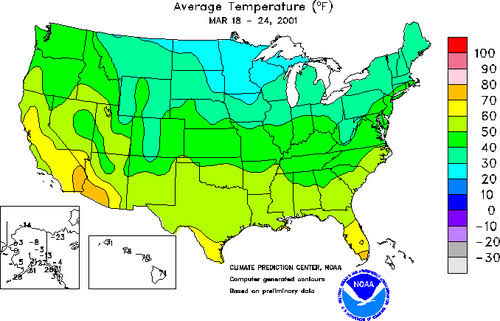
Isoline map - thematic map 5
It uses lines to depict changes in data
This is most often seen in maps with changing elevation
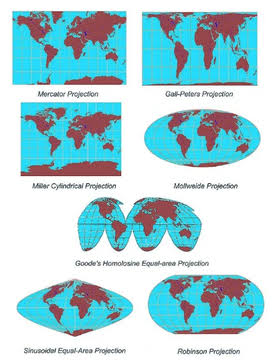
Map projection
All maps are selective in what they present and are distorted in some way
There are 5 main map projections to know
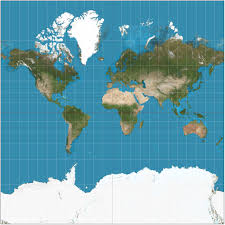
Mercator projection
A map whose latitude and longitude lines meet at right angles; used because it is good for determining direction
This map creates distortion of landmasses the further north or south from the equator
Who created the Mercator projection and why?
Europeans created this projecting during the Age of Discovery in order for maritime travel and guiding ships to distant lands
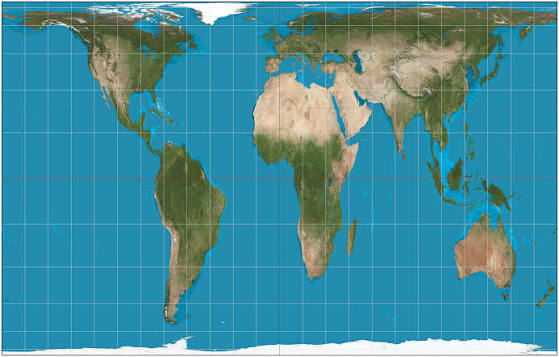
Gall-Peters projection
It was developed to challenge the Mercator projection, in which it depicted continents according to the true size of their landmass
despite size being accurate, the shape of the landmasses were distorted/odd-looking
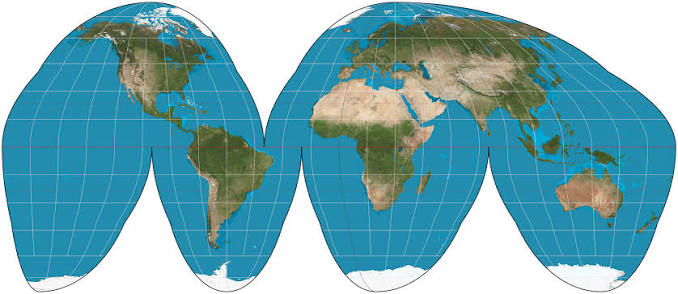
Goode Homolosine Projection
It accurately represents the shapes of the land masses, but has to break up the oceans to do so
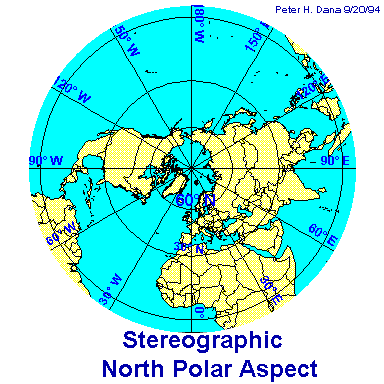
Polar Projection
Views the world from the North or South pole, where directions are true and there are true accurate land shapes near the middle
Distortion is obvious near the edges
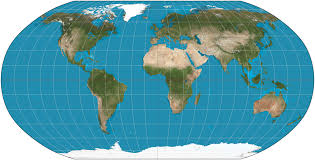
Robinson Projection
Created to be a sort of compromise between the Mercator and Peters projection, this map distributes all kinds of distortion to all parts of the map
There is minimal land mass distortion
What entities collect geographic data?
Individuals & organizations (the two big groups who care enough to gather geographic data), along with governments (used data for their own purpose)
Individuals
A person (researcher, geographer, etc) who is collecting geographic data of something (spatial spread of a disease, wanting to prevent danger, etc) in order to figure out what is happening and if they can create solutions to their findings
How are individuals gathering geographic data?
Done through field observations, travel narratives, and media reports
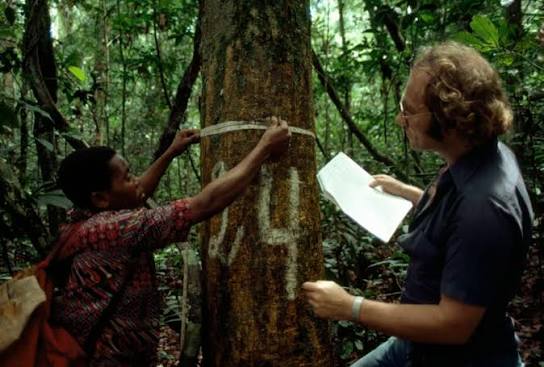
Field observations
When a researcher/geographer physically visits the location and makes written observations about what they see
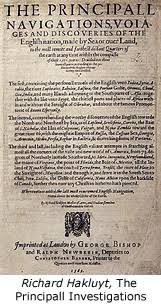
Travel narratives
Written accounts of a person’s travels - can be packed with geographic and cultural observations that can have significant effects on map making during that period and beyond

Media reports
The media often show up to locations to tell stories, which include details of the people living there and the geographic location in which they live
Organizations
They can gather data on a much larger scale then individuals because they tend to have a larger budget
This includes businesses, government agencies, etc
Governments
They often collect geographical data for their own purposes
gathered data can be used to decide what policies to pass or how to allocate representatives in a nation’s government (The US & the amount of representatives in Congress)
Census
It gathers information about a government’s citizens, including information like age, location, religion, etc
Quantitative data
Numbers based - all about counting things
Qualitative data
Characteristics of qualities of that data
It won’t tell the amount, but it could tell how people felt while data was gathered
How many methods are there for gathering geographic data?
3 kinds
Geospatial Technology
(broad, not one of the methods for fathering geographic data; acts as a sort of grouping of sorts)
Hardware and software can examine and measure geographical features on Earth
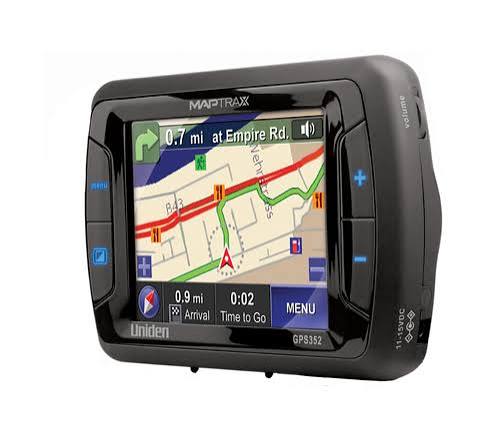
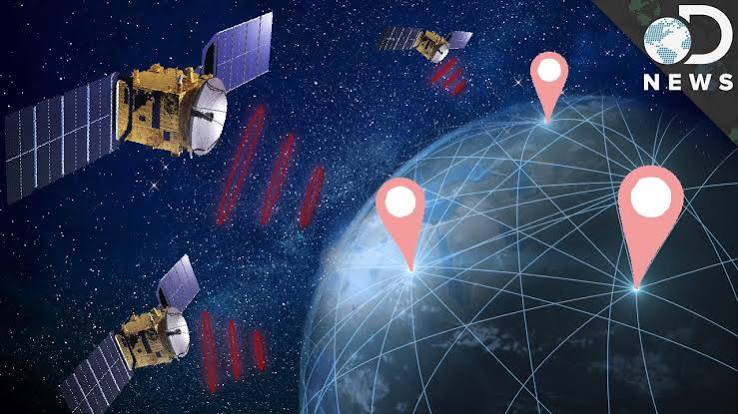
Global Positioning System (GPS) - method 1 of gathering geographic data
The collaboration of a device on Earth and satellites in space to find absolute location on Earth’s surface
It requires at least 4 satellites to find absolute location
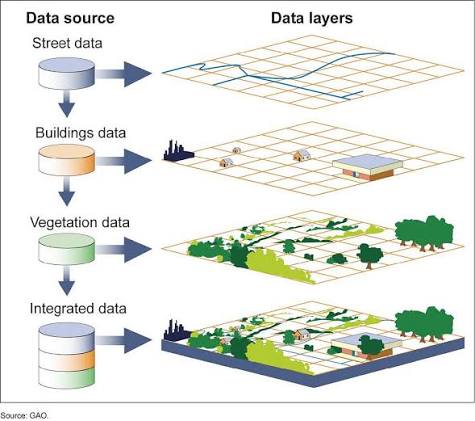
Geographic Information System (GIS) - method 2 of collecting geographic data
software which can manipulate geospatial data to be used for research or problem-solving
It analyzes data for the purpose of answering research-based questions
It collects, stores, and analyzes geospatial data
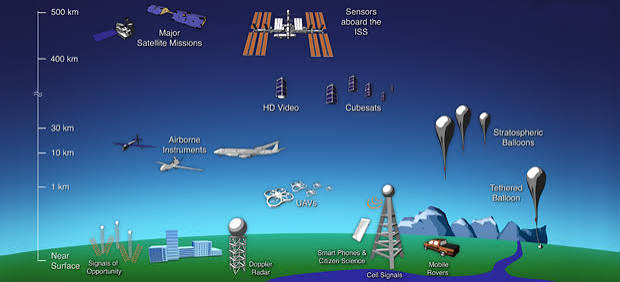
Remote Sensing - method 3 for collecting geographic data
the process of collecting geographic data and imagery about Earth's surface from a distance
It gathers data in 2 ways: Satellite imagery and Aerial photography
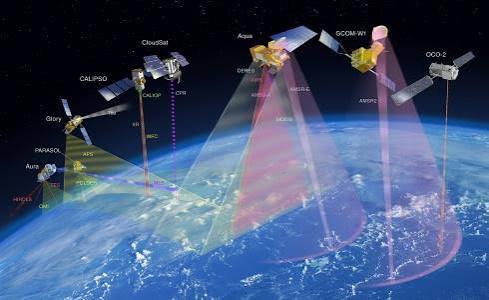
Satellite Imagery
digital images, maps, and data of the Earth's surface captured by sensors and cameras mounted on satellites orbiting the planet, essentially giving a person a “birds-eye” view other Earth’s surface
Helps visualize population patterns and other geospatial information
Example: the government using satellite image to track wildfire and make decisions about when certain populations need to evacuate
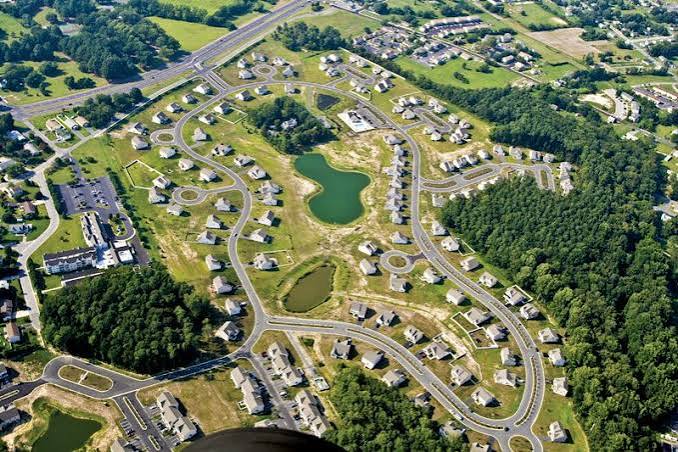
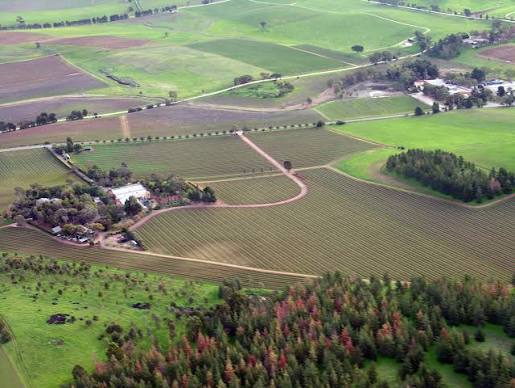
Aerial photography
Images of a location taken in the air or from highly elevated locations
Used for places that need more detailed information gathered
Recreation decisions
People use geographical data to get to a location
Example: gps
Moving/relocation
Using geographical data to decide where to move and the quality of other factors for other people
Example: school districts for children
Locating other people
The tracking of people’s location - can drive decision-making
What effects does Census data have on a nation’s government?
It can affect how government funds are allocated & the balance of political power in the fed. govt.
What major entities drive decision making?
Businesses and organizations - they make decisions that affect the general population using geographic data
What is the reason for businesses and organization to be in surplus in certain locations?
The reason for so many businesses and organizations being in surplus in certain regions is due to the use of geographic data and decision-making
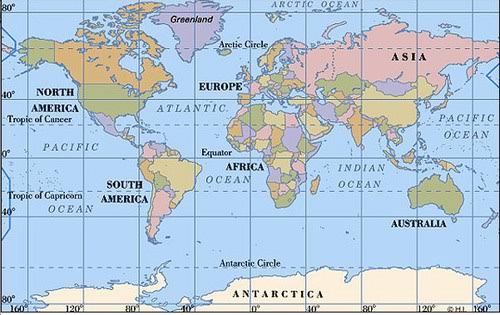
Latitude
invisible lines that run horizontally - separates the northern and southern hemispheres
Equator
The center line of latitude lines
Longitude lines
Lines that run vertically - separates the western and eastern hemispheres
Prime Meridian
The center line of longitude lines
International Date Line
An invisible line at 180 longitude that determines the start of each new day on Earth
Spatial concepts
the way in which different phenomena are organized in space - need to know six major concepts
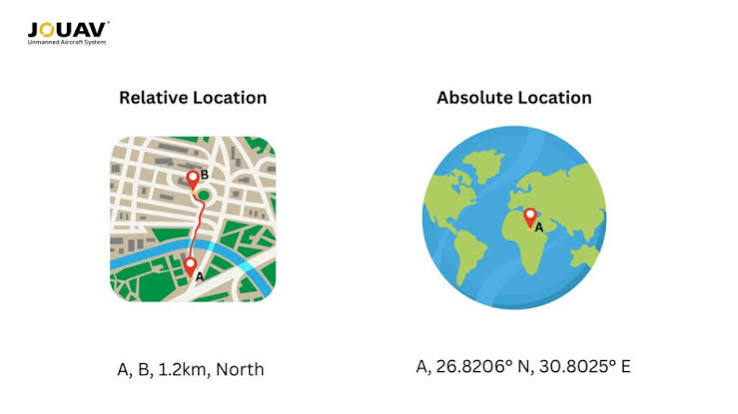
Absolute and Relative location
Absolute: the precise geographical location on Earth’s surface - works because of latitude and longitude lines
Relative: a measure of the social, economic, or cultural connectedness between two places using units of time, cost, or effort rather than exact physical miles or kilometers
Space and Place
Space: a theoretical concept that geographers use to describe the geometric surface of the Earth
Place: Describes the way humans modify a particular space in ways that reflect who they are
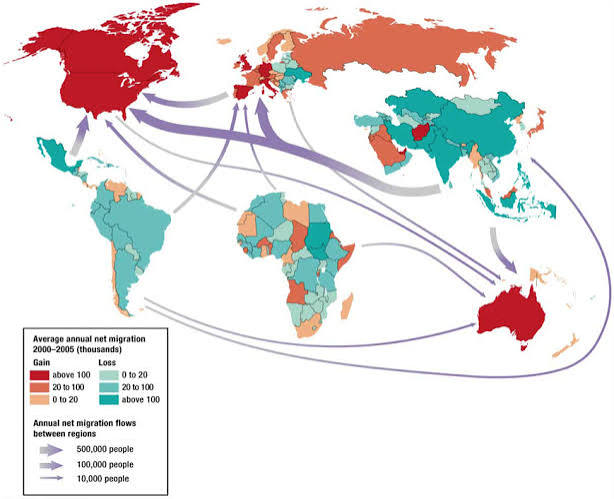
Flow
Describes the patterns of connection between two places
geographers study movements across connected lands and patterns that characterize those movements between the two locations
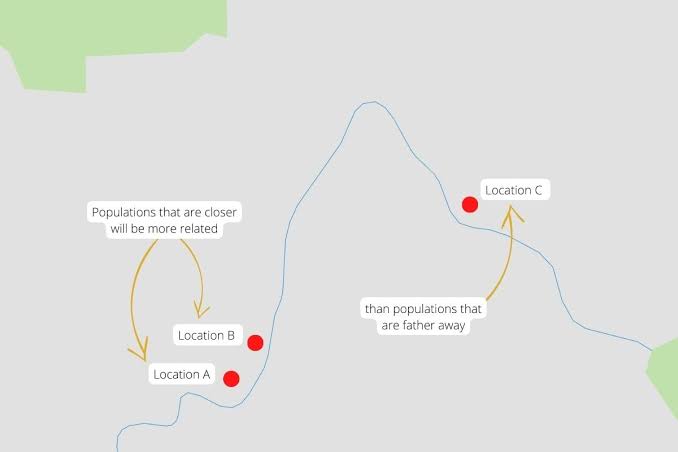
Distance Decay
The further apart two things are, the less connected they will be (they interact less and they share less)
Because of technological advancements, distance places are a lot more connected than they used to be
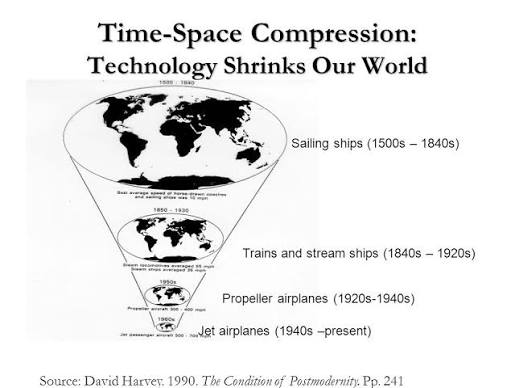
Time-space Compression
Describes the decreased distance between two places measured by the time or cost it requires to travel between them
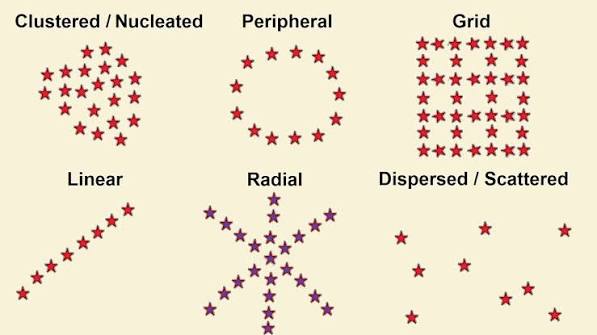
Patterns
Making sense out of how phenomena are arranged on the landscape - 6 different kinds of geographical aptterns
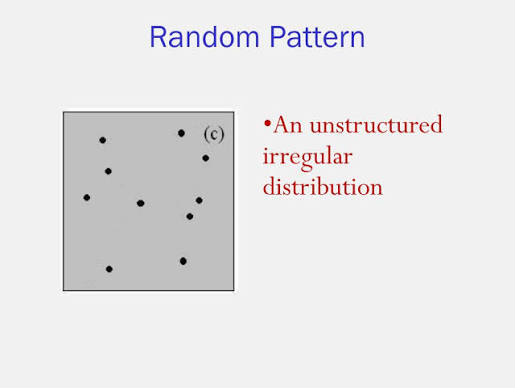
Random
There is no pattern, no real order

Clustered
Phenomena are tightly packed together
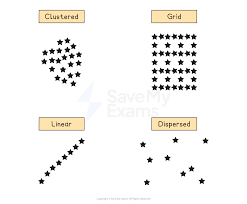
Dispersed
Phenomena are spread out

Linear
Phenomena happening in a striaght line - houses, roads, towns next to railroads, etc
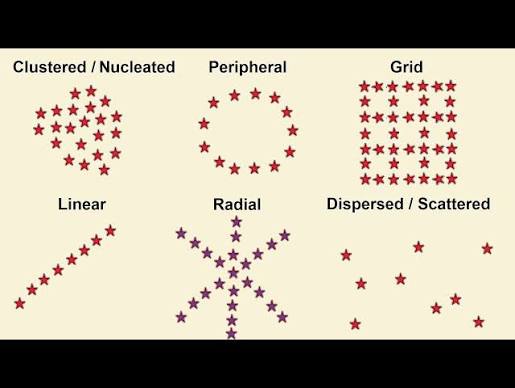
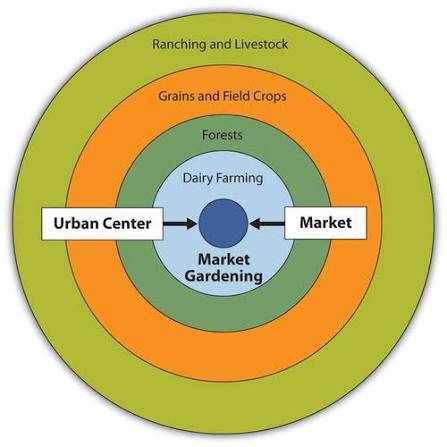
Circular
Phenomena (houses) built around a central communal space

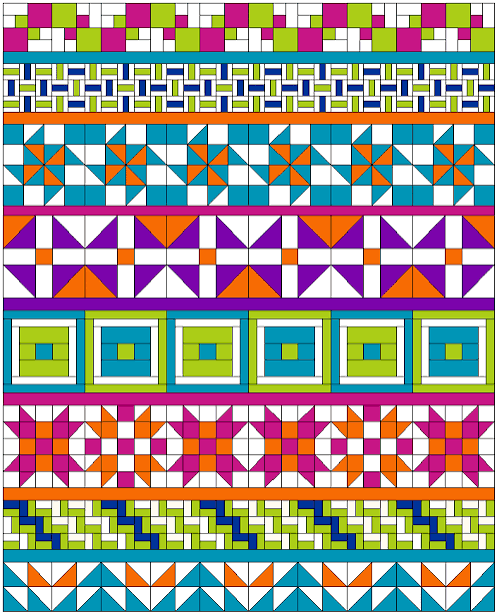
Geometric/Grid
Phenomena appear in regular orderly fashion
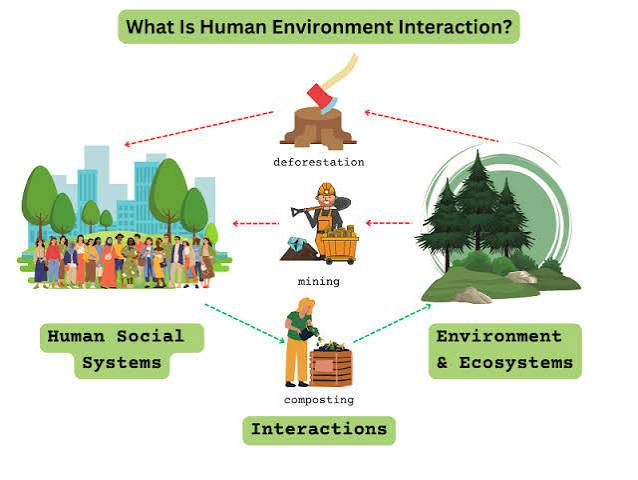
Human-Environment Interaction
How humans interact with their environment and modify it to mirror their way of life - 3 big categories to know
Use of natural resources
Materials found in the Earth that humans use for economic gain - 2 kinds
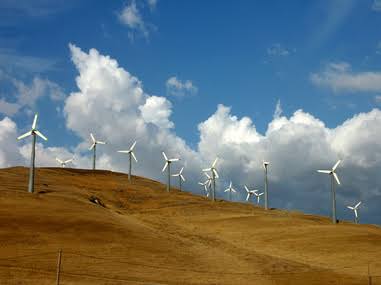
Renewable resources
Can be used in unlimited measures - the sun, wind, etc
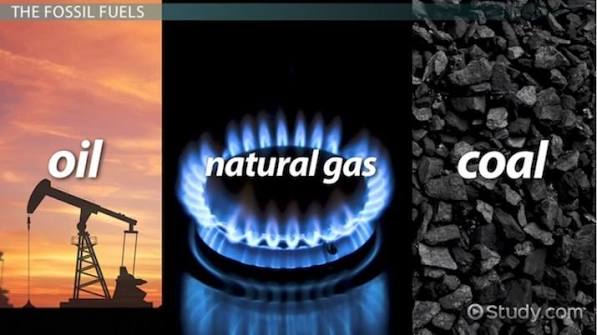
Non-renewable resources
Can be used in limited measures - oils, fossil fuels, natural gasses, etc
Sustainability
Using non-renewable resources so they will continue to be available in the future
What is the biggest concern about sustainability for governments?
Climate change
Land use
How human beings use and modify the land on which they live
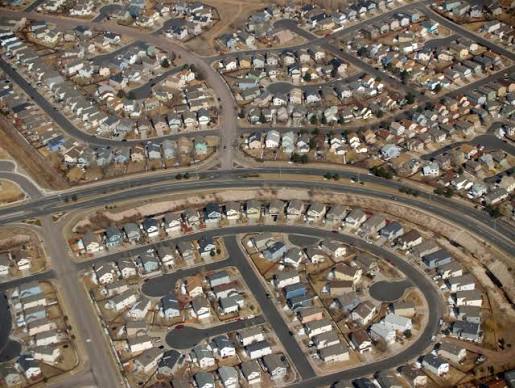
Built environment
everything on a piece of land that humans have built
They reflect and are affected by the cultural values of the people who build them
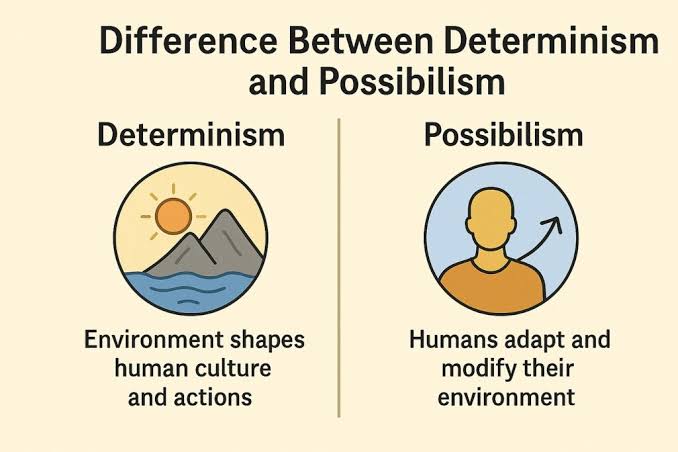
Environmental determinism
A framework of thoughts/theories that argued that environment determines culture

Environmental Possibilism (or just Possibilism)
Another type of framework for thoughts/theories that argued that humans determine culture (mainly)
This is the new main theory for geographers
It says that whatever environment humans find themselves in, it offers many different possibilities for cultural developments - argues environment isn’t the main influencer of human culture