Null hypothesis testing
1/13
There's no tags or description
Looks like no tags are added yet.
Name | Mastery | Learn | Test | Matching | Spaced | Call with Kai |
|---|
No analytics yet
Send a link to your students to track their progress
14 Terms
The null hypothesis H0 assumes
the sample came from a population where sample mean > population mean (significant difference)
The research hypothesis H1 assumes
the sample came from a population where sample mean = population mean (no significant difference)
Stages of null hypothesis testing
formulate hypotheses
collect data - sample mean and SDM
infer whether the data is inconsistent with H0
Fail or fail to reject H0
Interpret result in context of hypotheses
When does one fail to reject H0 (not significant)
when p (conditional probability) > a (critical value)
When does one reject H0 in favor of H1 (significant)
when p (conditional probability) < a (critical value)
A result testing H1 - people who buy parrots are more likely to be deaf found that H0 can be rejected.
Infer in context of hypothesis
There is evidence that people who buy parrots are more likely to be deaf
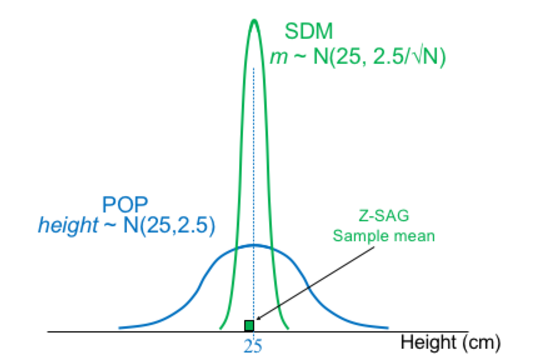
Heights are distributed normally
H1: height of sample is shorter than height of general population
n = 25, sample mean = 24.5
What conclusion can be inferred?
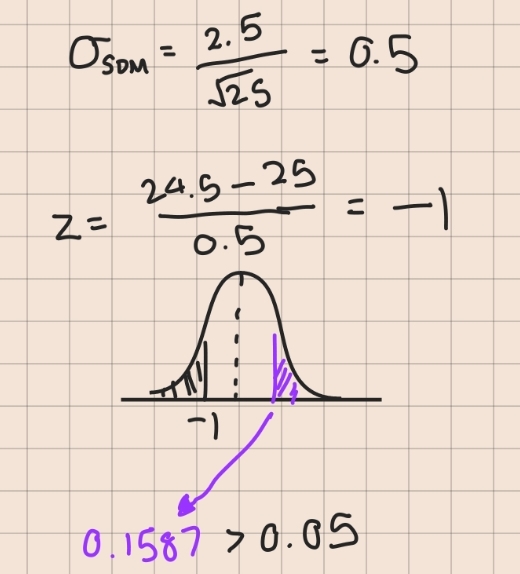
Fail to reject H0 > There is no sufficient evidence that the sample members are significantly shorter than the general population
what is the p value if you use a two tailed hypothesis?
The sum of p on both ends
Rejected H0 but H0 is actually true
Type 1 error
fAiled to reject H0 but H0 is actually false
Type 2 error
How type 1 errors arise
Random errors
How type 2 errors arise
Usually systematic errors
why is a = 5% usually
Not too large (increases risk of type 1 error) or too small (increases risk of type 2 errors)
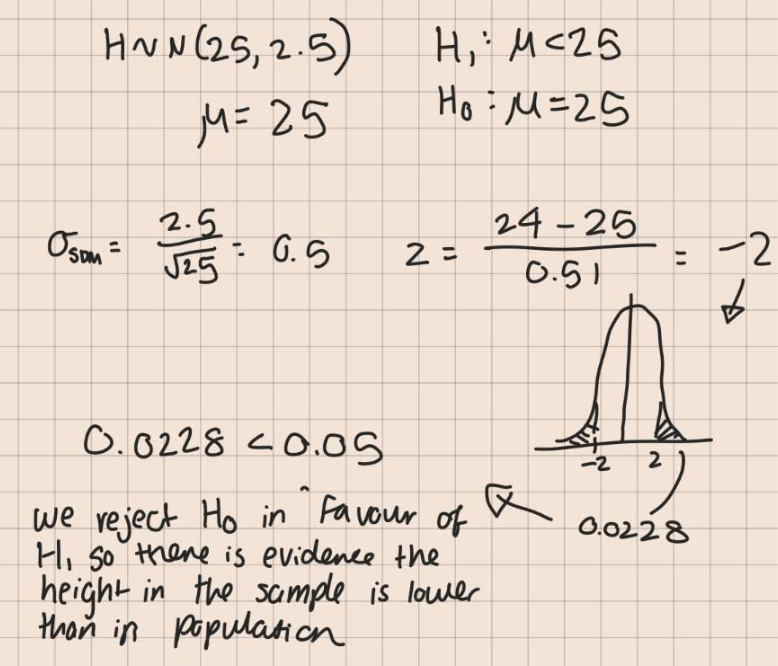
In a population H is distributed normally (25,2.5). In a sample of 25 you predict the mean is less than the population. conduct null hypothesis test at 5% significance
p (0.0228) < 0.05
We reject H0 in favour of H1 so there is evidence the heights of the sample is lower than in the population