Booklet 7 - Macroeconomic Performance & the Business Cycle
1/36
There's no tags or description
Looks like no tags are added yet.
Name | Mastery | Learn | Test | Matching | Spaced |
|---|
No study sessions yet.
37 Terms
What do you Discuss when asked about the Business Cycle:
Define Business Cycle
Draw the Model
Define a Peak/Boom
Define a Contraction/Downswing
Define Recession
Define Trough
Define Expansion/Upswing:
Characteristics of a Boom/Peak/Upper Turning Point:
Employment
Inflation
Economic Growth
Aggregate Demand
Monetary Policy
Fiscal Policy
Characteristics of a Trough/Lower Turning Point:
Employment
Inflation
Economic Growth
Aggregate Demand
Monetary Policy
Fiscal Policy
Define Business Cycle:
The fluctuating levels of economic activity in an economy over a period of time
Business Cycle Model
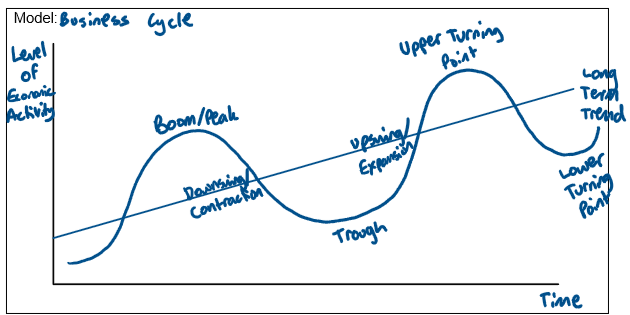
Definition of a Peak/Boom
Occurs where economic activity reaches a maximum above the long term trend when the business cycle transitions from an expansion to contraction
Definition of a Contraction/Downswing:
The period in the business cycle from a boom to a trough during which the level of economic activity is falling.
A recession is a type of contraction defined as two consecutive quarters of negative economic growth
Definition of Trough
Occurs where economic activity reaches a minimum below the long term trend, when the business cycle transitions from contraction to expansion
Define Expansion/Upswing:
The period in the business cycle from a trough up to a peak where the level of economic activity is ising.
Characteristics of a Boom/Peak/Upper TP
Employment: Low at or about full employment (target 4-4.5%)
Inflation: Peak during the boom/peak due to both demand pull & cost push.
Economic Growth: Highest level of production in recent times
High level of economic activity - output is at or near capacity
National income peaks
Low/decreased Un-employment.
Aggregate Demand: Peaks at its highest level
Consumption peaks
Domestic business investment peaks
high levels of confidence
High volume of imports therefore CAD
Monetary Policy: Interest rates peak during a boom/peak
Households & firms pressure interest rates through increased borrowing
RBA focuses on contractionary monetary policy
Fiscal Policy: Budget balance increases due to increased tax receipts, decreased transfer payments.
Characteristics of a Trough/Lower TP
Employment: High unemployment (unemployment peaks).
Increased cyclical unemployment
Inflation: Inflation will bottom as there is low levels of aggregate demand.
Aggregate demand is less than aggregate supply forcing prices down reducing demand pull inflation.
Economic Growth: lowest level of production in recent times
Output is below capacity
National income bottoms
Aggregate Demand: AD bottoms
Low profits & employment result in low levels of confidence
Low levels of imports due to lower national income therefore a current account surplus.
Monetary Policy: Interest rates are low due to;
Decreased pressure on interest rates
RBA focuses on expansionary monetary policy (decreasing the cash rate)
Fiscal Policy: Budget balance decreases due to increased transfer payments (increased expenditure) & decreased tax receipts (decreased revenue).
What do you Discuss when asked about the Causes of a Contraction (End of a Boom) - AD factors:
Inflation
Monetary Policy
Fiscal Policy
Exchange Rates
Causes of a Contraction (End of a Boom) - AD factor - Inflation:
Inflation can trigger a contraction at the end of a boom because high demand-pull inflation occurs when aggregate demand exceeds aggregate supply, pushing up prices. Simultaneously, cost-push inflation arises as firms face higher production costs from wage increases and resource shortages, which are passed onto consumers. When inflation rises faster than income growth, households’ purchasing power falls, reducing consumption and aggregate demand. This decline in spending initiates a slowdown in economic activity, marking the start of a contraction in the business cycle.
Causes of a Contraction (End of a Boom) - AD factor - Monetary Policy:
Monetary policy can cause a contraction at the end of a boom when the central bank implements contractionary measures, such as raising interest rates, to curb inflation. Higher interest rates increase the cost of borrowing, reducing consumption and investment, while encouraging savings. This lowers aggregate demand, slowing economic activity and initiating a downswing phase in the business cycle.
Causes of a Contraction (End of a Boom) - AD factor - Fiscal Policy:
Fiscal policy can cause a contraction at the end of a boom when the government implements contractionary measures, such as higher taxes or reduced spending, to control inflation. Increased taxation lowers households’ disposable income, reducing consumption, while cuts in government spending reduce overall demand. These actions decrease aggregate demand, slow economic activity, and contribute to a downswing in the business cycle.
Causes of a Contraction (End of a Boom) - AD factor - Exchange Rates:
Exchange rate movements can contribute to a contraction at the end of a boom. A strong economy often attracts foreign investment, which appreciates the AUD. This makes Australian exports more expensive and less competitive internationally, reducing export demand. At the same time, higher purchasing power encourages more imports, decreasing net exports. Together, the fall in net exports lowers aggregate demand, slowing economic activity and contributing to a downswing in the business cycle.
What do you Discuss when asked about the Causes of a Contraction (End of a Boom) - AS factors:
Bottlenecks/Shortages
Other Factors (Exogenous Events)
Causes of a Contraction (End of a Boom) - AS factor - Bottlenecks/Shortages:
Bottlenecks and shortages can trigger a contraction at the end of a boom by limiting aggregate supply. During economic expansion, resources eventually reach full employment, and production cannot increase further. These bottlenecks—such as shortages of labor, capital, or raw materials—prevent firms from meeting rising demand. As a result, prices rise without an increase in output, reducing real consumption and investment, which slows aggregate demand and initiates a downswing in the business cycle.
Causes of a Contraction (End of a Boom) - AS factor - other Factors - Exogenous Events:
Exogenous events, such as wars, terrorist attacks, political instability, natural disasters, or global financial crises, can cause a contraction by reducing aggregate supply and disrupting economic activity. These shocks damage infrastructure, reduce production, and lower national income, while also undermining consumer and business confidence. The resulting decline in output and spending slows aggregate demand, contributing to the transition from a boom to a downswing in the business cycle.
What do you Discuss when asked about Causes of an Expansion (End of a Trough) - AD Factors:
Consumption & Capital Stock
Monetary Policy
Fiscal Policy
Exchange Rates
Other Factors (exogenous events)
Consumption & Capital Shock as a cause of an Expansion (End of a Trough) - AD Factors:
Consumption and capital shocks can trigger an expansion at the end of a trough by raising aggregate demand. Even during a downswing, a minimum level of output must be maintained, requiring firms to replace worn-out capital equipment. Investment in new capital increases production capacity and stimulates spending in related industries, initiating a multiplier effect. Similarly, when households resume or increase consumption, aggregate demand rises, boosting national income and helping the economy move from a trough into the upswing phase of the business cycle.
Monetary Policy as a cause of an Expansion (End of a Trough) - AD Factors:
Monetary policy can stimulate an expansion at the end of a trough through expansionary measures, such as lowering interest rates. Lower interest rates reduce the cost of borrowing, encouraging households to increase consumption and firms to increase investment. This boosts aggregate demand, raises spending, and stimulates economic activity, helping the economy transition from a downswing to an upswing in the business cycle.
Fiscal Policy as a cause of an Expansion (End of a Trough) - AD Factors:
Expansionary fiscal policy can drive an economic upswing at the end of a trough by increasing government spending or running budget deficits. Higher government expenditure directly raises aggregate demand and, through the multiplier effect, stimulates additional consumption and investment. This boost in spending and income helps the economy recover from a downswing and supports the transition into the expansion phase of the business cycle.
Exchange Rates as a cause of an Expansion (End of a Trough) - AD Factors:
Exchange rate movements can stimulate an expansion at the end of a trough. A contraction in economic activity often leads to a depreciation of the AUD as foreign investment withdraws, lowering demand for the currency. This makes Australian exports cheaper and more competitive internationally, boosting export volumes, while imports become more expensive, reducing import demand. The improvement in net exports raises aggregate demand, helping the economy transition from a trough into the upswing phase.
Other Factors (Exogenous Events) as a cause of an Expansion (End of a Trough) - AD Factors:
Exogenous events can trigger an expansion at the end of a trough by influencing export income and aggregate demand. For example, strong economic growth in key trading partners or rising international prices for Australian exports increases demand for Australian goods and services. This raises national income and stimulates spending, boosting GDP and helping the economy move from a downswing into the upswing phase of the business cycle.
What do you Discuss when asked about the Relationship between the Business Cycle & Economic Indicators:
Leading Indicators
Example
Coincident Indicators
Example
Lagging Indicators
Example
Procyclical Indicators
Example
Counter Cyclical Indicators
Example
Leading Indicators
These indicators generally signal changes before changes take place in the economy. They therefore predict trends in economic activity. However, a few leading indicators anticipate both expansions and recessions as well.
E.g., Share prices, building approvals, inventory of retail firms
Coincident Indicators:
Move in line with the level of economic activity, generally signal changes before changes take place in the economy. However a few leading indicators anticipate both expansions and recessions as well.
e.g., GDP, manufacturing output, sales of consumer durables.
Lagging Indicators:
Variables that change sometime after the level of economic activity changes. These indicators are not expected to show any change until after trends in the rest of the economy have been confirmed. Changes in the economy occur before lagging indicators change.
e.g., Interest rates, consumer debt, unemployment rate
Procyclical Indicators:
A variable that increases during an expansion and falls during a contraction.
E.g., consumer spending, GDP, investment
Countercyclical Indicators
Decreases during an expansion & increases during a contraction
E.g., UE, business failures, government welfare
Percentage Rate of Change Formula
( (P2 - P1) / P1 ) x 100
Consumer Price Index Formula
( (CPI Period 2 - CPI Period 1) / CPI Period 1 ) x 100
Gross Domestic Product Formula
( (GDP Period 2 - GDP Period 1) / GDP Period 1 ) x 100
Labour Force Formula
Unemployed + Employed
Unemployment Rate Formula
(Unemployed / Labour Force) x 100
Participation Rate Formula
(Labour Force / Working Age Population) x 100
Underemployment Rate Formula
(Underemployed Part Time Workers / Labour Force ) x 100
Trends
GO BACK & FILL IN