AP STATS AP TEST REVIEW 1, 2, 3 +& 4
1/87
There's no tags or description
Looks like no tags are added yet.
Name | Mastery | Learn | Test | Matching | Spaced |
|---|
No study sessions yet.
88 Terms
Stratified Sample
Separates sample by homogenous (same) groups called strata. Like race, gender, income or age.
Cluster Sampling
splits population into similar parts or clusters, then select a few random clusters, then take a census of each.
Multistage Sampling
multiple types of samples combined
Voluntary Response Bias
-volunteers who wanted to participate in the survey.
Systematic sample
Start from a randomly selected person. Then start surveying/collecting data from every n^th person
Under coverage
Subgroups are completely left out or underrepresented.
Non response Bias
option to respond but choose not to
Response Bias
Question is worded or phrased in such a way that influences the response.
Convenience Sampling
sample consists of participants that are nearest and easiest to sample.
population
the entire group of individuals we want information about
census
a complete count of the population; when you gather general information about the entire population
sample
a part of the population we actually examine in order to gather information
sampling design
the method used to choose the sample from the population
sampling frame
is a list or source that contains all the units (individuals, households, etc.) from which a sample will be selected.
simple random sample
is a sampling method in which every member of the population has an equal chance of being selected.
stratified random sample
is a sampling method that divides the population into distinct subgroups (strata) based on shared characteristics and then randomly selects samples from each stratum, ensuring representation across the different subgroups.
systematic random sample
randomly select a number between one and n and survey every nth person after that.
cluster random sample
The population is divided into naturally occurring groups (clusters) that are often geographically based (e.g., schools, neighborhoods, hospitals). and then randomly selects entire clusters to sample, often used for convenience or cost-effectiveness.
multistage sample
is a sampling method that combines different sampling techniques, such as stratified and cluster sampling, at various stages to obtain a more representative sample from a larger population.
describe an srs
put the names/numbers of all ___ on slips of paper and place in a hat. Mix and randomly draw ___ slips of paper without replacement. Survey the corresponding people.
describe a systematic random sample.
number all ___ and place ___ numbers in a hat. Mix and randomly select one number and survey the corresponding person. Survey every nth person on the list after that.
describe a cluster random design
number all clusters and put the numbers into a hat Mix and randomly select a number from the hat. Survey everyone in that cluster.
stratified random sample
sort everyone into strata then number ___ in all the stratum. place the numbers in a hat and draw __ numbers. survey the corresponding people in that specific stratum. repeat the process for all strata
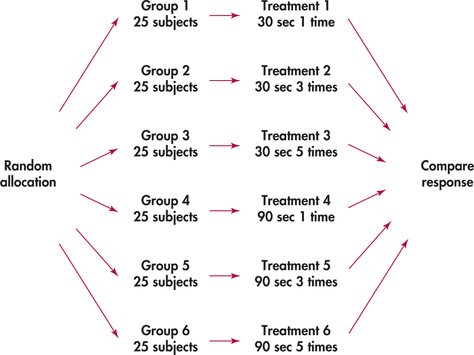
Completely randomized design
experimental units are assigned completely at random to treatments.
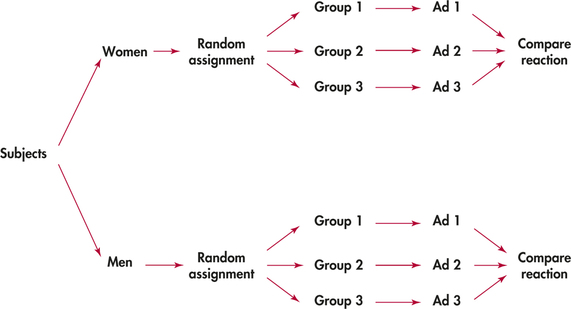
randomized block design
experimental units are blocked in homogeneous groups and then randomly assigned to treatmentswithin each block to control for variability.
matched pairs design
a special type of block design; match up experimental unit according to similar characteristics and randomly assign one to treatment A and the other get treatment B randomly.
observational study
a study where researchers observe subjects without manipulating anything; they collect data on variables of interest.
Experiment
actively impose a randomly assigned treatment in order to observe the response
experimental unit
the single individual to which the different treatments are randomly assigned
factor/ explanatory variable
what we test or what we change
Level
the specific values or settings of a factor in an experiment.
response variable
what you measure or record at the end of the experiment
treatment
a specific experimental condition applied to the units
Control group
a group that is used to compare the factor against; can be placebo
placebo
a "dummy" treatment that can have no physical effect; not required in every experiment
blinding
method used so that units or evaluators do not know which treatment units are getting
double blinding
neither the units nor the evaluators know which treatment a subject recieved.
confounding variable
a third variable that potentially affects both the factor and the response variable.
Randomized block design
completely randomized design
Simpsons Paradox
-A conjecture can be reversed when several different groups of data are combined to form a single group. The effect of another variable is masked when the groups are combined.
Correlation coefficient
-a quantitative value of the strength of a linear relationship.
“r”
-ranges from -1 to +1
-no unit of measurement
-strongly affected by outliers.
Coefficient of Determination
-r²
gives the proportion of variation in y (response) that is explained by the relationship of (x, y) or x, the explanatory variable.
-between 0—>1 or 0-100%
-if r²=100%, then all the variation in the response variable is explained by the variation in x or the explanatory variable.
Skewed left
Mean<median
Skewed right
Mean>median
Fences + Outliers
Less than Q1-1.5(IQR)
Greater than Q3+1.5(IQR)
Conditional Relative Frequency
-The relative frequency for a specific part of the table. For example, the cell frequencies in a row divided by the total for that row or the cell frequencies in a column divided by the total for that column.
frequency=
counts
relative frequency=
%
mean of a sample
x̄
mean of population
μ
5 number summary helps
understand variability
Variability
- describes how scattered or clustered data points are within a dataset.
-Range, Interquartile Range (IQR), standard deviation, and variance are all measures of
-A dataset with high variability has data points widely scattered, while a dataset with low variability has data points clustered tightly together.
Quantitative Variable
-takes on numerical values for a measured or counted quantity
Discrete Variable
-takes on a finite of countable number of values
Continuous Variables
-takes on uncountable or infinite values with no gaps such as heights and weights of students.
Sensitive to extreme values?
-mean, range, variance, and st dev
not sensitive to extreme values?
median and IQR
Variance
quantifies the average squared distance of each data point from the mean (average) of the dataset.
Why it's important:
A higher variance indicates a greater spread in the data, while a lower variance suggests data points are clustered closer to the mean.
Dotplot
advantages-shows every value and it is easy to see the shape of the distribution
disadvantages-hard to plot large data sets.
(4.2) Law of Large Numbers?
Simulated probabilities seem to get closer to the true probability as the number of trials increases.
(4.3) The probability of an event is between what two numbers?
The probability of any event is a number between 0 and 1, inclusive.
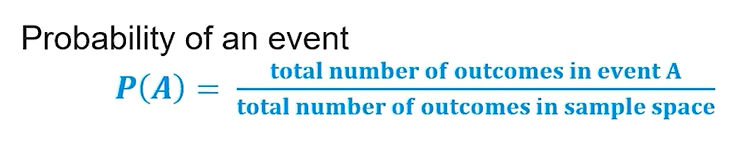
(4.3) Probability of an Event Formula?
(4.3) Probability of the Complement of an Event Formula?
E’ (aka EC or not E) = 1 - P(E)
(4.4) What is a mutually exclusive event?
Two events are mutually exclusive (disjoint) if they cannot occur at the same time. If two events are mutually exclusive, then the probability of their intersection is 0; in other words if two events are mutually exclusive, P(A and B) = 0.
(4.4) What is Joint Probability?
The joint probability is the probability of the intersection of two events; P(A and B).
(4.5) What is conditional probability?
Conditional probability is the probability that an event happens given that another event is known to have already happened.
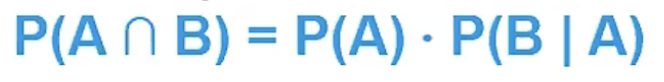
(4.5) General multiplication rule for two events A and B?
Note that it can be manipulated to give the conditional probability formula as well; P(B | A) = P (A ⋂ B) / P (A).
(4.6) What are the conditions for two events to be independent?
Two events A and B are independent iff
P(A | B) = P(A) and P(B | A) = P(B)
P(A and B) = P(A) ⋅ P(B)
(4.6) How do you calculate the probability of the union of two events?
The probability of the union of two events can be found by the formula:
P(A or B) = P(A) + P(B) - P(A and B)
Using proper notation it is:
P(A ⋃ B) = P(A) + P(B) - P(A ⋂ B)
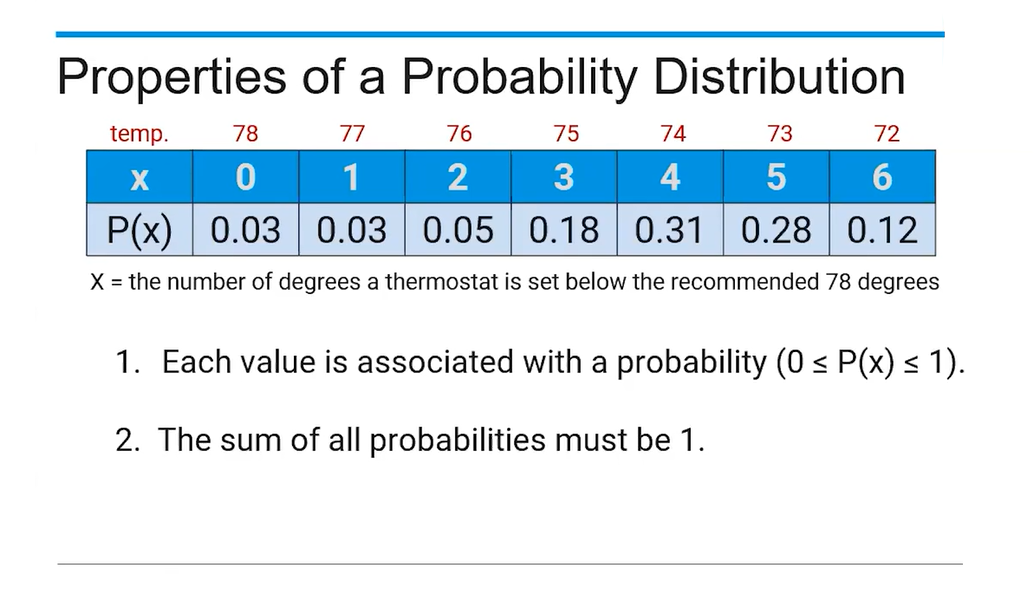
(4.7) Properties of a probability distribution?
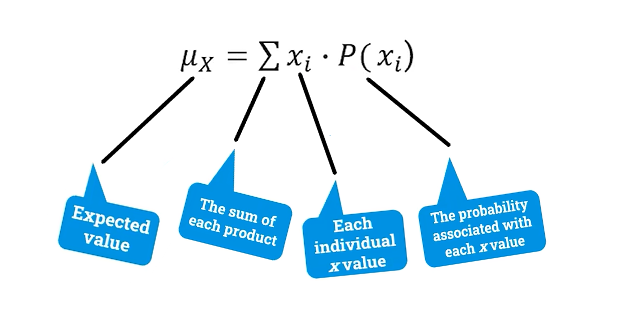
(4.8) Mean (Expected value formula)?
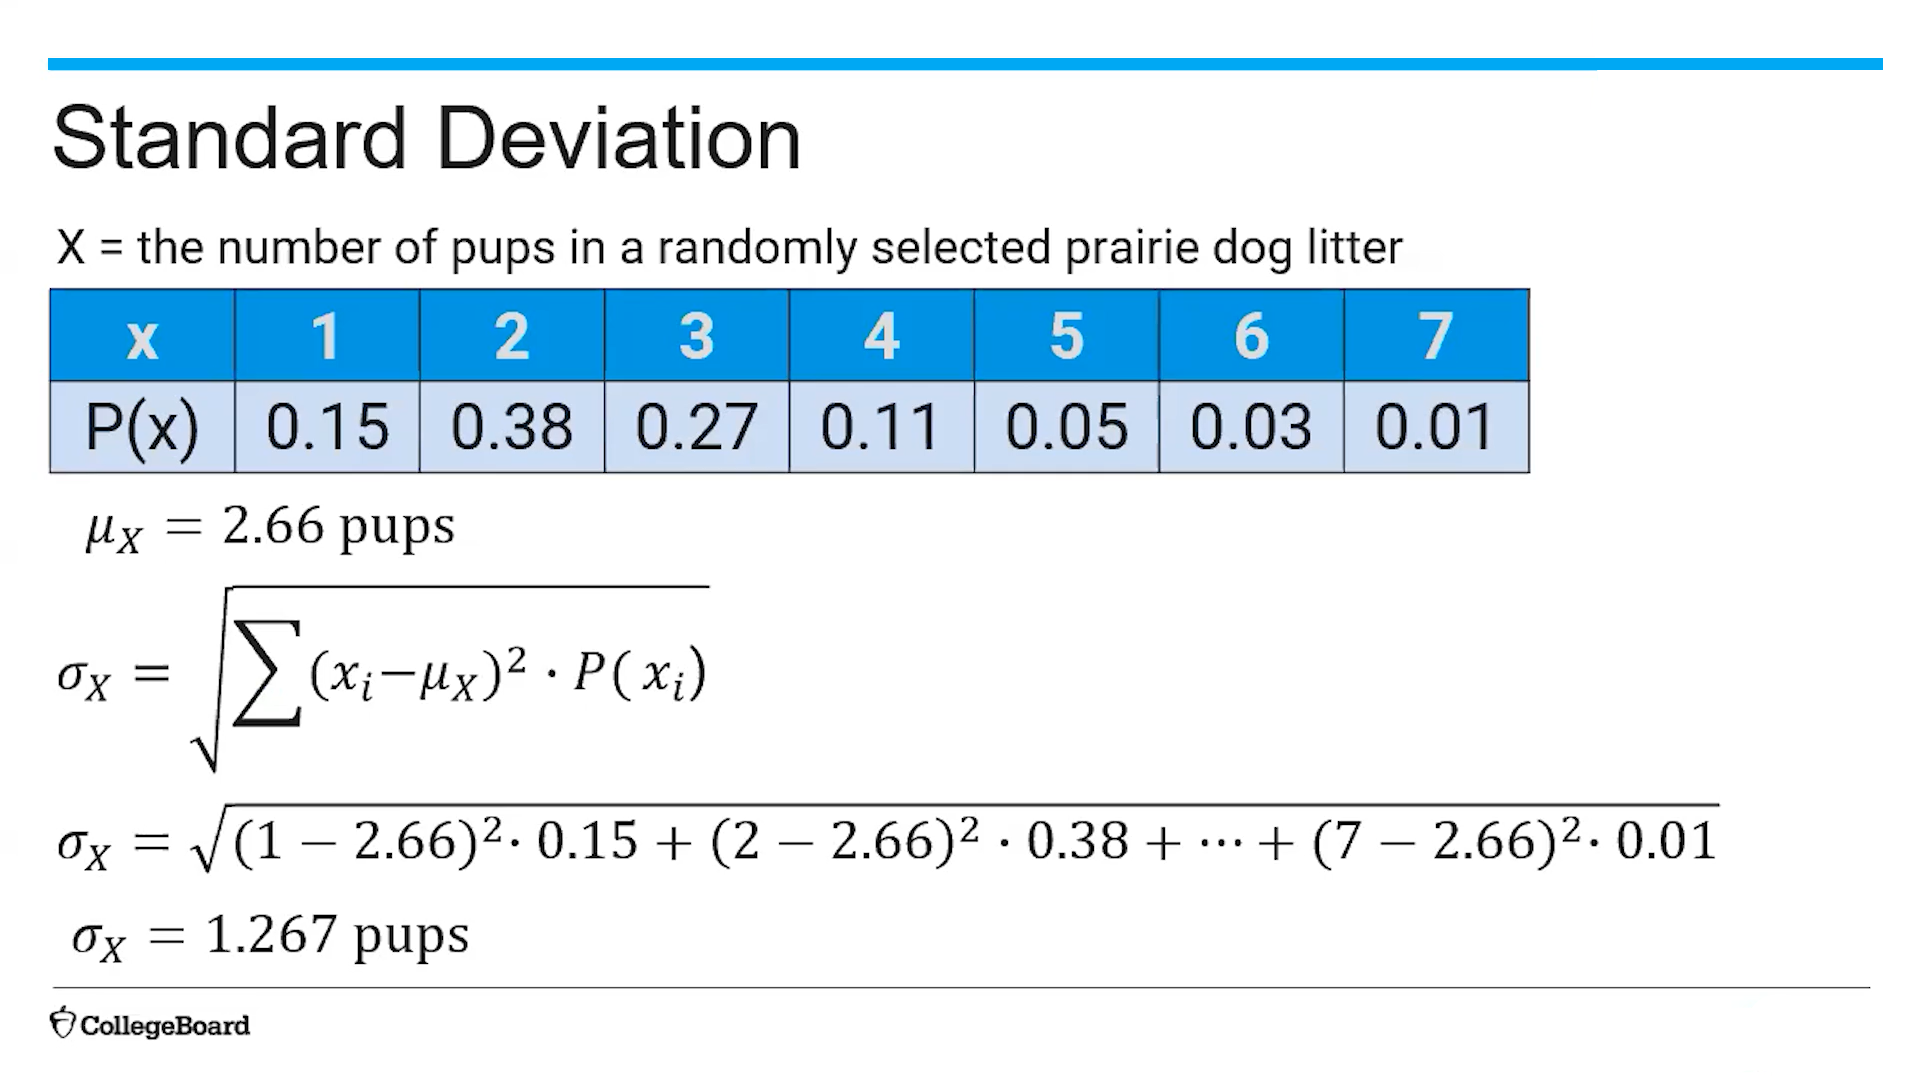
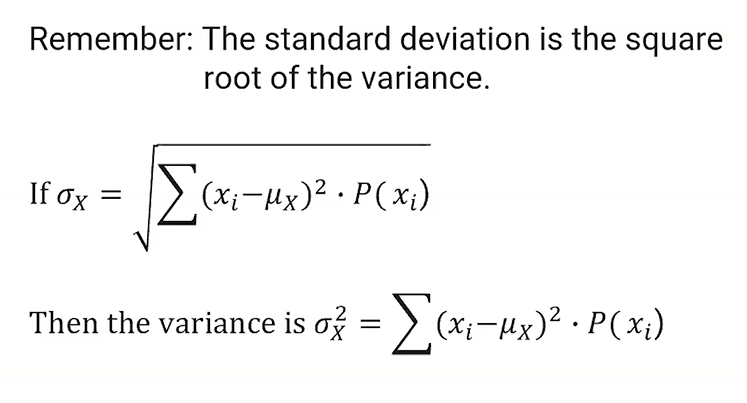
(4.8) Standard Deviation Formula (σx)?
(4.8) Variance Formula (σx2)?
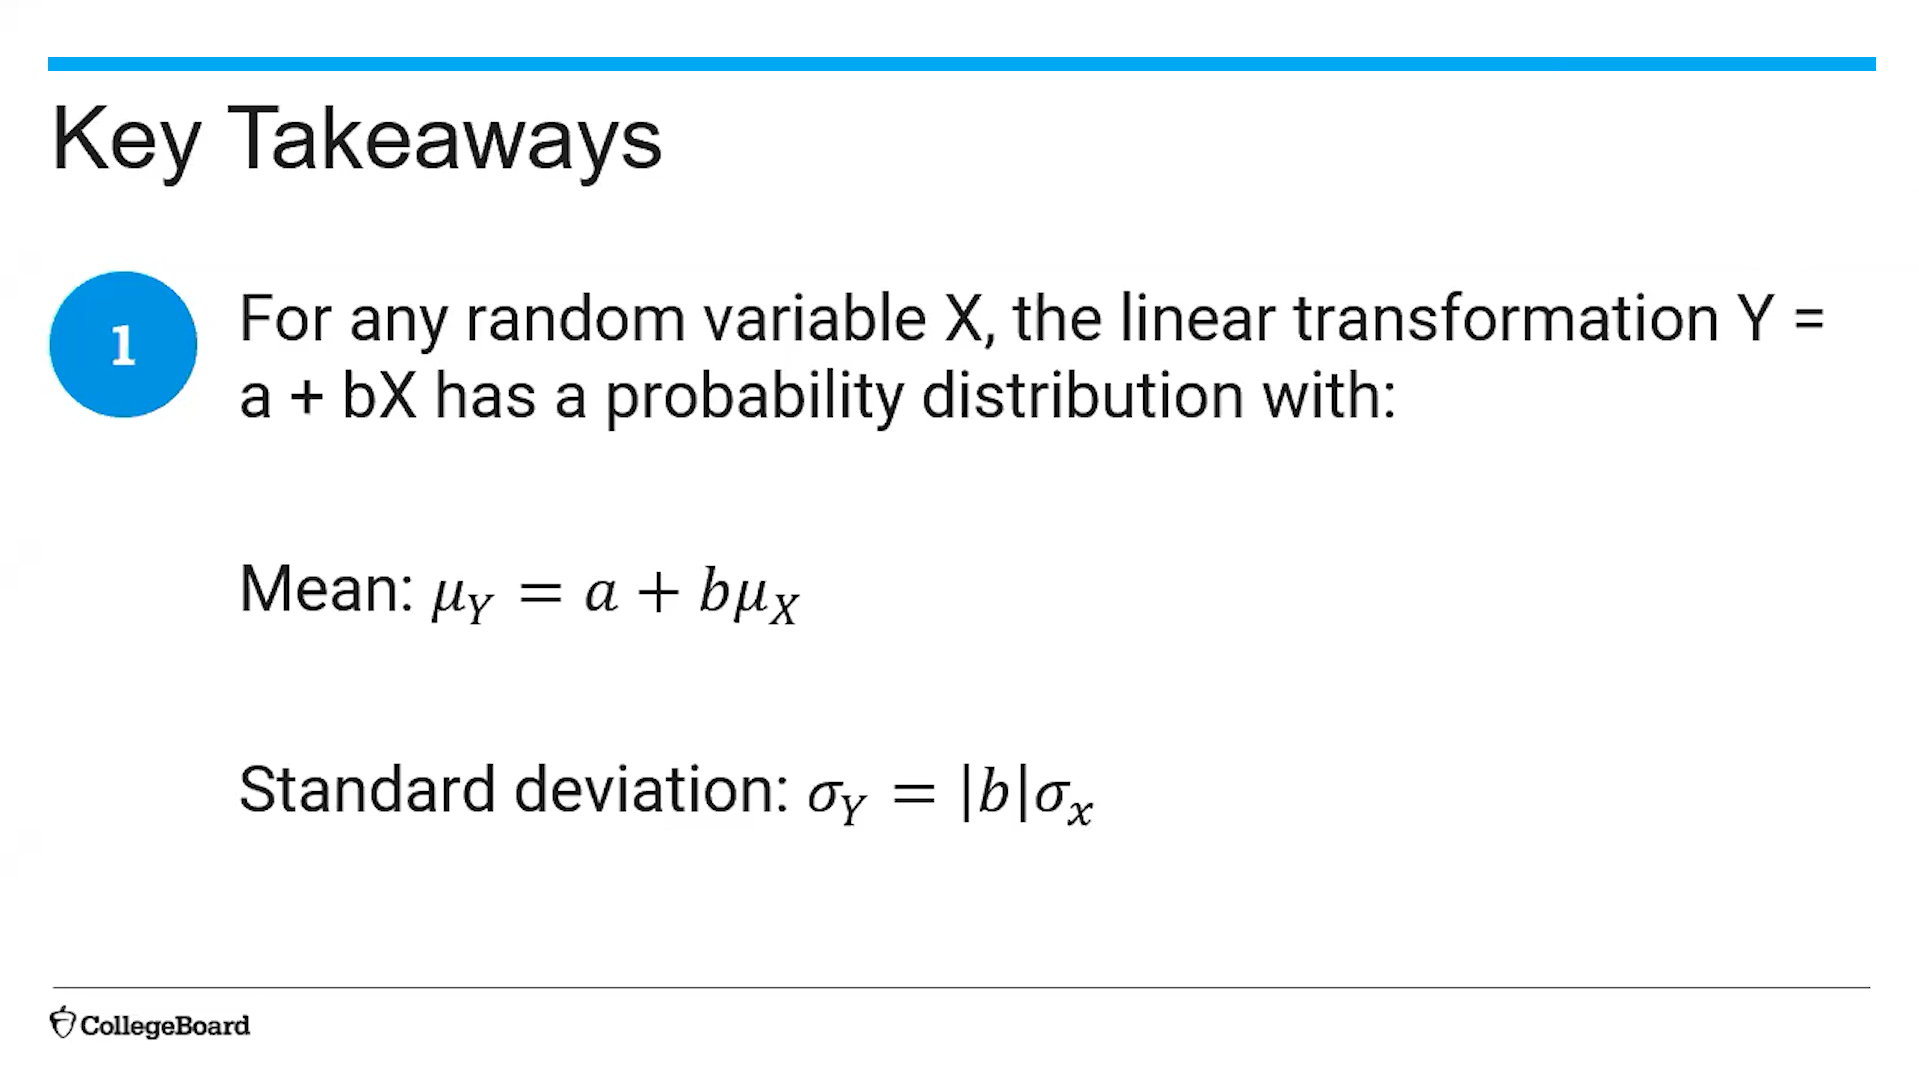
(4.9) Finding the mean and standard deviation using a linear transformation
(4.9) When are two random variables independent?
Two random variables are independent if knowing information about one of them does not change the probability distribution of the other.
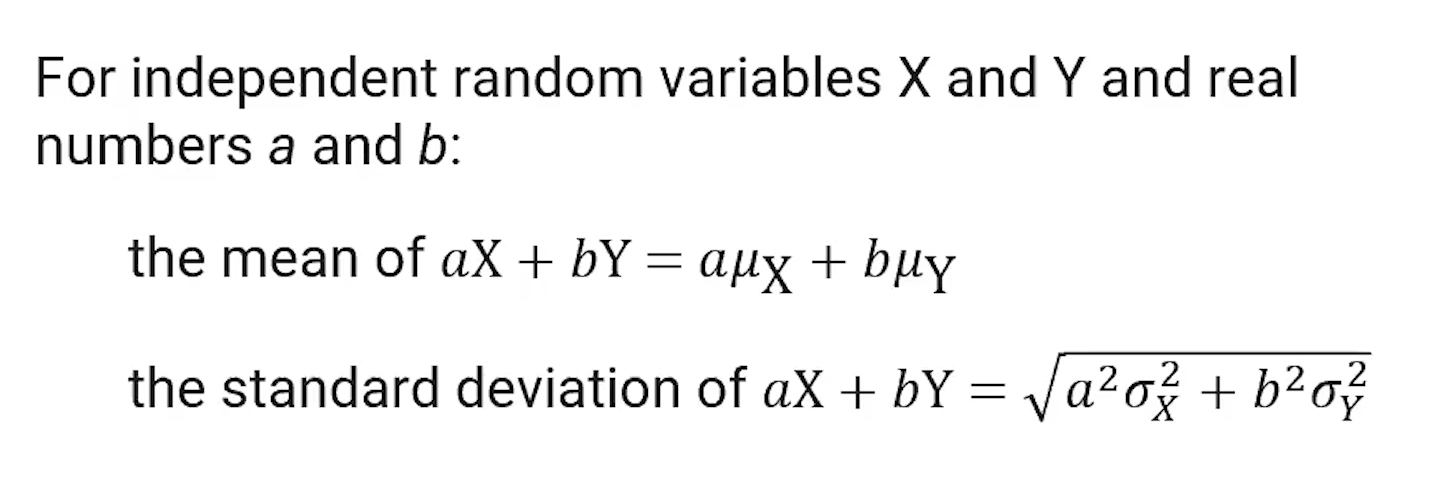
(4.9) How do you calculate the mean and standard deviation of independent random variables X and Y and real numbers a and b?
(4.10) Definition and conditions for a binomial setting?
A binomial setting involves repeated trials of the same random process, where these conditions are met:
Two possible outcomes: success or failure
Independent trials
Fixed number of trials
Each trial has the same probability of success
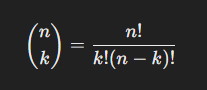
(4.10) Binomial Coefficient Formula
(4.10) Binomial Probability Function

(4.10) Note about calculating binomial probabilities
When calculating binomial probabilities, be sure to define the random variable, identify the distribution and values of interest, calculate the correct probability and answer the question in context
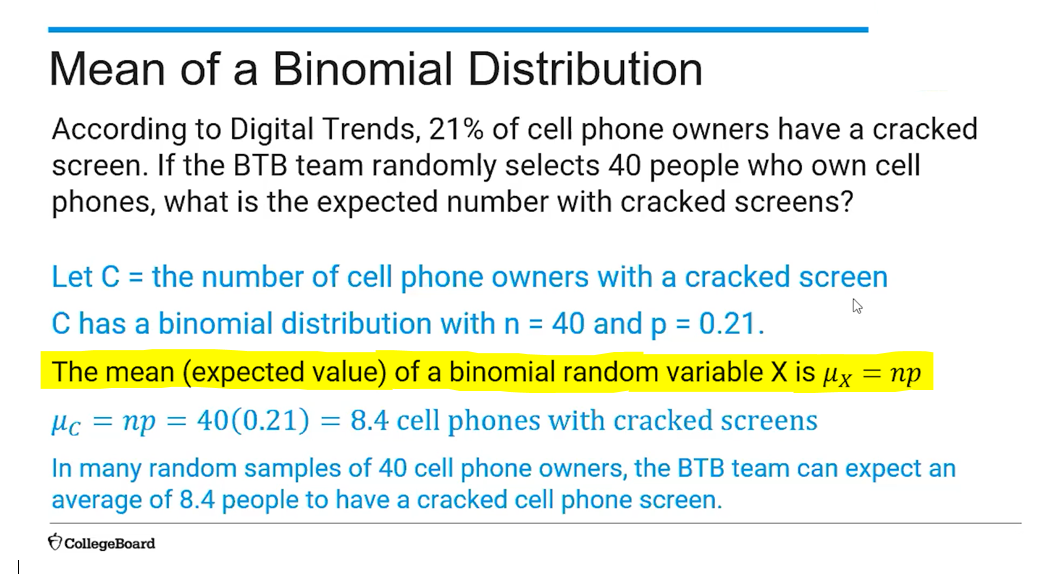
(4.11) Mean of a Binomial Function Formula?
μX=np
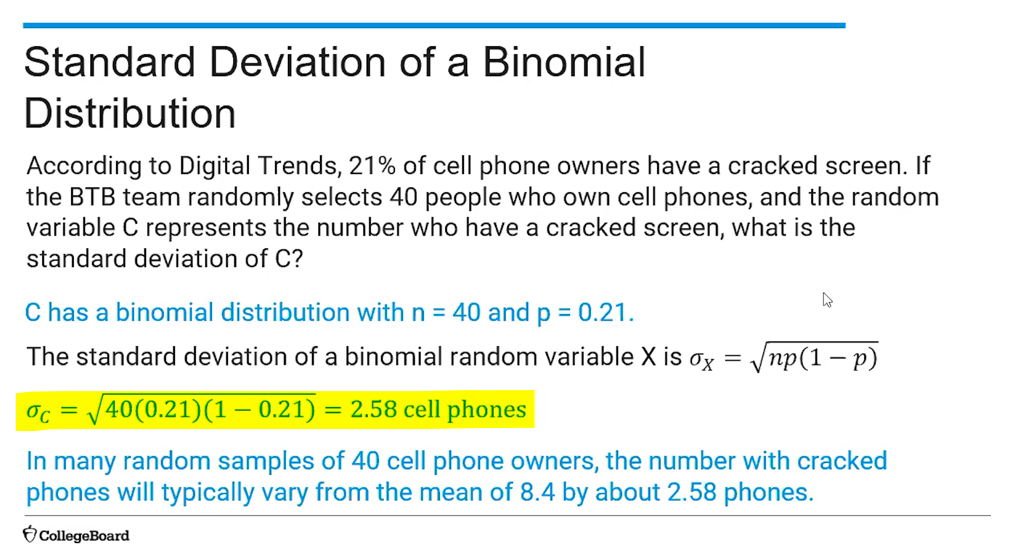
(4.11) Standard Deviation of Binomial Function Formula?
σx=√np(1-np)
(4.12) Geometric Setting vs Binomial Setting
A geometric setting involves the same elements as a binomial setting:
Two possible outcomes: success or failure
Independent trials
Each trial has the same probability of success
The only difference is this:
No fixed number of trials (Trials will be continued until there is success)
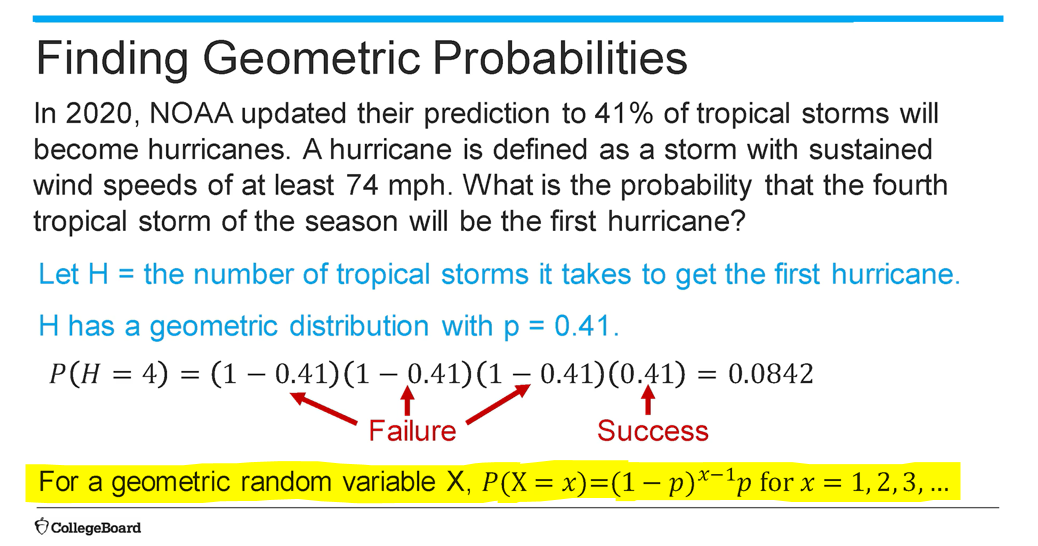
(4.12) Geometric Random Variable Probability Formula?
P(X=x) = (1-p)x-1p
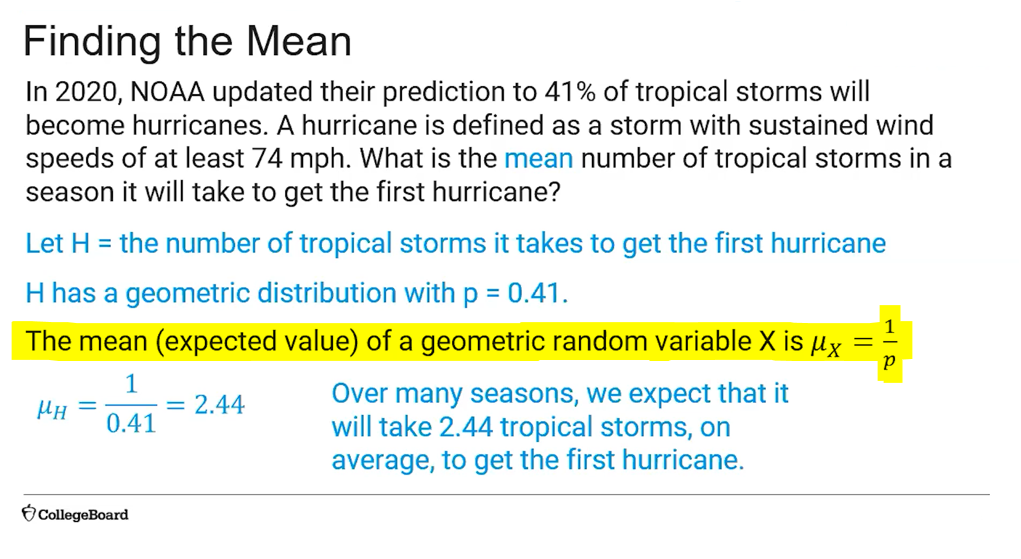
(4.12) Mean of a Geometric Random Variable Formula?
μX=1/p
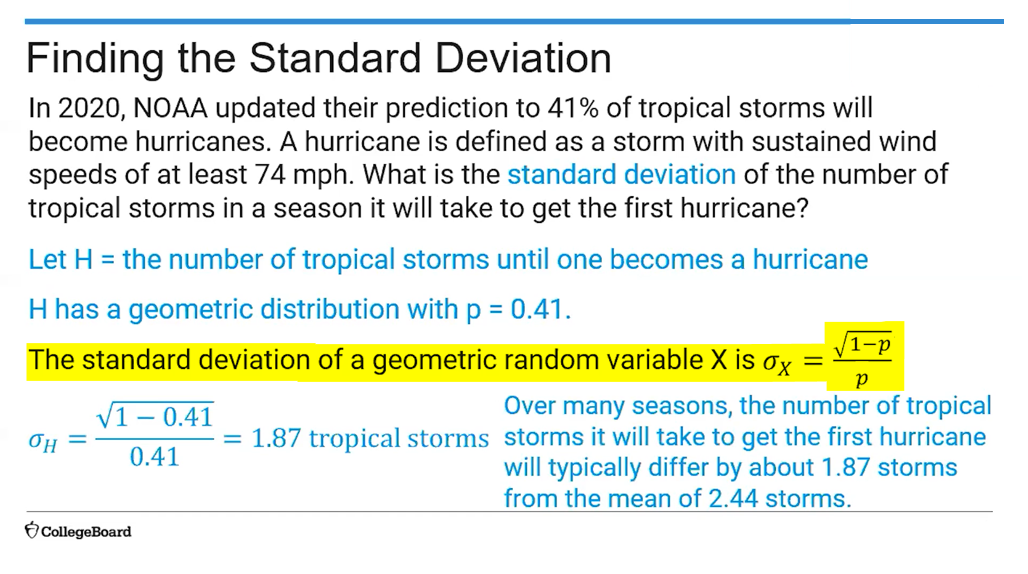
(4.12) Standard Deviation of a Geometric Random Variable Formula?