Research Methods Midterm
1/215
There's no tags or description
Looks like no tags are added yet.
Name | Mastery | Learn | Test | Matching | Spaced |
|---|
No study sessions yet.
216 Terms
experiment
any process producing an outcome
outcome
the result of a trial
event
a specific outcome or set of outcomes
sample space (S)
all possible outcomes
mutually exclusive
events that cannot occur together (e.g., dead/alive)
independent events
one event does not affect the other
complement
the opposite of an event (A and A’)
P(A)
Probability of event A occurring (e.g., rolling a 4 on a die).
P(A′)
Probability of A not happening (the complement).
Complement rule
The probability that an event does not occur = 1 minus the probability it does occur.
[ P(A’) = 1 - P(A) ]
A∪B (“A or B”)
The union of A and B — means A happens, or B happens, or both happen.
Mutually Exclusive Events
Two events that cannot occur together.
P(A and B) = 0
Independent Events
Two events where the outcome of one does not affect the other.
P (A and B) = P(A) x P(B)
Dependent Events
Two events where the outcome of one changes the probability of the other.
Conditional Probability
Probability of A occurring given that B has already happened.
P(A∣B)= P(A and B) / P(B)
Law of Addition (General Form)
Used for “A or B”
P(A or B) = P(A) + P(B) − P(A and B)
Law of Addition (Mutually Exclusive)
If A and B can’t happen together:
P(A or B) = P(A) + P(B)
Law of Multiplication (Independent Events)
Used for “A and B.”
P(A and B) = P(A) × P(B)
Law of Multiplication (Dependent Events)
When one event affects the other.
P(A and B) = P(A∣B) × P(B)
“Or” in probability
Means union (either event or both). Symbol: ∪
“And” in probability
Means intersection (both events occur). Symbol: ∩
P(A∣B) (“Given that”)
Means one event has already happened. Used in conditional probability
Probability Range
All probabilities fall between 0 and 1.
0 ≤ P(E) ≤ 1
Sum Rule of Complements
An event and its complement together always equal 1.
P(A) + P(A’) = 1
random variable
a variable whose possible values are outcomes of a random process (e.g., number of sick patients)
discrete random variable
a variable that takes countable values (whole numbers only)
(ex: number of hospital visits, number of smokers)
continuous random variable
a variable that takes any value in a range (including decimals)
(ex: height, weight, blood pressure)
probability distribution
a function that shows all possible outcomes and their probabilities
discrete probability distribution
probability distribution for a discrete random variable (counted data)
(ex: bionomial, poisson)
continuous probability distribution
probability distribution for a continuous variable (measured data)
(ex: normal, exponential, gamma)
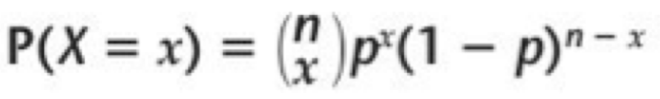
bionomial distribution
A discrete distribution showing the probability of a given number of “successes” in n independent trials.
Requirements for Binomial Distribution
Fixed number of trials (n)
Two outcomes per trial (success/failure)
Independent trials
Constant probability of success (p)
n (in Binomial formula)
number of trials
x (in Binomial formula)
number of successes
p (in Binomial formula)
the probability of success on each trial
(1−p) (in Binomial formula)
the probability of failure on each trial
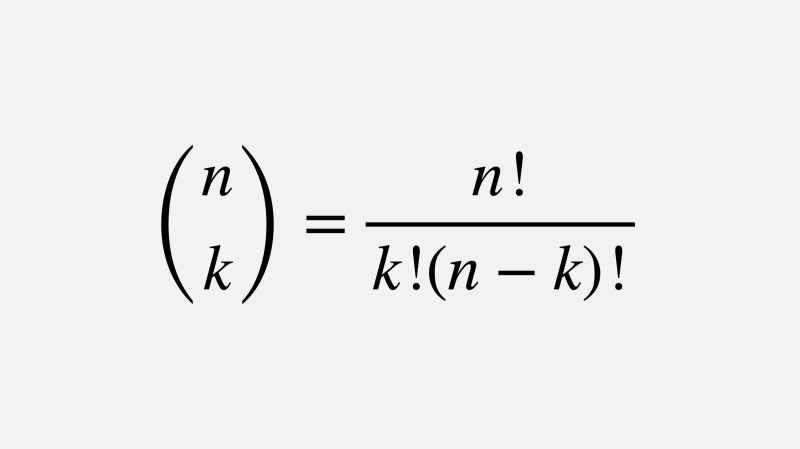
(n choose k) (usually denoted as (n choose x)
Number of ways to choose x successes from n trials.
Factorial (!)
Product of all positive integers up to that number.
4!=4×3×2×1=24
Complement in Binomial Problems
Sometimes easier to find the opposite event and subtract from 1.
ex: “At least one” = 1−P(X=0)1 - P(X=0) 1−P (X=0)
Normal Distribution
Continuous, bell-shaped distribution that’s symmetric around the mean.
Mean (μ) of Normal Distribution
The center of the distribution; where the curve is highest.
Standard Deviation (σ) of Normal Distribution
Measures spread; how far data fall from the mean.
Properties of Normal Distribution
Bell-shaped and symmetric
Mean = median = mode
Total area under curve = 1
Empirical Rule (68–95–99.7 Rule)
68% of values fall within 1σ of mean
95% fall within 2σ
99.7% fall within 3σ
Standard Normal Distribution
A normal distribution with mean = 0 and standard deviation = 1.
Z∼N(0,1)
Z-Score
Measures how many standard deviations a value is from the mean.
Z = X - μ / σ
Z-Table
A table that gives the probability (area) under the standard normal curve up to a given Z-score.
P(Z < a)
Probability that Z is less than a given value (area to the left of a on a curve.
P(Z>a)
1 minus the probability to the left.
P(Z > a) = 1 − P (Z < a)
P(a<Z<b)
Area between two Z-scores.
P(Z < b) − P(Z < a)
Area Under the Normal Curve
Represents probability; total area = 1 (or 100%).
Shape of Normal Curve
Bell-shaped, symmetric, and unimodal (one peak).
Example of Normal Variable
Height, weight, blood pressure, or test scores.
Hypothesis Testing
A statistical method for making decisions about population parameters based on sample data.
Statistical Hypothesis
A statement about a population parameter that can be tested using sample data.
Null Hypothesis (H0)
The statement that is there is no effect, no difference or no relationship in the population
Alternative Hypothesis (H1 or Ha)
The statement that there is an effect, difference, or relationship in the population.
Example of a Null Hypothesis
There is no significant difference in blood pressure between men and women.
Example of an Alternative Hypothesis
There is a significant difference in blood pressure between men and women.
Type I Error (α)
Rejecting H0 when it is actually true (a false positive)
ex: saying a treatment works when it doesn’t
Type II Error (β)
Failing to reject H0 when it is false (a false negative)
ex: saying a treatment doesn’t work when it actually does
Power of a Test
The probability of correctly rejecting a false null hypothesis
Power = 1 - β
Significance Level (α alpha)
The threshold for deciding when to reject H0.
Common values are 0.05 or 0.01
P-value
The probability of obtaining results as extreme as (or more extreme than) your sample, assuming H0 is true
Decision Rule for Hypothesis Testing
If p < α: Reject H0
If p > α: Fail to reject H0
Interpretation of Small P-value
The data provide strong evidence against H0; an effect likely exists
Interpretation of Large P-value
There is not enough evidence to reject H0
Level of Significance vs P-Value
α is chosen before the test; the p-value is calculated after data collection to compare against α.
Step 1 of Hypothesis Testing
State the null and alternative hypotheses
Step 2 of Hypothesis Testing
Choose the significance level (α alpha)
Step 3 of Hypothesis Testing
Collect data and calculate the test statistic
Step 4 of Hypothesis Testing
Find the p-value using tables or software
Step 5 of Hypothesis Testing
Compare p-value to α (alpha) and make a decision (reject or fail to reject H0)
Step 6 of Hypothesis Testing
Draw a conclusion and interpret results in context
One-sided (One-tailed) Test
Tests for a difference in one direction only (e.g., “greater than” or “less than”).
Two-Sided (Two-tailed) Test
Tests for a difference in either direction (e.g., “not equal to”).
Statistical Inference
Using sample data to make general conclusions about a population
Example of a statistical decision
“At α = 0.05, since p = 0.02 < 0.05, we reject the null hypothesis.”
Common Mistake in Interpretation
Saying “we accept H0.” Instead, say “we fail to reject H0.”
Classical Probability
Based on equally likely outcomes (e.g., fair dice)
Empirical Probability
Based on observed data or repeated trials
Subjective Probability
Based on personal judgement or belief
Upper-tail test
Tests if the sample mean is greater than the hypothesized mean
Lower-tail test
Tests if the sample mean is less than the hypothesized mean
Two-tail test
Tests if the sample mean is simply different (either direction)
Example of Hypothesis Pair
H0: No difference between males and females in mean BP
H1: There is a difference between males and females in mean BP
Two diseases can occur in a patient independently of each other. What probability rule should you use to find the chance that both occur?
Law of Multiplication for independent events → P(A and B) = P(A) × P(B)
A patient is either “HIV positive” or “HIV negative.” What kind of events are these?
Mutually exclusive — they cannot occur together, so P(A and B) = 0
If 20% of the population smokes, what is the probability that someone selected does not smoke?
Complement rule → 1 − 0.20 = 0.80
You roll a die. A = “roll even,” B = “roll greater than 3.” What outcomes belong to “A or B”?
{2, 4, 5, 6} → includes all in A, all in B, and the overlap (4, 6)
A coin is flipped twice. What is the probability of getting two heads?
Independent events → 0.5 × 0.5 = 0.25
What probability concept do you use when a question says “Given that”?
Conditional probability → P(A∣B) = P(A and B) / P(B)
In a survey, 60% like tea, 40% like coffee, and 20% like both. What’s the probability someone likes tea or coffee?
P(A or B )= 0.6 + 0.4 − 0.2 = 0.8
A public health researcher wants to know the chance that a lab test correctly detects disease given the person is infected. What probability type is this?
Conditional probability — the condition “given infected” affects the probability.
If you toss a fair coin 10 times, what type of probability distribution applies to the number of heads?
Binomial distribution (discrete outcomes: success or failure)
What is the probability of getting 0 heads in 10 flips of a fair coin?
P (X = 0) = (10 choose x) (0.5)0 (0.5)10 = 0.00098
A student’s test score has μ = 80 and σ = 10. What is the z-score for a score of 90?
Z=(90−80)/10=1
What proportion of data in a normal distribution lies within 2 standard deviations of the mean?
About 95% (empirical rule)
If a z-score is 1.25, what does that mean?
The value is 1.25 standard deviations above the mean.
A researcher finds P(Z < 1.42) = 0.9222 and P(Z < 1.25) = 0.8944. What is P(1.25 < Z < 1.42)?
0.9222 - 0.8944 = 0.0278