Tableau Foundations Cert Exam Questions
1/92
There's no tags or description
Looks like no tags are added yet.
Name | Mastery | Learn | Test | Matching | Spaced |
|---|
No study sessions yet.
93 Terms
True or False: Tableau can create worksheet-specific filters
true
A Tableau Support case can be opened in which of the following valid ways?
using the support option on the tableau website
Which of the following charts types always includes bars sorted in descending order?
pareto chart
True or False: It is possible to change the Geographic Role of a dimension
true
The calculation [Ship Date] – [Order Date] will return _______________
number of days between these dates
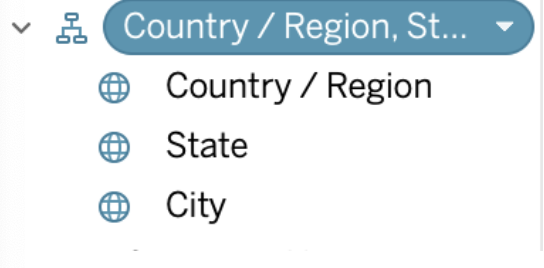
What term is used to describe the following picture?
hierarchy
True or False: A LEFT JOIN or INNER JOIN creates a row each time the join criteria is satisfied, which can result in duplicate rows. One way to avoid this is to use data blending instead.
true
__________ is a technique in Tableau which will identify marks with similar characteristics
clustering
Which of the following is the correct way to calculate Profit Ratio in Tableau?
SUM(Profit) / SUM(Sales)
Which of the following returns the Absolute Value of a given number?
ABS(number)
Which of the following 2 fields CANNOT be deleted in Tableau?
measure names, measure values
_____________ contains the visualisations, info needed to build the visualisations, and a copy of the data source.
Tableau Packaged Workbook (.twbx)
________________ is hosted by Tableau to share our visualisations publically with the world.
tableau public
The row and column shelves contain ___________________
pills
You can create _______________ for members in a dimension so that their labels appear differently in the view.
aliases
You can _______________ your data to combine two or more tables by appending values (rows) from one table to another
union
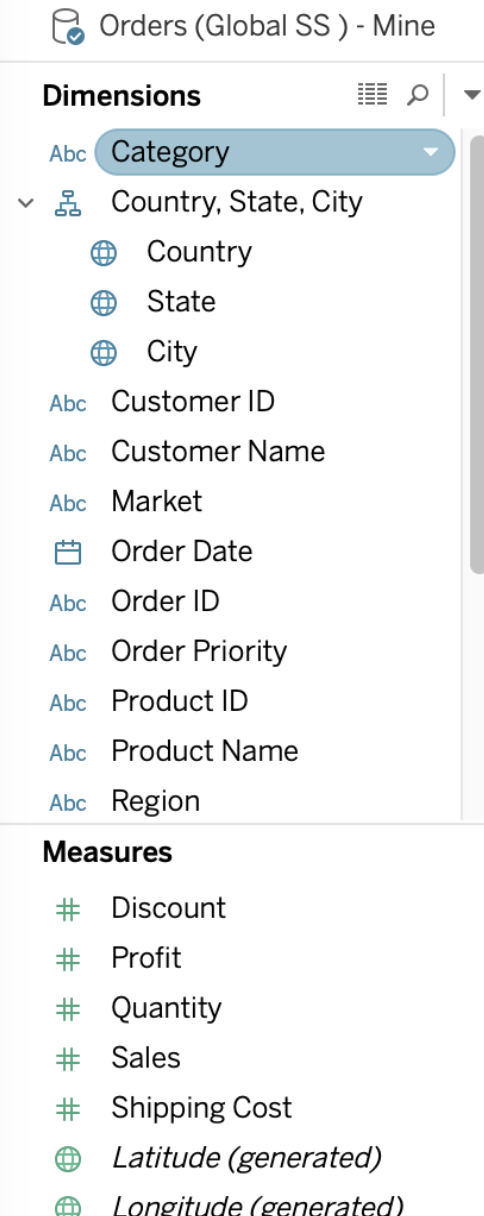
What is this view referred to as in Tableau?
data pane
Which of the following are valid ways of Grouping Data?
labels in view, marks in view, dimensions in shelf
As a general best practice, how many categories can a pie chart display effectively?
2-5
You have just created a histogram and now want to be able to change the size of bins dynamically. Using which of the following will easily satisfy your requirement?
parameters
A _____________ action is a hyperlink that points to a web page, file, or other web-based resource outside of Tableau.
go to url
Which of the following is true about ‘Incremental refresh’ when creating Extracts in Tableau?
it only adds rows that are new since the previous refresh
Which of the following is an example of a Date Part?
November
A ________________ is a single zip file that contains a workbook along with any supporting local file data and background images. This format is the best way to package your work for sharing with others who dont have access to the original data.
.twbx file
When creating a dashboard for multiple devices, which of the following Device options are available in the Device Preview section?
default, phone, tablet, desktop
Which of the following is a valid way to create Sets in Tableau?
in the data pane, right click a dimension and select create set
You want to add Custom shapes to your visualisation. Where can you add these new shapes?
In My Documents -> My Tableau Repository -> Shapes
What information is stored in a .tds file?
metadata edits, data connection information, calculated fields
True or False: It is possible to blend axes for multiple measures into a single axis
true
Which of the following are valid ways to add Totals to a view?
using analytics pane & from analysis tab in menu bar
If you decide you want to see all of the marks in the view at the most detailed level of granularity, you can __________________ the view.
disaggregate
How does Tableau know at which level to aggregate values?
Values are always aggregated at the level of granularity of the worksheet
According to Tableau’s ‘Order of Operations’, which of the following filters is applied FIRST?
extract filter
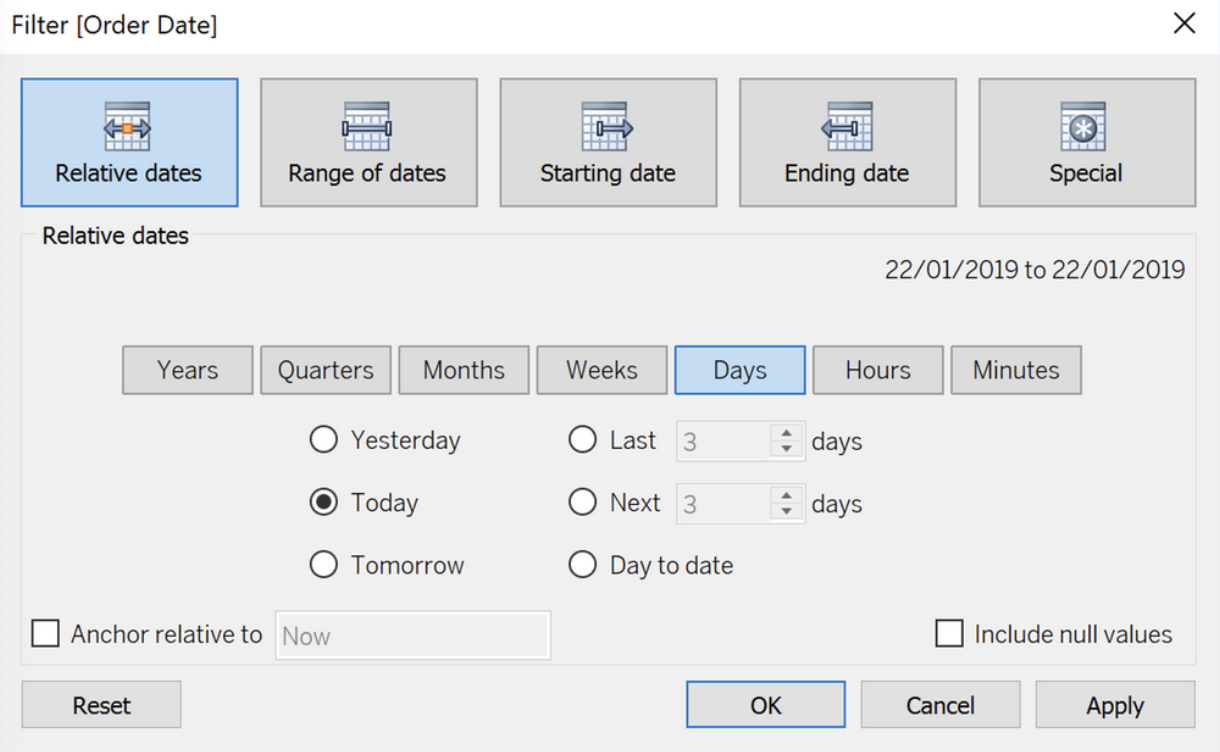
If you see the following Filter, then you’re working with _______________________
date values
When using the manage metadata option, we can create custom names for columns where _____________ is the original name of the column whereas _____________ is the custom name we created in Tableau.
remote field name, field name
What is the one most important thing you should do after creating a Dual-axis chart?
synchronise the axis
________________ files are shortcuts for quickly connecting to the original data that you use often. Data source files do not contain the actual data but rather the information necessary to connect to the actual data as well as any modifications you’ve made on top of the actual data such as changing default properties, creating calculated fields, adding groups, and so on.
.tds
For a ____________ sort, no matter how the data changes, the values will always stay in the sort order we kept stuff in.
manual
True or False: You get different filtering options for categorical and quantitative data
true
When using Animations in a Tableau, which of the following is the default duration for animations?
0.3s
How can you change the Default Aggregation for a measure in Tableau?
By right clicking the measure -> Default properties and choosing Aggregation
If you use a percent difference Quick Table Calculation, what value will be the first data value?
null
Broadly speaking, when users connect to Tableau, the data fields in their data set are automatically assigned a ____________ and a ____________.
type, role
Which of the following represent a valid method to create a Bullet Graph with the LEAST number of fields possible?
using 2 measures
Which of the following shapes does a Heat Map use by default?
square
Which of the following are valid objects when creating a dashboard in Tableau?
image, text, extension, web page

What does the following icon do in Tableau?
create a dashboard
The View Data window displays as much of the data as possible by default, up to _______________ rows.
10,000
Most viewers scan content starting at the _____________ of a page.
top left
In Tree maps, the size begins with the largest rectangle on the ________________ and the smallest rectangle on the ________________.
top left, bottom right
Broadly speaking, after an importing a dataset in Tableau Desktop, all fields in it are broken down into _______________________
dimensions & measures
You may create a context filter to:
improve performance, create a dependent numerical or top N filter
True or False : Bins can be created on dimensions
true
True or False: The Highlighting action can be disabled for the entire workbook.
true
Is it possible to use measures in the same view multiple times (e.g. SUM of the measure and AVG of the measure)?
yes
By definition, Tableau displays measures over time as a ____________
line
Which of the following would you use to connect to multiple tables in a single data source at once?
a join
Which of the following chart type makes use of ‘binned’ data?
histogram
True or False: Trend lines can only be used with numeric or date fields
true
By default, measures placed in a view are aggregated. The type of aggregation applied ______________
depends on the context of the view
For Bullet Graphs we need at least ____________ measures
2
The default path for all supporting files, data sources, icons, logs etc is in ______________________
Documents -> My Tableau Repository
We can join a maximum of ______ tables in Tableau
32
Which of the following are benefits of using Data Extracts in Tableau?
improved performance, ability to use data offline, faster to work with
When you want to first apply a filter and THEN show the Top N or Bottom N elements, which of the following filters would you use?
context filter
You have cleaned a data source properly, created some calculated fields and renamed some columns. You want to save these changes for future use cases. Which of the following would BEST satisfy this requirement?
save as a .tds file
How would you calculate GDP per capita in Tableau?
SUM(GDP) / SUM(Population)
_______________ enables us to create workbooks and views, dashboards, and data sources in Tableau Desktop, and then publish this content to our own server.
tableau server
Which of the following is not a Trend Line Model?
binomial trend line
True or False: A sheet cannot be used within a story directly. Either sheets should be used within a dashboard, or a dashboard should be used within a story.
false
Which of the following is a good reason for using a bullet graph?
comparing actual sales against target sales
True or False: We can disaggregate the data, to see all of the marks in the view at the most detailed level of granularity
true
What does the box in a box plot represent?
The interquartile range
What does it imply if a field has a blue background?
it is discrete
For creating variable sized bins we use _________________
calculated fields
True or False: A reference line cannot be added from the Analytics Pane
false
True or False: LEFT JOIN returns all rows from the left table, with the matching rows in the right table
true
To use a quick table calculation, which of the following programming languages do you need to know?
none are needed
When using a Blend, what is the color of tick-mark on the primary and secondary data sources respectively?
blue, orange
True or False: Context Filters are executed after Data Source filters
true
Which data type in Tableau does this icon represent?

boolean
For a relative date filter, the default anchor is _________________
today’s date
Which of the following are valid ways to trigger actions for a Dashboard?
hover, select, menu
We can use ______________ as a static tool to open and interact with packaged workbooks with extracted data sources that have been created in Tableau Desktop.
tableau reader
Dates in Tableau are typically treated as ______________
dimensions
You can use the __________________ in Tableau to clean / organise your data.
Data interpreter
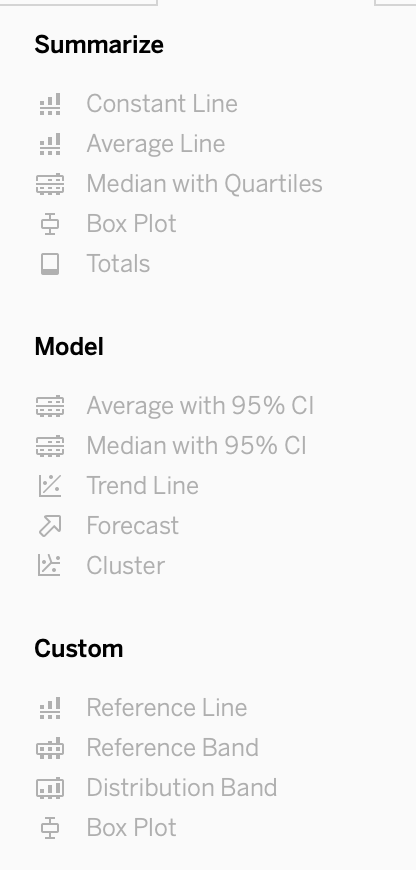
What is this entire view referred to as in Tableau?
analytics pane
Is it possible to deploy a URL action on a dashboard object to open a Web Page within a dashboard rather than opening the systems web browser?
YES, we can do this with the help of a Web-Page object
How do you identify a continuous field in Tableau?
It is identified by a green pill in a visualization
True or False: Sets can be created on Measures
false
The icon associated with the field that has been grouped is a ______________
paper clip
A field that shows average home values for the United States in 2016 is most likely :
an aggregated measure