Pre lab quiz 2 measuring Avogadro's number
0.0(0)
0.0(0)
Card Sorting
1/22
Earn XP
Description and Tags
Study Analytics
Name | Mastery | Learn | Test | Matching | Spaced |
|---|
No study sessions yet.
23 Terms
1
New cards
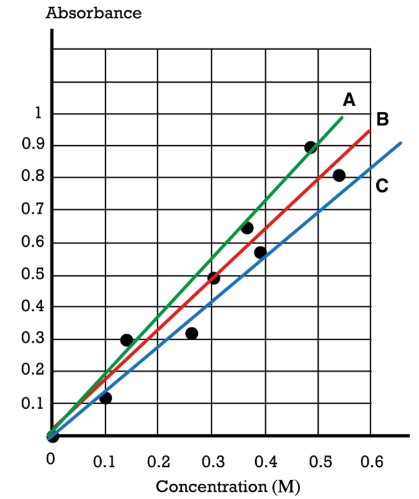
Red line (B)
Consider the given plot of absorbance vs. concentration.
Which line is the best-fit line to represent the black data points?
Which line is the best-fit line to represent the black data points?
2
New cards
reasoning for question 1
The red line (B) goes through one data point, three data points are above it, and four data points are below it. This line has approximately the same number of data points above it as below it. Therefore, the red line (B) is the best-fit line for the plotted data points.
3
New cards
Identify any linear trend in scattered data
\
Predict behavior between measured data using its slope
\
Predict behavior between measured data using its slope
The purpose of the best-fit line on an experimental scatterplot is to (blank). The best-fit line allows us to (blank).
4
New cards
units of quantity displayed on axis
\
name of quantity displayed on axis
\
name of quantity displayed on axis
What needs to be included in the label for each axis of a graph?
5
New cards
y-axis label
\
x-axis label
\
title
\
x-axis label
\
title
Identify the aspects of the pictured graph that are missing or contain errors.
6
New cards
2\.0 g/mL
Consider the given graph of an objects mass and volume. what is the density of the object
7
New cards
Reasoning for question 5
The density is the mass per volume of an object. Therefore, the slope of the line is the density of the object.
\
The formula for the slope of a line is
slope=
y2-y1 / x2-x1
\
where *y*1 and *y*2 represent points on the *y*-axis, and *x*1 and *x*2 represent points on the *x*-axis.
Substitute numerical values into the equation using any two sets of point values from the graph. The first two points from the origin, for example, have x, y values of (1, 2) and (2, 4). Plug these numbers into the equation and solve for the slope in g/mL.
slope= 4-2 / 2-1 = 2.0
\
The formula for the slope of a line is
slope=
y2-y1 / x2-x1
\
where *y*1 and *y*2 represent points on the *y*-axis, and *x*1 and *x*2 represent points on the *x*-axis.
Substitute numerical values into the equation using any two sets of point values from the graph. The first two points from the origin, for example, have x, y values of (1, 2) and (2, 4). Plug these numbers into the equation and solve for the slope in g/mL.
slope= 4-2 / 2-1 = 2.0
8
New cards
1307\.82 C
What is the charge (C) delivered by a current with an average of 0.71 A over 30.7 minutes?
9
New cards
Reasoning for question 6
Charge, in Coulombs, is the product of current, in Amps, and time, in seconds. The time needs to be in seconds because 1 Amp is 1 Coulomb per second.
Start by converting time given in minutes to time in seconds.
\
time in seconds= 30.7 min × 60 sec / 1 min
\
Then, multiply the time in seconds by the current to find the charge delivered.
\
charge in C = time in seconds×0.71
A=time in seconds×0.71 C/s
Start by converting time given in minutes to time in seconds.
\
time in seconds= 30.7 min × 60 sec / 1 min
\
Then, multiply the time in seconds by the current to find the charge delivered.
\
charge in C = time in seconds×0.71
A=time in seconds×0.71 C/s
10
New cards
0\.23 mol
Calculate the moles of ammonia present in a 3.939 g sample of ammonia, which has a molar mass of 17.030 g/mol.
11
New cards
Reasoning for question 7
The molar mass of a compound is the mass of one of compound. Therefore, if you divide a mass of the compound by its molar mass, you will find how many moles of the compound are present.
\
Moles of substance = mass in g times 1 mol of substance / molar mass
\
Moles of substance = mass in g times 1 mol of substance / molar mass
12
New cards
30\.067 g/mol
molar mass of C2H6
13
New cards
32\.059 g/mol
molar mass of S
14
New cards
31\.998 g/mol
Molar mass of O2
15
New cards
35\.446 g/mol
molar mass of Cl
16
New cards
16\.042 g/mol
molar mass of CH4
17
New cards
18
New cards
19
New cards
20
New cards
21
New cards
22
New cards
23
New cards