Unit 1 - Changing populations
1/46
There's no tags or description
Looks like no tags are added yet.
Name | Mastery | Learn | Test | Matching | Spaced |
|---|
No study sessions yet.
47 Terms
2 Reasons for uneven global population distribution
Physical: determine where it is possible to actually live - this would have been the case in the past but now due to advanced technology we can have water piped to our houses even if we don’t live close to a well for example
Climate – Sahara Desert (too hot & dry)
Indirect: through impact climate has on soils and vegetation - e.g. tropical rainforest is hot and humid which creates dense vegetation making it difficult for humans to populate there
Relief – Himalayas (too steep)
Altitude – Andes Mountains (thin air)
Latitude – Equatorial Africa (hot/wet vs. temperate Europe)
Water supply – Nile River Valley (fresh water access)
Natural resources – Middle East (oil-rich)
Soils – Ganges Basin (fertile land)
Human: Responsible for finer details + determine where population is concentrated rather than overall distribution
Employment opportunities – New York City (job magnet)
Communications – Tokyo (tech & networks)
Accessibility – London (major transport hub)
Government policy – China (One-child policy’s legacy)
Tanzania and Brazil govts wanted to decentralise populations so they 'moved' capital cities
Tanzania = Dodoma instead of Dar es Salaam
Brazil = Brasília instead of Rio de Janeiro
Wars – Syria (conflict-driven migration)
Health care – Scandinavia (universal, high-quality care)
CASE STUDY: China - Uneven population distribution
Densely populated: South East, 9 megacities - Shanghai, Beijing, Guangzhou, Shenzhen, Tianjin, Chengdu, Wuhan, Hangzhou, Chongqing
Why dense: access to ports, flatter land, economic opportunities, rains often for agriculture
Sparsely populated: North West - Tibet, Xinjiang , Qinghai, Gansu, Gobi Desert, Taklamakan desert
Why sparse: mountainous, desert land, low agriculture due to physical, no ports, extreme weather conditions like cold, limited accessibility - no roads
Voluntary internal migration: move from North West to South East, rural to urban, aim of finding job that can’t be found in northwest
Jobs in southeast: working in ports (cargo handling), working in tourism (4th most visited country), working in hospitality, working in construction (rapid growing pop. means more housing required)
Economic development in core:
Shanghai is next to Yangtze River which is a shipping route and deep water port which allows for international and national trade
Beijing is where companies establish headquarters to be in Chinese markets (they have certain laws and policies which makes it easy to create company) and host international events like olympics in 2008
Economic development in periphery:
Tibet isn’t experiencing development because of challenging physical features - mountainous land, high altitude, harsh weather like cold restricts it from developing and thriving economically
Mega city growth: fast growth = 2.03% increase from 2022-2023 in Beijing and a further 1.94 in 2024, Shanghai = 2.59% 2022-2023
CASE STUDY: USA - Uneven population distribution
Densely populated: Eastern side - New York, chicago, Miami, Florida, California is southwest but also very dense
Why dense: huge economic centers and job opportunities, cultural diversity, extensive transportation networks, entertainment
Sparsely populated: northwest - Alaska, Montana, Nevada
Why sparse: Large land area ( uninhabited wilderness), Extreme climates (extreme cold), fewer jobs, water scarcity in Nevada
Voluntary internal migration: loads moving out of west coast (L.A) because high living , crime, pollution - Texas is gaining new due to cheaper living -
East coast bringing in more because diverse economy and major financial centres - People leaving New York cuz TOO EXPENSIVE
Economic development in core:
Chicago - Major transportation and manufacturing hub
Washington n DC - role as political and administrative centre and federal government
Silicon Valley in California - tech
L.A - entertainment and media
Economic development in periphery:
Alaska - no development bc sparse population, extreme cold, western indigenous communities, limited services and transportation access
Megacity growth: no actual mega cities bc population is spread across many cities, strong sense of regional identity so hard for cities to merge
Economic development
Transition of a country from primary industries to an economy based on secondary , tertiary and finally quaternary industries
Progress is achieved through introduction of technologies and results in increased wealth and improved standards of living
Main economic indicators
GDP
Gross domestic product - total value of goods and services produced within a country in a given period of time
GNI
Gross national income - total value of goods and services produced within a country and income and payments from abroad
Most prefer GNI bc most economies are global so it makes sense to count income and payments to and from other countries
Purchasing Power Parity
Measure how much a dollar might buy for the average consumer in a country
Accounts for cost of living
This reduces HIC values and increases LIC bc cost of living is much higher in HIC
Problems with economic indicators
Fail to account for income inequality
They are averages which does account for rang of income: Indonesia is - 9th for GNI PPP but most of money is concentrted in a small proportion of rich
Doesn’t account informal economy
money earned by workers such as street vendors and shoe shiners
this may not matter in predominantly formal economies like USA or Europe
parts if west Africa (Benin, Niger, togo), South America (Columbia and Bolivia) and India = informal makes up to 39-59% if GDP
Doesn’t equate to quality of life
development may be more effectively measured through education, health, other social indicators
Types of migration
Internal Migration: Movement within the same country.
Example: Rural to urban migration in China – People leave farming villages to work in big cities like Beijing or Shenzhen.
Voluntary Migration: People choose to move, often for better jobs or quality of life.
Example: Polish workers moving to the UK – After Poland joined the EU in 2004, many moved for better wages and opportunities.
International Migration: Movement from one country to another.
Example: Mexicans migrating to the USA – Often for work, education, or to reunite with family.
Forced Migration: People are made to move due to conflict, disaster, or persecution.
Example: Syrian refugees fleeing civil war – Many have sought asylum in Turkey, Europe, and beyond.
Core vs Periphery
Core: wide range of services, good network of electricity/gas/water supplies, high literacy rates, well paid jobs, centre for decision making, good quality housing, cultural and racial diversity, high levels of foreign direct investment
Periphery: less developed, lower standards of living, higher levels of poverty, insufficient services, limited access to potable water, lack of job opportunities, population growth is higher because children are seen as economic asset, lack of job causing people to move to core
Population momentum
Population momentum refers to the continued growth of a population even after fertility rates decline
It happens because:
Fertility is only relevant for the childbearing population, and it takes years for younger generations to reach childbearing age.
It may take an entire average lifespan before reduced fertility leads to noticeable decreases in population growth.
Effects on population projections:
Projections based on current fertility rates must account for the size of the population in childbearing age to ensure accuracy.
Delays caused by population momentum can obscure short-term trends in data, limiting immediate projection accuracy.
Factors influencing fertility rates
Economic Roles of Children
LICs: In rural regions of India, children work on farms or in local markets to support the family’s income, which leads to higher fertility rates.
HICs: In California, U.S., the high costs of education, housing, and healthcare make raising children expensive, contributing to lower fertility rates.
Urban vs. Rural Living
Urban areas: In Tokyo, Japan, limited living space, high living costs, and demanding work cultures result in fewer children and delayed marriages.
Rural areas: In rural areas of Malawi, children are often seen as economic assets who help with farming, leading to higher fertility rates.
Cultural and Lifestyle Norms
HICs: In Stockholm, Sweden, the emphasis on material wealth, career development, and personal freedom leads people to have fewer children and delay childbearing.
LICs: In rural areas of Mexico, larger families are culturally valued, with children often playing significant roles in family and community life, driving higher fertility rates.
Infant Mortality Rates and Pensions
LICs: In countries like Nigeria, high infant mortality rates encourage families to have more children to ensure that some survive to adulthood.
HICs: In Germany, with a strong pension system and low infant mortality, families tend to have fewer children as state support provides security in old age.
Status of women
Low-status regions: In rural Afghanistan, women often lack access to education and employment, typically marry early + have many children —> higher fertility rates.
High-status regions: In Norway, women have access to higher education + career opportunities, tend to marry later, have fewer children, + effectively use family planning methods.
Factors influencing mortality rates
Income
High-income: In Switzerland, high-income have access to top-tier healthcare, nutrition, and living conditions, which significantly reduce mortality rates and improve overall life expectancy.
Low-income: In parts of rural India, limited income and healthcare access contribute to higher mortality rates, as people struggle with poor living conditions and inadequate healthcare.
Literacy/Education
Educated women: In Kenya, women with secondary education tend to have fewer children and are more likely to use healthcare services, leading to better child survival rates.
Uneducated women: In Bangladesh, women with little education often have larger families and fewer resources, contributing to higher child mortality rates due to inadequate care.
Access to Food
HICs: In the U.S., access to excessive amounts of processed foods contributes to higher rates of obesity, leading to increased mortality from conditions like heart disease and diabetes.
LICs: In Ethiopia, limited access to nutritious food and frequent malnutrition contribute to high mortality rates, especially among children under five, due to deficiencies like stunting and weakened immune systems.
Healthcare
Access to healthcare: In the UK, access to the National Health Service (NHS) provides widespread disease prevention, treatment, and health education, resulting in low mortality rates.
Limited access to healthcare: In rural parts of Afghanistan, where public health systems are limited, mortality rates are higher due to insufficient medical care and lack of preventive measures.
Water Supply and Sanitation
Access to clean water: In Singapore, widespread access to clean water and modern sanitation systems helps prevent waterborne diseases, leading to lower mortality rates.
Lack of sanitation: In areas of Haiti, poor access to clean water and sanitation has led to outbreaks of cholera and dysentery, significantly increasing mortality rates, especially in children.
Shelter
Adequate shelter: In Norway, people live in well-built, insulated homes that protect against extreme temperatures and disease vectors, contributing to lower mortality rates.
Inadequate shelter: In parts of rural Bangladesh, many people live in poorly constructed homes that leave them vulnerable to extreme weather, disease, and malnutrition, leading to higher mortality rates.
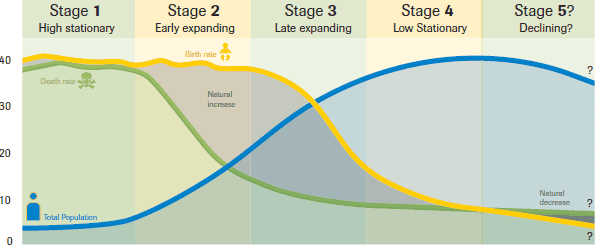
Demographic Transition Model
The Demographic Transition Model (DTM) was developed to describe the changes in population from a predominantly agrarian society to a post-industrial society.
Stage 1: No current countries - historically preindustrial England
Stage 2: Afghanistan + Niger
Stage 3: India + Mexico
Stage 4: USA + Brazil
Stage 5: Japan + Germany
Criticisms:
Eurocentric bias: Based on the experience of European countries and may not apply universally.
Rapid development in LICs: Some low-income countries are progressing through the stages faster than expected due to improvements in healthcare, education, and access to contraception.
Exclusion of external factors: The model does not account for the impact of natural disasters, epidemics (e.g., HIV/AIDS), wars, government population policies, and migration.
Example: The HIV/AIDS epidemic in sub-Saharan Africa disrupted the demographic trends expected in the DTM by increasing mortality rates dramatically.
Cultural and religious influences: In some LICs, high birth rates persist due to cultural and religious factors, keeping countries stuck at Stage 2.
Example: Countries like Niger and other parts of Sub-Saharan Africa experience persistently high birth rates, partly due to cultural norms and religious practices.
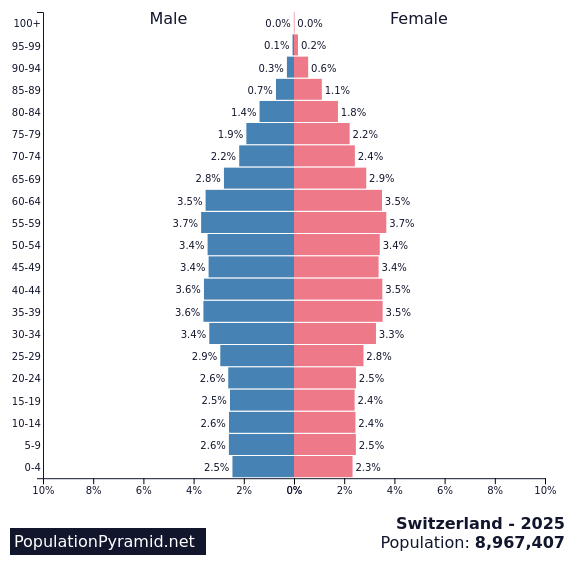
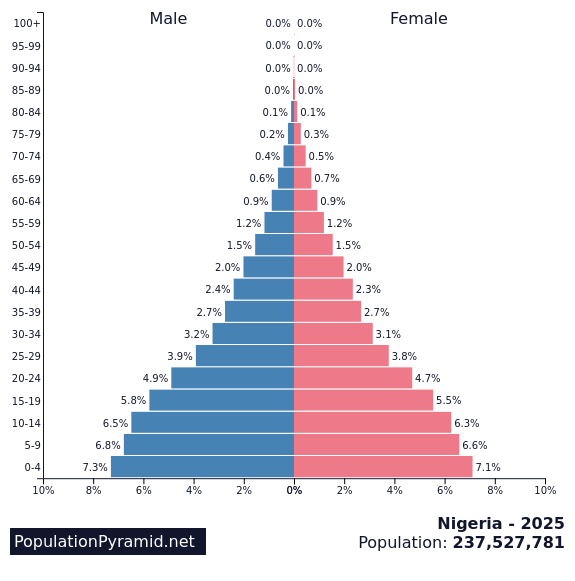
Population Pyramids
A population pyramid is a graphical illustration used to show the age and gender distribution of a population.
It displays horizontal bars representing 5-year age groups, with males typically shown on the left side and females on the right.
Population pyramids offer insight into demographic characteristics like fertility, mortality, and life expectancy.
Example Countries:
High Fertility: In Nigeria (Stage 2), the pyramid has a broad base, indicating high birth rates.
Aging Population: Switzerland (Stage 4) has a narrower base and fewer young people, showing low birth rates and an older population.
Dependency ratio
The dependency ratio compares dependents (under 15 and over 64 years old) to the working-age population (15–64 years). It shows how many people are supported by every 100 workers.
Youthful dependency: refers to the proportion of people under 15 who are dependent on the working population.
High Youthful Dependency: Mali (half the population is under 15)
Low Youthful Dependency: Macao (only 13% under 15)
Old-age dependency: refers to the proportion of people 65 and older compared to the working population.
High Old-Age Dependency: Japan (26% over 65)
Low Old-Age Dependency: UAE (1% over 65)
High dependency ratio increases the economic burden on the working population, requiring more resources for healthcare, education, and elderly care.
High Dependency: Uganda (high youthful dependency)
Low Dependency: Qatar (high workforce with low dependency)
Countries with large numbers of migrant workers tend to have a low dependency ratio due to predominantly working-age population (UAE)
Origins of forced migration in Syria vs Sahel region
Syria
The Syrian civil war, beginning in 2011, triggered forced migration.
Key areas include:
Aleppo, Idlib, Raqqa, Daraa—heavily affected by bombing, destruction, human rights violations, and ongoing fighting.
Sahel region
Environmental Factors: The Sahel experiences severe droughts due to lower-than-average rainfall, soil degradation, and climate change impacts.
Affected countries:
Senegal, Mauritania, Mali, Niger, Nigeria, Chad, etc., are poverty-stricken and experience reduced agricultural productivity.
Internal displacement and migration often occur from rural to urban centers such as Bamako (Mali) and Niamey (Niger).
Main push factors for syrian refugees
Bombing and destruction of cities, leading to a lack of infrastructure, healthcare, clean water, and shelter.
Human rights violations (e.g., forced child combat, torture).
Prolonged conflict, killing more than 580,000 people since 2011.
Social + economic + environmental consequences for Syrian migrants + affected individuals in the Sahel region
Syria
Social: Mental health challenges, loss of social networks, overcrowded conditions leading to malnutrition and depression.
Economic: Lower wages and job market strain in host countries, economic collapse in Syria.
Environmental: Cramped conditions in camps, spread of diseases due to poor sanitation.
Sahel region
Social: Family separation, Education disruption for children due to changes in schools, Loss of social networks and cultural tensions.
Economic: Resource pressure in urban destinations (increased strain on healthcare, education), Wage suppression and competition for limited jobs in migrant areas, Loss of agricultural labor in rural areas affecting food security.
How does Syrian + Sahel migration affect origin + destination areas
Syria
Origin (Syria): Destruction of culture, educational disruption, psychological trauma.
Destination (Jordan, Lebanon): Economic strain (Jordan’s GDP loss of 6% annually), deforestation for camp space, tensions between refugees and locals.
Sahel
Origin: Land degradation (especially in Mali's Mopti Region) due to unsustainable farming, Pressure on local governance in rural areas with out migration of workers (e.g., Mali Mopti Region), leaving local authorities without manpower.
Destination: Deforestation and greater demand for resources like water, Biodiversity loss from expansion of urban areas, Air pollution in urban areas like Bamako due to migration-driven growth, Strain on urban governance (e.g., Bamako, Niamey) to handle rising migration, social services, and infrastructure demands, International and national aid programs assist but may not fully meet needs.
Power dynamics in Syrian conflict
Bashar al-Assad leads Syria with military and diplomatic support from Russia and Iran.
International Players: Including the U.S., Turkey, and opposition groups complicate peace efforts.
The conflict involves diverse factions, each with varying objectives and alliances.
Primary environmental causes of Sahel region migration
Overgrazing and deforestation led to soil degradation and crop failure, rendering land useless.
Climate change worsens droughts due to global dimming, changing rain belts, rising sea surface temperatures, and increased greenhouse gases.
Water scarcity exacerbates the need to migrate.
Future outlook for people living in the Sahel
If climate change continues and emission reductions are insufficient, more severe droughts and water scarcity are likely.
This will worsen food insecurity, and increase displacement, straining neighboring countries.
Water competition may lead to conflicts and humanitarian crises.
Militant groups may exploit vulnerabilities in the region, further destabilizing it.
Key characteristics of Niger’s population + development
Population Growth: High natural increase rate (4.0%) and total fertility rate (7.6 children per woman).
Life Expectancy: Increased from 35 to 61 years.
Agriculture: 90% of the population depends on agriculture, leading to high fertility rates.
Challenges: Poor country with a low HDI (0.348), and struggles with poverty and health issues.
Key characteristics of Sierra Leone population + development
Population Growth: NIR increased overall by 1%, with fluctuations due to a civil war (1990s).
Life Expectancy: Increased from 30 to 51 years, but dropped below 40 during the civil war.
Fertility Rate: Decreased from 6 children per woman to 4.6.
Agriculture: 71% of the population depends on agriculture.
Impact of Conflict: Civil war and blood diamond conflict caused setbacks in development.
Key characteristics of India population + development
Population Growth: NIR decreased from 2.0% to 1.2%.
Fertility Rate: Dropped from 5.9 to 2.4 children per woman.
Life Expectancy: Increased from 41 to 68 years.
Development: India is industrialising, urbanising, and moving toward stage 3 of the DTM.
Agriculture: 49% of the population still dependent on agriculture, but improving through industrial growth.
Key characteristics of Japan population + development
Population Growth: Negative NIR of -0.2% (population decline).
Fertility Rate: Dropped from 2.0 to 1.4, below replacement level.
Life Expectancy: Increased from 67.7 to 83.6 years.
Agriculture: Only 1.2% of the population is involved in agriculture.
Urbanisation: Highly urbanised (93.5%) with the world’s largest megacity, Tokyo (37.8 million people).
Positive impacts of megacity growth on individuals + societies
Economic Powerhouses:
Megacities are hubs of economic activity and innovation. In 2014, 60% of global GDP came from just 600 cities, with many megacities accounting for a substantial percentage of national GDP.
Example: London generates almost half of the UK’s GDP.
Attraction for Global Companies:
Megacities draw transnational companies due to their advanced infrastructure (e.g., transport, skilled workers, education), creating employment opportunities and boosting local economies.
Cultural and Commercial Impact:
Cities foster cultural growth, social networking, and financial services, further contributing to economic prosperity and global influence.
Negative impacts of megacity growth on individuals + societies
Infrastructure Strain:
Rapid growth often leads to inadequate infrastructure (roads, water, health services, housing). The resulting problems include traffic congestion, slums, high crime rates, and air pollution.
Environmental Sustainability:
Megacities use non-renewable resources (metal, oil, concrete) and generate high energy consumption, contributing to fossil fuel dependency, high carbon emissions, and waste disposal issues.
Pollution:
Air pollution and smog are significant issues, especially in LIC megacities, causing serious health risks like respiratory diseases and heart problems. Water and noise pollution are also major environmental challenges.
Lack of Housing:
Growing populations lead to the formation of shantytowns or slums, often illegal and lacking essential services like water, sanitation, and healthcare, which worsens poverty and social unrest.
Challenges refugees face when migrating - Children
Young refugee population: 51% of refugees are children under the age of 18.
Financial & Emotional Challenges:
Children typically lack the financial resources needed for an international move.
Refugee children face significant emotional and social impacts from displacement, which can be harder for them to handle.
Access to Education: Many refugee children struggle to access quality education due to language barriers, legal status, and financial difficulties, limiting their future opportunities.
Challenges include the loss of family members, lack of proper education, and social isolation.
Factors driving decline in global family size
Economic factors:
Children are seen as a financial burden because education is compulsory and raising children is expensive. The cost of living, including housing and child care, influences family size.
Health improvements:
Reduced child mortality means fewer children are needed for security, and longer life expectancies mean fewer children are needed for support in old age.
Family planning:
The availability of affordable, effective contraception and family planning advice has contributed to fewer children being born.
Women's education and empowerment:
As women's status improves through education and gender equality, they marry later and have fewer children. Educated women tend to have healthier children and higher fertility control.
Positive + Negative impacts of decreasing family size on economies + societies
Positive impacts:
A smaller population can stabilize over time, which can ease pressure on resources and the environment.
With fewer children, there can be a higher investment in education and career opportunities for women, leading to a more educated and skilled workforce.
Negative impacts:
A declining family size leads to an ageing population with fewer workers to support the economy, government pensions, healthcare, and education.
This leads to potential economic challenges, such as a shrinking tax base and demand for goods and services dropping.
In regions with very low fertility rates, the labour force may become insufficient to maintain economic growth.
Factors influencing imbalances in global sex ratios
Cultural and Societal Preferences: In some cultures, there's a strong preference for male children (e.g. in Middle Eastern countries), which can lead to gender-selective practices such as abortion or infanticide.
Sex-Selective Technologies: The availability of ultrasound and abortion in countries like China and India has led to skewed sex ratios due to selective abortion of female fetuses.
Economic Stress: Economic factors, like birth weight disparities, may cause higher male infant mortality, such as in post-WWII Germany.
Immigration Policies: Certain countries (e.g. Qatar) rely on male migrant workers, sharply increasing the male population in those areas.
Male-Focused Inheritance: Societies with strong pressure for male heirs can result in families continuing to have children until a boy is born, causing sex ratio imbalances.
Advantages + Disadvantages of an ageing population
Advantages
Active Retirees: Older people often stay active, contributing as volunteers or offering expertise to the workplace.
Cultural Preservation: Older people help maintain cultural traditions and practices that may otherwise fade.
Lower Crime Rates: Communities with a higher percentage of elderly tend to have lower crime rates.
Disadvantages
Increased Healthcare Costs: An ageing population often requires more healthcare services, leading to higher costs for individuals and the government.
Workforce Shortages: As the population ages and retires, there may be fewer working-age individuals to fill jobs, leading to labor shortages and potential economic decline.
Pension Strain: A higher number of retirees can strain public and private pension systems, possibly leading to financial instability.
Causes of Japan’s ageing population
Low Fertility Rates: Japan has had fertility rates below replacement level for over 40 years, resulting in fewer young people.
Delayed Marriages: Many people marry later in life or not at all, reducing the number of children born.
Strong Work Focus: A culture that emphasizes work has led to less time for family life and child-rearing.
High Cost of Living: Expensive housing and general living costs discourage having more children.
High Life Expectancy: Japan has one of the highest life expectancies globally, contributing to a higher proportion of older individuals.
Key policies for managing the economic strains of an ageing population
Change the Retirement Age:
Governments can increase the retirement age to keep people working longer, thus paying taxes for a longer period.
This helps delay pension payments, reduce the strain on social welfare, and increase the available labor force.
A challenge is that this policy may be unpopular, especially for older workers with physically demanding jobs.
Increase Income Tax:
Increasing taxes generates more revenue for pensions but may drive workers out of the country and worsen the dependency ratio.
Pro-natalist Policies:
Governments can incentivize higher birth rates through measures such as tax breaks, child allowances, or paid maternity leave.
Example: Japan has adopted a range of pro-natalist policies to boost fertility rates and tackle an ageing population.
Immigration Policies:
Relaxing immigration laws to allow more foreign workers can increase the labor force, balancing the dependency ratio.
However, such changes may face cultural and political opposition, and their impact on the demographic structure might be slow.
Pro-natalist policies
Pro-natalist policies aim to encourage higher fertility rates to balance the age dependency ratio by ensuring a future workforce.
Common pro-natalist incentives include:
Baby Bonuses: Cash payouts for each child born (e.g., in Singapore).
Paid Parental Leave: Examples include Sweden, where parental leave is up to 16 months, with shared costs between the state and employer.
Free Health and Education Services: Examples like the UK offering free health and dental care for children.
Anti-natalist policies
Anti-natalist policies are governmental strategies that seek to reduce fertility rates and limit population growth.
Common approaches include:
One Child Policy (China): Tax penalties, charges for education/healthcare, and reduced child-care options for families with more than one child.
Public Education & Family Planning: Awareness campaigns about the benefits of smaller families and providing access to contraception and sterilization.
Emancipation of Women: Educating women and increasing workforce participation, which delays marriage and childbirth.
Negative Consequences:
Ageing Population: Reduced birth rates may create long-term issues of an ageing population with fewer working-age individuals.
Selective Abortion & Baby Abandonment: In some cultures, especially with the preference for male children, this can lead to gender imbalances.
Cultural Resistance: In countries with traditional beliefs, such as large families and male child preference, these policies can clash with cultural values, resulting in slower reductions in birth rates.
Gender inequalities in the workplace + education
Workplace
Paid vs. Unpaid Work: While men are more involved in paid labor, women globally perform the majority of unpaid care work (looking after children, elderly, etc.), which lacks income and benefits like pensions and healthcare.
Workforce Participation: A higher percentage of men are employed compared to women, and women often lack access to the same opportunities in leadership roles.
Education:
While progress has been made, inequality is still present, especially in low-income countries, where cultural gender roles influence access to education.
Countries with high human development generally show less imbalance, whereas low-income countries tend to have larger gender gaps in education.
Solutions to close the gender gap + MINI CASE STUDIES
Gender quotas (bound to contribute): In Canada and Rwanda, quotas for women in politics ensure more representation.
Female education: In the UAE and Saudi Arabia, female university enrolment rates surpass those of many other countries.
Legislation against child marriage: Egypt is working to raise the legal marriage age to combat child marriage.
MINI CASE STUDIES - countries addressing gender inequality
Rwanda
Focused on maternal and child health, reducing mortality by over 70%.
Increased skilled health providers and universal health care at community levels.
Sweden
Sweden offers 16 months of paid parental leave, encouraging women to combine work and family.
Policies and quotas ensured equal political participation, leading to higher women’s political representation.
Human trafficking vs Smuggling
Human trafficking: Illegal transportation or exploitation of people, often for forced labour or sexual exploitation.
Forced labour: Victims work under the threat of violence.
Example: Factory sweatshops or agricultural work under harsh conditions.
Sexual exploitation: Victims are forced into prostitution or sexual slavery.
Bonded labour (debt bondage): Victim’s labour is forced to pay off an unfair debt.
Extraction of organs/tissue: Illegal trade in body organs like kidneys or eggs. Example: Trafficking for organ transplants.
Forced marriage: Individuals are trafficked and forced into marriages.
People smuggling: Voluntary movement of people through illegal means; it does not involve the person being held against their will.
Example of people smuggling: Illegal immigration with the person's consent.
Solutions to combat human trafficking
UN Convention against Transnational Organized Crime (UNTOC): Adopted in 2003 to fight international crimes like trafficking.
Includes protocols for:
Trafficking in persons (especially women and children)
Smuggling of migrants
Illicit trafficking of firearms
UNODC's role: Oversees global anti-trafficking efforts by providing resources, strengthening partnerships, and promoting awareness.
Example: Blue Heart Campaign against Human Trafficking.
National laws and anti-trafficking strategies: Drafting laws to criminalize trafficking and implement effective strategies.
Many countries have ratified the protocols but translating action into success remains a challenge.
Demographic Dividend
Demographic dividend: Economic growth potential from a favorable age structure with a large working-age population (15–64 years) and fewer dependents.
Benefits
Larger workforce: More working-age people means higher productivity, but requires job creation.
Economic growth: More tax revenue due to a larger working population, leading to better public infrastructure and foreign investment.
Improved health & nutrition: Lower fertility rates lead to better health outcomes, boosting productivity.
Example: Brazil’s population pyramid shift indicates potential for demographic dividend with more people in working age (25-49 years) by 2030.
Challenges
Job shortage: If job creation does not match workforce size, unemployment may cause social unrest.
Future demographic tax: As the population ages, the working-age group shrinks (Japan, Europe, North America).
Thailand demographic dividend CASE STUDY
Voluntary National Family Planning Program introduced:
Free contraception (condoms given out in public places).
Extensive campaigns and festivals raised awareness.
Free vasectomies on the King’s birthday to appeal to national loyalty.
Resulted in a drop in fertility rates between 1967 and 2014.
Example: From 1960–2014, contraceptive use increased significantly in women aged 15–49 years, contributing to the decline in fertility rates.
The Population and Community Development Association (PDA), played a major role in normalizing and promoting contraception with humor and accessibility.
Thailand’s Total Fertility Rate dropped from around 6.1 children per woman in 1960 to around 1.5 by 2014, showing a dramatic demographic shift.
Declining fertility was paired with rising life expectancy and literacy, especially for women, allowing more participation in the workforce and boosting economic growth.
The falling dependency ratio (fewer children per working adult) meant more resources per child, a better-educated population, and a larger, more productive workforce, leading to rapid economic growth from the 1980s to early 2000s.
Lower fertility allowed more focus on economic diversification, shifting from agriculture to industry and services, which further fueled the demographic dividend.
Possible future challenges
Thailand’s ageing population and falling fertility rates present the risk of increased dependency in the future.
Possible social issues: Rising unemployment, challenges for healthcare, and burden on younger workers.
What are global migration patterns and how are they measured?
Tracked using flow maps and migration corridors (e.g. Mexico → USA, Syria → Germany).
Largest movements: South-South (37%), South-North (35%), North-North (23%).
Main drivers: conflict, inequality, job opportunities, education, climate.
Measured by: UN migration stats, census, remittance flows.
What are common theories of migration?
Lee’s Push-Pull Model: Migration due to push factors (e.g. war), pull factors (jobs), and intervening obstacles (borders, cost).
Ravenstein’s Laws of Migration: Most migrants move short distances, young adults are more likely to migrate, rural → urban most common.
Gravity Model: Migration influenced by population size and distance between places.
How effective are pro- and anti-natalist population policies?
Pro-natalist (e.g. Sweden, Japan): Increases fertility if policies address cost of living, gender equality, and childcare.
Anti-natalist (e.g. China’s One Child Policy): Rapidly reduces birth rates but may cause ageing populations and skewed sex ratios.
Evaluation: Long-term success depends on economic support + cultural acceptance.
What geopolitical factors act as barriers to migration?
Strict immigration policies (e.g. USA border control, EU asylum caps).
Visa systems and legal documentation restrictions.
Physical barriers (e.g. border walls, seas, deserts).
Political hostility or xenophobia toward migrants/refugees.
What are the impacts of rural-to-urban migration in LICs?
Overcrowded cities: Growth of slums/shanty towns (e.g. Kibera in Nairobi).
Strain on services: Education, healthcare, water.
Employment opportunities may be informal, low-wage.
Cultural tension between rural migrants and city residents.
BUT can drive urban development if well-managed.