12. The Normal Distribution Part I
1/16
There's no tags or description
Looks like no tags are added yet.
Name | Mastery | Learn | Test | Matching | Spaced |
|---|
No study sessions yet.
17 Terms
A _________ random variable has infinitely many values, and those values are often associated with measurements on a continuous scale with no gaps or interruptions
continuous
A _______ ______ is a graph of a continuous probability distribution
density curve
Continuous random variables are represented by ________ _______ _______ (pdf)
probability density functions
Probability density functions are used to compute ___________
→ Areas under the density curve (pdf) correspond to _____________
probabilities
The total area under a density curve must equal __
1
For continuous random variables, the probability that the random variable 𝑋 is equal to a single value, 𝑥 is always __
P(X = x) = __
0
Normal distributions are extremely important:
1) Moving forward, the statistical tests we will learn assume a normal distribution.
2) With a normal distribution, the mean and variance are ___ dependent on each other.
3) Many natural phenomena are approximately normally distributed (height, weight, blood pressure, etc)
not
A continuous random variable has a normal distribution if:
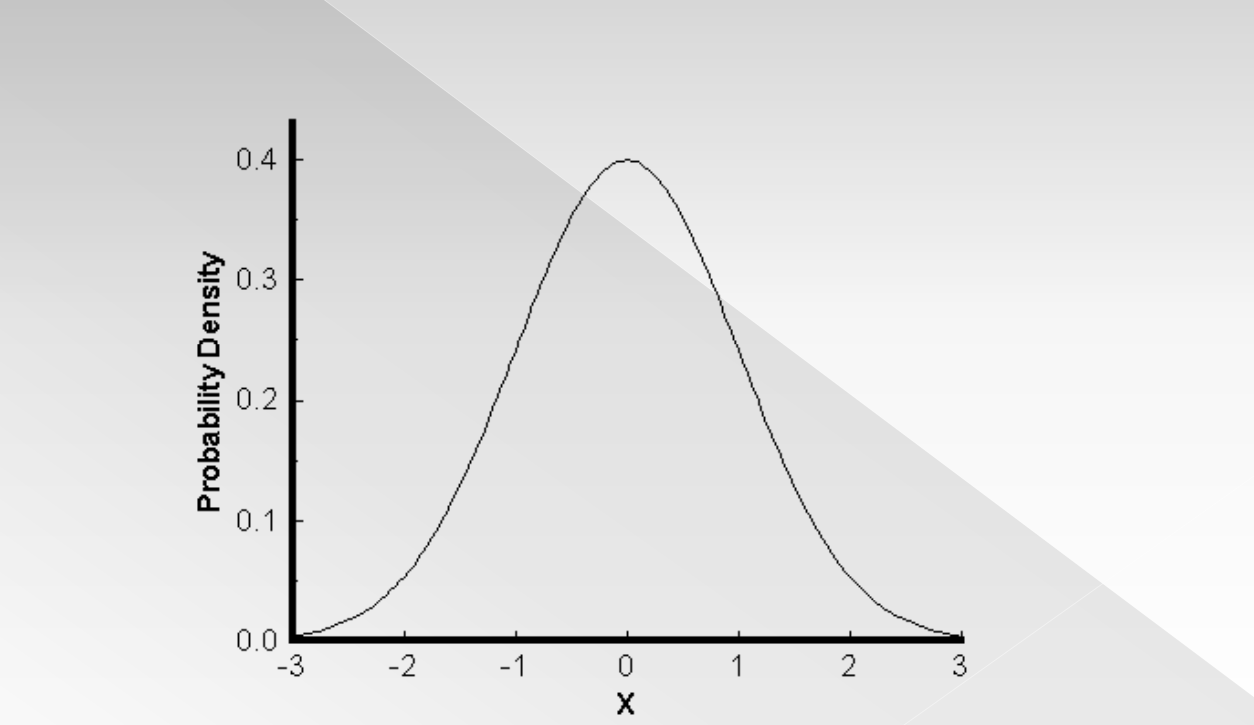
→ It has a distribution with a graph that is __________ and bell-shaped, and
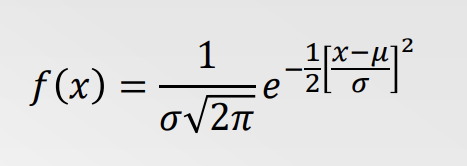
→ Can be described by the following probability density function (pdf) (we won’t use it)
symmetric
The Standard Normal Distribution has a mean of 0 and a standard deviation of __
1
Shorthand to describe normal RVs:
𝑿~𝑵 (𝝁, 𝝈)
where 𝜇 is the _____ and 𝜎 is the ________ _________ of the random variable 𝑋.
› 𝑿~𝑵 𝟎, 𝟏 signifies that 𝑋 is a normally distributed random variable with mean 𝜇 = 0, and standard deviation 𝜎 = 1.
› 𝒀~𝑵 𝟓, 𝟐 indicates that 𝑌 is a normally distributed random variable with mean 𝜇 = 5, and standard deviation 𝜎 = 2.
mean
standard deviation
The 68-95-99.7 rule is a helpful guide when working with normal random variables. This rule states that:
› About 68% (actually 68.26%) of all values fall within __ standard deviation of the mean.
› About 95% (actually 95.44%) of all values fall within __ standard deviations of the mean.
› About 99.7% (actually 99.74%) of all values fall within __ standard deviations of the mean.
1
2
3
All normal distributions are the same if we measure in units of size 𝜎 about the mean 𝜇 as center.
› Changing to these units is called ___________.
› To ___________ a value, subtract the mean of the distribution and then divide by the standard deviation
standardizing
standardize
If 𝑥 is an observation from a normal distribution that has mean 𝜇 and standard deviation 𝜎, the standardized value of 𝑥 is
𝑧 = ( 𝑥 − 𝜇 )/ 𝜎
› A standardized value is often called a _-score. › A _-score tells us how many standard deviations the original observation falls away from the mean, and in which direction
z
If a variable 𝑿 has any ________ distribution 𝑵 (𝝁, 𝝈) , then its standardized values have the standard normal distribution.
𝒁~𝑵 (𝟎, 1)
normal
Areas under a normal curve represent ___________ of observations from that normal distribution.
› They also represent probabilities of randomly selecting an individual from that normal distribution.
› There is not a direct formula for areas under a normal curve.
Must use either a software or a table
proportions
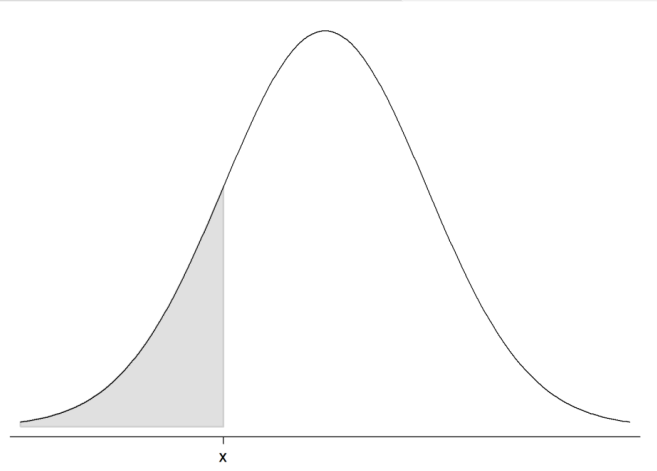
Most software and tables give ________ probabilities.
› The __________ probability for a value 𝑥 in a distribution is the proportion of observations in the distribution that lie at or below 𝑥.
cumulative