Sampling methods
1/41
Earn XP
Description and Tags
Chapter 8 Market insights
Name | Mastery | Learn | Test | Matching | Spaced |
|---|
No study sessions yet.
42 Terms
Sampling
The selection of a sample of respondents that is representative of a population of interest
Step 1: Population of interest
The total group of people that the researcher wishes to examine, study or obtain information from (sometimes known as target population or universe) Excluding employees of competitors
Step 2: Cenus or
Research that involves collecting data from each member of the population of interest e.g. government population cenus about every adult in the country characteristiscs (large). Rare in marekting research as cost, time and effort. Usually for small and specialised industrial products/services market
Step 2: or Sample
A subset of the population of interest
Step 3: Select a Sampling frame
A list of the population of interest from which the researcher selects the individuals for inclusion in the research. E.g. list of names, addresses for phone surveys
Sampling frame error
A bias that occurs as a result of the population implied by the sampling grame being different from population of interest. Avoid by creating a wide range of lists added together to make them more avaliable to people.
Access panels
A database of individuals who have agreed to be avaliable for surveys of varying types and topics. Saves time and money knowing they are willing to participate, avoid challenges in random recruitment, inaccuricies and unpredictable databases. Check same people arent selected all the time as impacts response rate and quality of data.
Step 4: Choose a sampling method
Sampling methods can be grouped under 2 headings, probability and non-probability
Propability sampling
A set of sampling methods where an objective procedure of selection is used, resulting in every member of the population on interest having a known probability of being selected. E.g. simple random sampling, systematic sampling, cluster sampling
Advantages of probability sampling
survey results are projectavke to the total population (plus or minus smapling error) - data is definitive rather than indicative
sampling error can be computed
researcher can be sure of obtaining info from a relatively representative group of population interest
Negative of probability sampling
rules for respondent selection and sample design significantly increase researcher/interviewer costs, time and effort. As its difficult to manage, many opt for non-probability.
Non-probability sampling
A set of sampling methods where a subjective procesure of selection is used, resulting in the probability of slection for each member of the population of interest being unknown Many marketing research studies are this as its quicker and easier. E.g. convivnience sampling, judgement sampling, snowball sampling
Advantages of non-probability
less costs
quicker due to less stringent procedures required in selection
smaller sample size
researcher can traget most important respondents
Disadvanatges of non-probability
indicative rather than definitive results
sampling error cant be computed
researcher dont know degree to which the sample is representative of the population from which its drawn
researcher needs to make certain assumptions about the grouping within the population of interest
Simple random sampling (ps)
every possible member of the population has an equal chance of being selected for the survey. Respondents chosen using random numbers
Profitability of selection = Population size/ sample size required
Limited to:
where a company is selecting people from a population that is defined as its own database of custoemers, computer programs can then select random sample from database.
random digit dialling used for telephone interviews, are code remains constant but computer generate remaining digits in phone numbers
Systematic sampling (PS)
an approach similar to simple random sampling but uses a skip interval (each xth person) rather than random numbers to select the respondents. Easier to implement.
Skip interval = population size/ sample size
Make sure no obvious anomalies e.g. aeroplane seat number use
Stratified random sampling (PS)
The chosen sample is forced to contain potential respondents from each of the key segments of the population. Divide the population of interest into 2 or more mutually exclusive and exhaustive subsets, then take random samples within them. Has statistical efficiency, smaller sample error.
Proporationate stratified random sampling (PS)
the units or potential respondents from each population subset are selected in proportion to the total number of each subsets units in the population. More statistical efficincy than random but has issue of subset makes up only small % of population, harder for specific analysis on subset alone or comparisons.
Disproportionate stratified random sampling (PS)
Units or potential respondents from each respondents from each population set are selected according to the relative variability
number of units/potential respondents taken from each subset determined in same manner as proportionate sample
numbers adjusted to take relatively more units from those subsets that have larger standard deviations (more variation) relatively fewer units from subsets with smaller standard deviations. allocates more units to subsets where potential sampling error is greatest.
May not know in advance the diversity within each subset. Proportionte used more than dis. if variability and concern of small subsets, then they might draw sample of equal than porportionate.
Cluster sampling (PS)
clusters of population units are selected at random and then all (one-stage cluster sampling) or some (two-stage cluster sampling) of units in the chosen clusters are studied
Dont need produce complete samling gram for total population but for the clusters selected, makes the process shorter and less complicated. Have similar levels of variability within each cluster. Hard to form clusters that reflect total population in miniature. Limited to situations where population can be easily divided into representative clusters e.g. names in a membership
Cluster sampling approaches:
one-stage cluster sampling (simple): once clusters selected by random selection, data collected from all of units/people in selected clusters.
Two-stage cluster sampling: clusters selected randomly, random sample taken of population units in each selected clusters. used when clusters are relatively large.
Area sampling: clusters created basis of geographic loaction of population of interest. Widely used version. Area selected then sample of potetnial respondents approached there. No sampling frame needed. Reduce sampling error by using large number of small clusters.
Multistage sampling (PS)
a sampling approach where a number of successive sampling stages are undertaken before the final sample is obtained.
Combines stratified, cluster and systematic sampling but not using a full list but a list per selected
Convinience sampling (NPS)
a researchers convenience forms the basis for selecting the potential respondents (use most accessible members of population) e.g. stop people in middle of street. Useful for exploratory research. Care and time should be taken through appropriateness of the sample to the study e.g asking people using about public transport not good when interested in views as a whole population
Judgement sampling (NPS)
a researcher consciously selects a sample that they consider to be most appropriate for the research study
Researcher considers appropriateness of the sample but wont exert much effort to make it representative of the population of interest. Involves deliberate choice of sample members. Good for relatively small sample sizes (when carefully chosen to better represent the mix of potential respondents)
Quota sampling (NPS)
cells or subsets within the population of interest are selected, a numerical quota in each cell is established and the researcher carries out sufficient interviews in each cell to satisfy the quota
potential respondents arent selected on random basis, selected on subjective basis with only requiement being that designated number are interviewed in each cell
Factors used for selecting quotas selected on basis of researcher judgement only. allow them to define the cells using a number of characteristics.
if control characteristics to design the cells are relevant to research questions, quota is superior to judgement and convenience sampling in terms of representativeness. Care must be taken to ensure definitions of cells arent complicated that time and effort to fill it is beyond value of info gained.
Snowball sampling (NPS)
Additional respondents are identified and selected on the basis of referrals of initial repondents. Used when populaiton of interest is small or difficult to identify e.g. people with unusual hobbies.
Additional respondents are identified/selected on the basis of referrals of initial respondents. more cost-effective to identify small number of low-incidence group and ask identify potential respondents similar to them. Final sample can be biased as referals could hold similar ideas and views.
Sampling for online surveys
Convinience samples. Accepted that respondents on the internet dont accurately reflect the general population, some dont have access. No reliable sampling frame for email addresses, some use snowballing but means they wouldnt be representative unless of a particular brand. Random approach could improve this but response surveys from ‘pop-ups’ are low. Use a panel of individuals who agreed to be involved recruited from online sources. Only representative of people who responded to the request, different from true population, minimise by obtaining detailed profiles through initial questionaire creating quota samples, respond to survey only once through a password
Step 5: Determine Sample Size
Determining relates to financial, managerial and statistical issues. Bigger sample reduces sampling error but has to be balanced with increased cost/time involved.
Budget avaliable
Amount of money avaliable and willing to be spent, has biggest impact on sample size
Sample sizes used in similar studies
homogeneity of population of interest: likely significant differences in views or behaviours of the population, larger sample required.
Likely response rate: if refusal rates in particular population of interest are likely to be higher than the norm, then sample of potential respondents will need to be larger
Incidence rate of characteristic being investigated: characteristic being investigated is common in sampling frame, sample smaller than in the case if characteristic is rare.
number of subgroups of data that are to be analysed: larger number of subgroups of sample researcher wants to analyse separetely, larger required total sample size. individual subgroups will have larger sampling errors than total sample. Hard to determine if real differences between results from 2 subgroups or whether difference is simply reflection of sampling error.
Statistical methods
for probability samples, help determine sample size.
Info needed:
estimate of standard deviation for the population
acceptable level of precision expressed as sampling error
desired confidence leel that result of survey will fall within certain range of true result of population
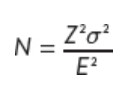
Studies involving averages (means)
Z is level of confidence expressed in standard errors, o is population standard deviation, E is acceptable level of precision expressed as sampling error
Variables to consider:
specify level of precision
determine acceptable confidence interval
both influenced by budget and time contraints
estimate standard deviation for the population: impossible to know before a survey, so researcher relies on estimates when calculating sample size. estimates based on: results from previous study, secondary data, conduct small pilot survey, judgement.
Confidence levels
probability that true population value will be within a particular range (+ or - sampling error)
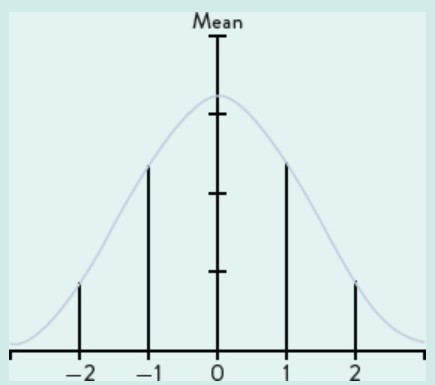
Normal distribution
a continuous distribution that is bell-shaped and symmetrical about the mean
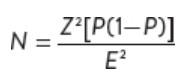
Studies involving proportion
estimates of likely proportions rather than standard deviations.
Z is level of confidence expressed in standard errors, E is acceptable amount of sampling error and P is proportion of the population having certain behaviour or characteristic.
Once survey is conducted and actual proportions or sample means/standard deviations calculated, researcher can assess accuracy of estimates used to calculate sample size. Adjustments can be made to levels of sampling error based on sample size and actual sample.
Adjustment of sample size for larger samples
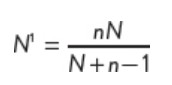
no direct relationship between size of population and size of sample required to estimate characteristic with specific level of error and confidence. sample size may have effect where size of sample large in relation to size of population. normal assumption is sample elements drawn independetly onto one another. adjustments made called finite population correction factor:
calculation to reduce required sample:
N1 is revised sample size, n is orginal sample size, N is population size.
Step 6: Implement the sampling procedure
start selecting members of the sample and begin survey. purpose of survey is based on sample to make inferences about population of interest rather than reporting on characteristics of the sample. Important to know why characteristics of a sample may differ from those of population.
Sampling error
difference between the sample value and the true value of a phenomenon for the population being surveyed. Reflects the extent of random chance in selecting respondents with different views and behaviours. Says nothing about accuracy of data collected from probability samples, reflects accuracy of estimates about toal population that can be made from the data. Higher sampling error = wider confidence interval estimate for population parameter will be. Reduce by using statistical efficiency samplings or increase sample size
Non-sampling error
errors that occur in study that dont relate to sampling error. Tend to be classified into 3 broad types: sampling frame error, non-reponse error and data error.
3 types: sampling frame error, non-response error and data error
Non-response errors
errors in a study that arise when some of the potential respondents dont respond
reasons for this:
refusals: either cause of timing or resistance to survey. Make surveys short and interesting/attractive, offer incentives, send reminder, reply-paid envelopes.
non-avaliability of respondents: being on holiday or away from home. callbacks reduce no response but add to cost
Data error
non-sampling errors that occur during data collection or analysis that impact on the accuract of interferences made about the population of interest. types of data error:
respondent errors: respondents inadvertedly or intentionally give distorted or erroneous responses(fail to understand question). Place sensitive questions near the end after rapport is built to reduce distortion
interviewer errors: result of interviewers recording answers incorrectly, especially if open-ended questions, summarise answers rather than write true to it. Reduce by doing training and supervision, check validity of interview process, check consistency of answers.
data analysis errors: occur when data is transferred from questionaires to computers by incorrect keying of info. Identifies and reduced by checking sample of questionaires against computerised data. Also check unexpected codes in data and test for considtency of data on each respondent.
Weighting
the process of adjusting the value of survey responses to account over or under representation of different categories of respondent. As long as demographic info about population is known or be reliably estimated, then weighting can help improve estimates considerably, provided disparities found between sample and population dont arise from lack of coverage of significant parts of the population. When weighting is used, researchers must always provide full description of the weighting procedures.