first year recap
 Call Kai
 Learn
Learn Practice Test
 Spaced Repetition
 Match
Match Flashcards
 Knowt Play
1/15

There's no tags or description
Looks like no tags are added yet.
Name | Mastery | Learn | Test | Matching | Spaced | Call with Kai | Chat |
|---|
No analytics yet
Send a link to your students to track their progress
16 Terms
frequency distribution
values on the x-axis
frequencies on the y-axis
normal distribution
describes a symmetrical plot of data around its mean value
the width of the curve is defined by the standard deviation
skew
measure of symmetry of distribution
0 = perfect symmetry
scores clustered at the lower end of distribution = positive skew
scores clustered at the higher end of distribution = negative skew
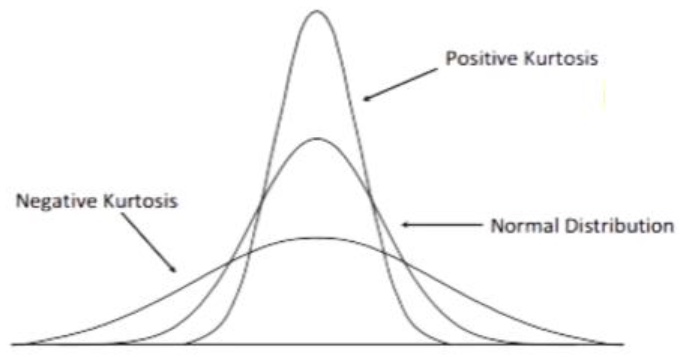
kurtosis
measures the degree to which scores cluster at the tails of a frequency distribution
positive kurtosis = too many scores in the tails, resulting in a peaked curve
negative kurtosis = too few scores in the tails, resulting in a flattened curve
central tendency
centre of a frequency distribution of observations, measured by mean, median and mode
measures of spread
describe how similar or varied the set of observed values are for a particular variable
range, quartiles and the interquartile range, variance and standard deviation
parametric tests
a family of statistical tests that require data to meet certain assumptions, in particular around the distribution of the data and the inter-relation between variable levels
the basic assumptions: data are normally distributed, homogeneity of variance, interval or ratio data, the independence of scores
for a correlational design there is also the assumption that the relationship between the variables will be linear
homogeneity of variance
an assumption for parametric testing in between-groups designs, where the variance of one variable is stable (roughly equal) at all levels of another variable
independent samples / between subjects t-test
a test using the t-statistic that establishes whether two means collected from independent samples differ significantly
repeated measures / within subjects t-test
a test using the t-statistic that establishes whether two means collected from the same sample differ significantly
non-parametric tests
a family of statistical tests that don’t rely on the restrictive assumptions of parametric tests
in particular they don’t assume sampling distribution is normal
these tests are used when the data fails to meet the assumptions for a parametric test
correlation coefficient
a measure of the strength and direction of the association between two variables
there are two common variants - Pearson’s for parametric data, and Spearman’s for non-parametric data
coefficients range between -1 and 1
the closer the coefficient is to +/- 1, the stronger the relationship between the two variables
coefficients close to 0 indicate that there’s little to no relationship between the variables being examined
Mann-Whitney test
a non-parametric test which examines differences between two independent samples
the non-parametric equivalent of an independent t-test
Wilcoxon’s signed-rank test
a non-parametric test which examines differences between two independent samples
the non-parametric equivalent of the related t-test
test statistic
how frequently different values occur in random samples
the observed value of such a statistic is usually used to test a hypothesis
for a t-test, the test statistic is “t” and the value of t needs to be reported alongside the p-value in the presentation of results
p values
p represents the likelihood of the data be due to chance
in psychology, a critical p-value of 0.050 is used to test whether there’s a significant difference between two groups or conditions, or a significant relationship between two variables