Statistics Chapter 1
1/66
Earn XP
Description and Tags
Name | Mastery | Learn | Test | Matching | Spaced | Call with Kai |
|---|
No analytics yet
Send a link to your students to track their progress
67 Terms
Statistics
(1.1)
the science of collecting, organizing, analyzing, and summerizing , information to draw conclusions or answer questions
Data
(1.1)
fact or proposition used to draw a conclusion
describes characteristics
Population
(1.1)
an entire group
Individual
(1.1)
person or object that is a member
Sample
(1.1)
part of the population that is being studied
Statistic
(1.1)
numerical summary based on a sample
Descriptive Statistic
(1.1)
organizes/summerizes data
Inferential Statistic
(1.1)
takes results from samples and extends them to the whole population; measures reliability
Parameter
(1.1)
Numerical summary of a population
What are the steps in the process of statistics
(1.1)
1) Identify the research objective
2)collect the data needed to answer the question posed
3) describe the data
4)create an inference
Variables
(1.1)
characteristics of the individuals within the population
Qualitative/Categorical Variables
(1.1)
classification based on attributes/characteristics
Quantitative Variables
(1.1)
Numerical measures of individuals
can be added or subtracted and provide meaningful results
Discrete Variable
(1.1)
quantitative
finite number of possible values
countable number of possible values
Continuous Variable
(1.1)
quantitative
Infinite number of possible values
i.e decimals or fractions
Data
(1.1)
list of observations a variable assumes
Qualitative Data
(1.1)
observing qualities
Quantitative data
(1.1)
observations based on a numerical variable
+Nominal
(1.1)
can not be ranked in any specific order
+Ordinal
(1.1)
Can be ranked in a specific order
Interval Level of Measurement
(1.1)
zero doesnt really mean zero
addition and subtraction can be formed
Ratio Level of Measurement
(1.1)
Zero means absolute zero
multiplication and division can occur
Response Variable
(1.2)
what is the result?
Explanatory Variables
(1.2)
what you manipulate or observe changes in
Observational Study
(1.2)
measures the value of the response variable without influence
Designed experiment
(1.2)
intentionally changing the value of the explanatory variable
records the value of the response variable for each group
Confounding Variable
(1.2)
a third variable that influences both the independent and dependent variable
is considered in a study.
The effect cannot be distinguished from a second explanatory variable.
Lurking Variables
(1.2)
explanatory variable
not considered in a study
affects the value of the response variable
Census
(1.2)
list of all people in a population and certain characteristics of each individual
Web Scrapping/ Data Mining
(1.2)
process of extracting data from the internet
Random Sampling
(1.3)
Process of using pure chance to select individuals from a population to be included in a sample
‘n’
(1.3)
sample coming from a population
‘N’
(1.3)
sample obtained through simple random sampling
Simple Random Sampling
(1.3)
Each member of the population has an equal chance of being selected
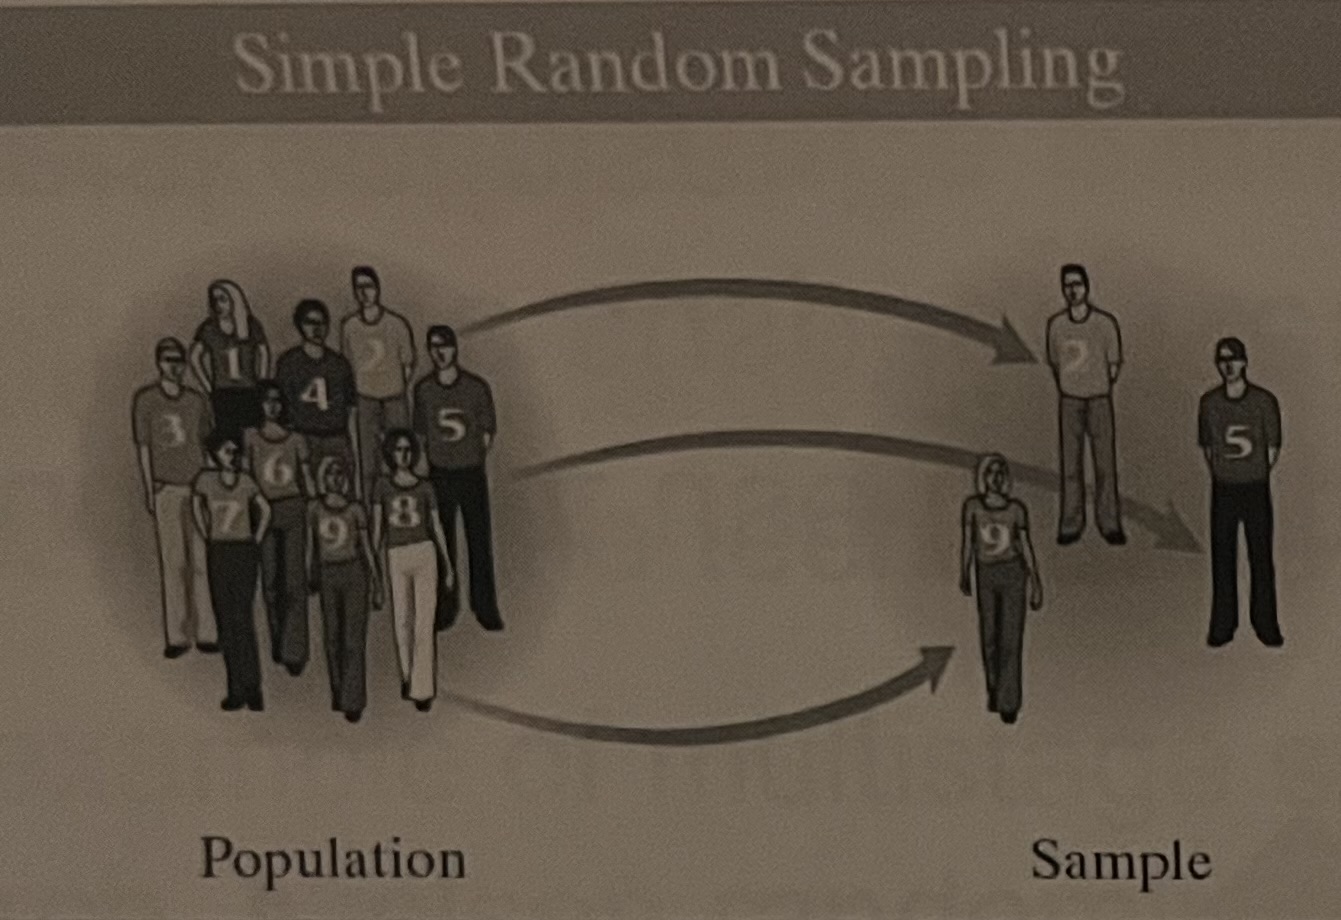
What are the steps to obtain a simple random sample?
(1.3)
list all the individuals in the population
number the individuals
use a software to generate numbers
Stratified Sample
(1.4)
obtained by seperating the population into strata
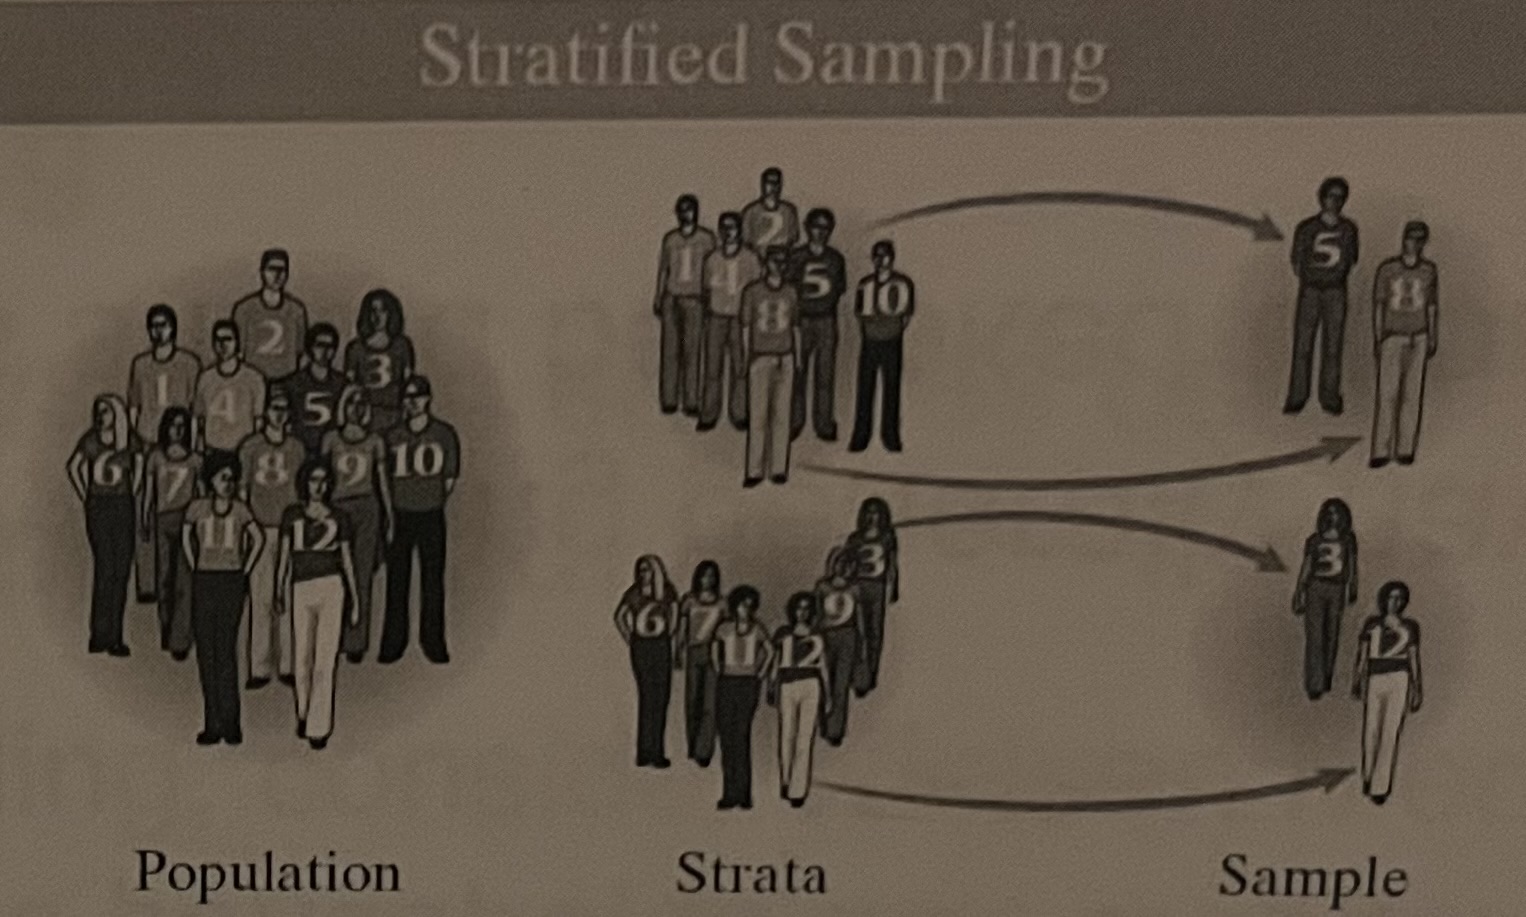
Strata
(1.4)
non-overlapping groups
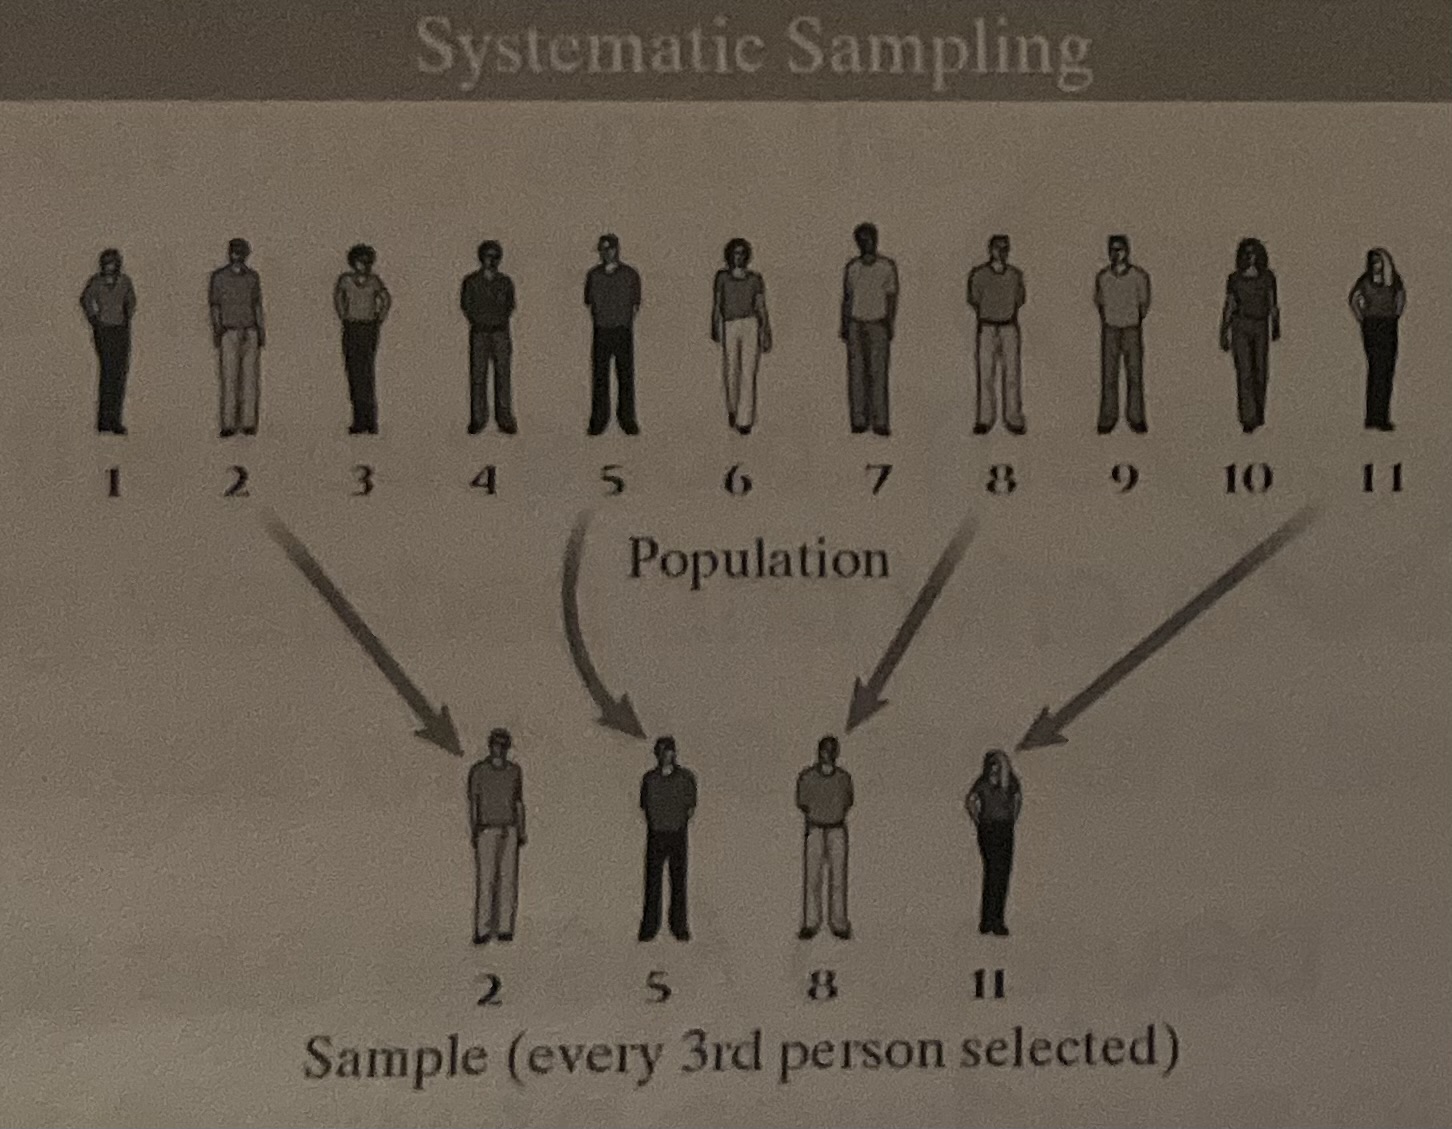
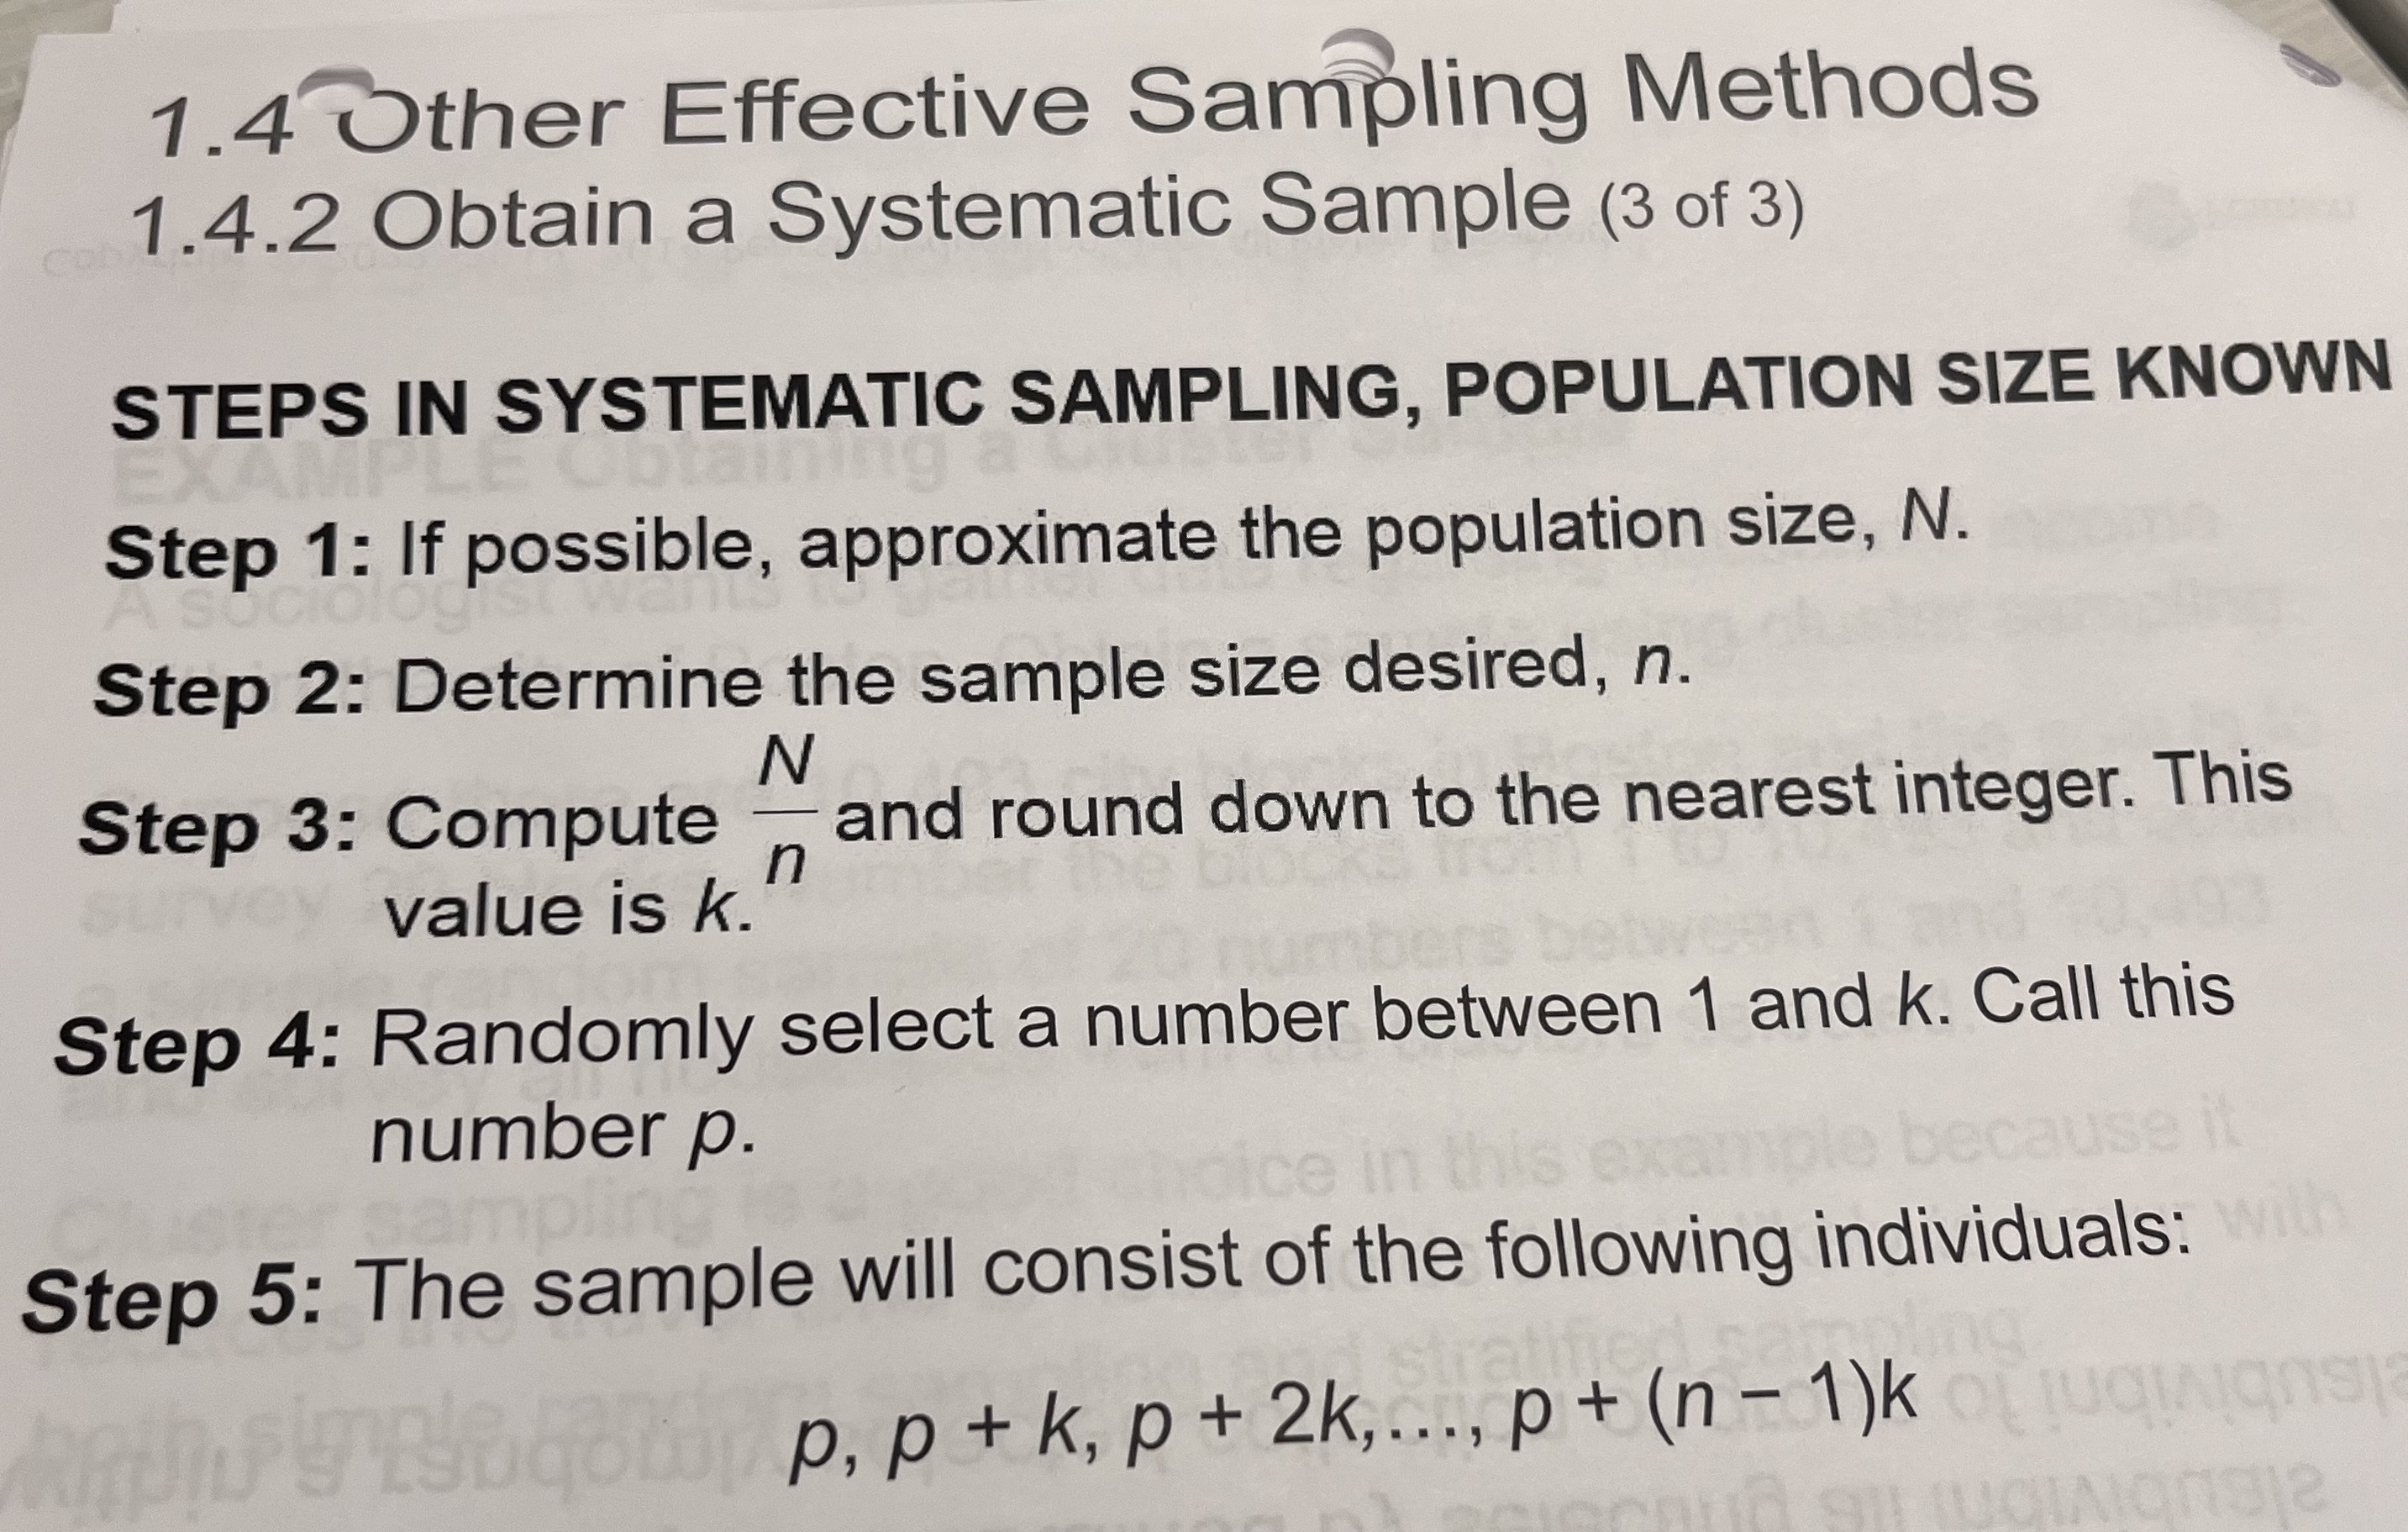
Systematic Sample
(1.4)
researchers select members of the population at a regular interval
for example, by selecting every 15th
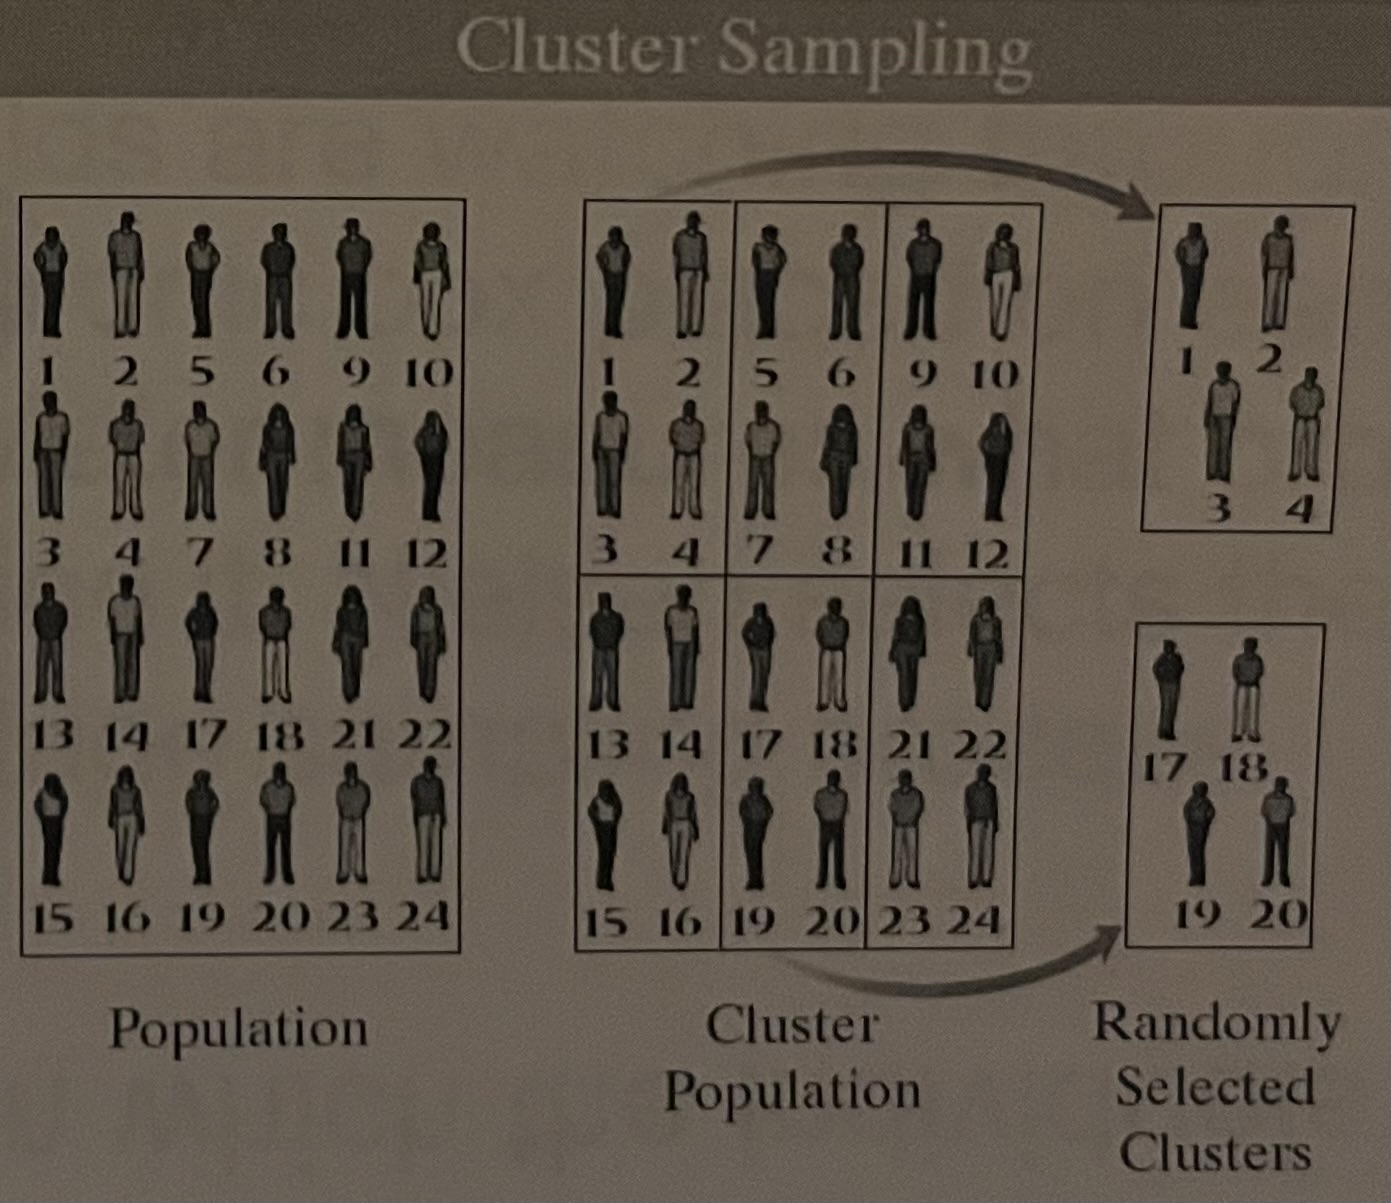
Cluster Sample
(1.4)
selecting all individuals within a random collection or group
Convenience Sample
(1.4)
the sample group is easily assembled
generally have unreliable results
Sampling Bias
(1.5)
The subject selection process favors part of a population over another
results from undercoverage
Undercoverage
(1.5)
one part of the population is more represented than the other
results in sampling bias
Nonresponse Bias
(1.5)
Selected study participants who have a minority opinion do not respond to the survey
can potentially be improved through callbacks, rewards, or incentives
Response Bias
(1.5)
Survey data does not reflect the subject’s true feelings
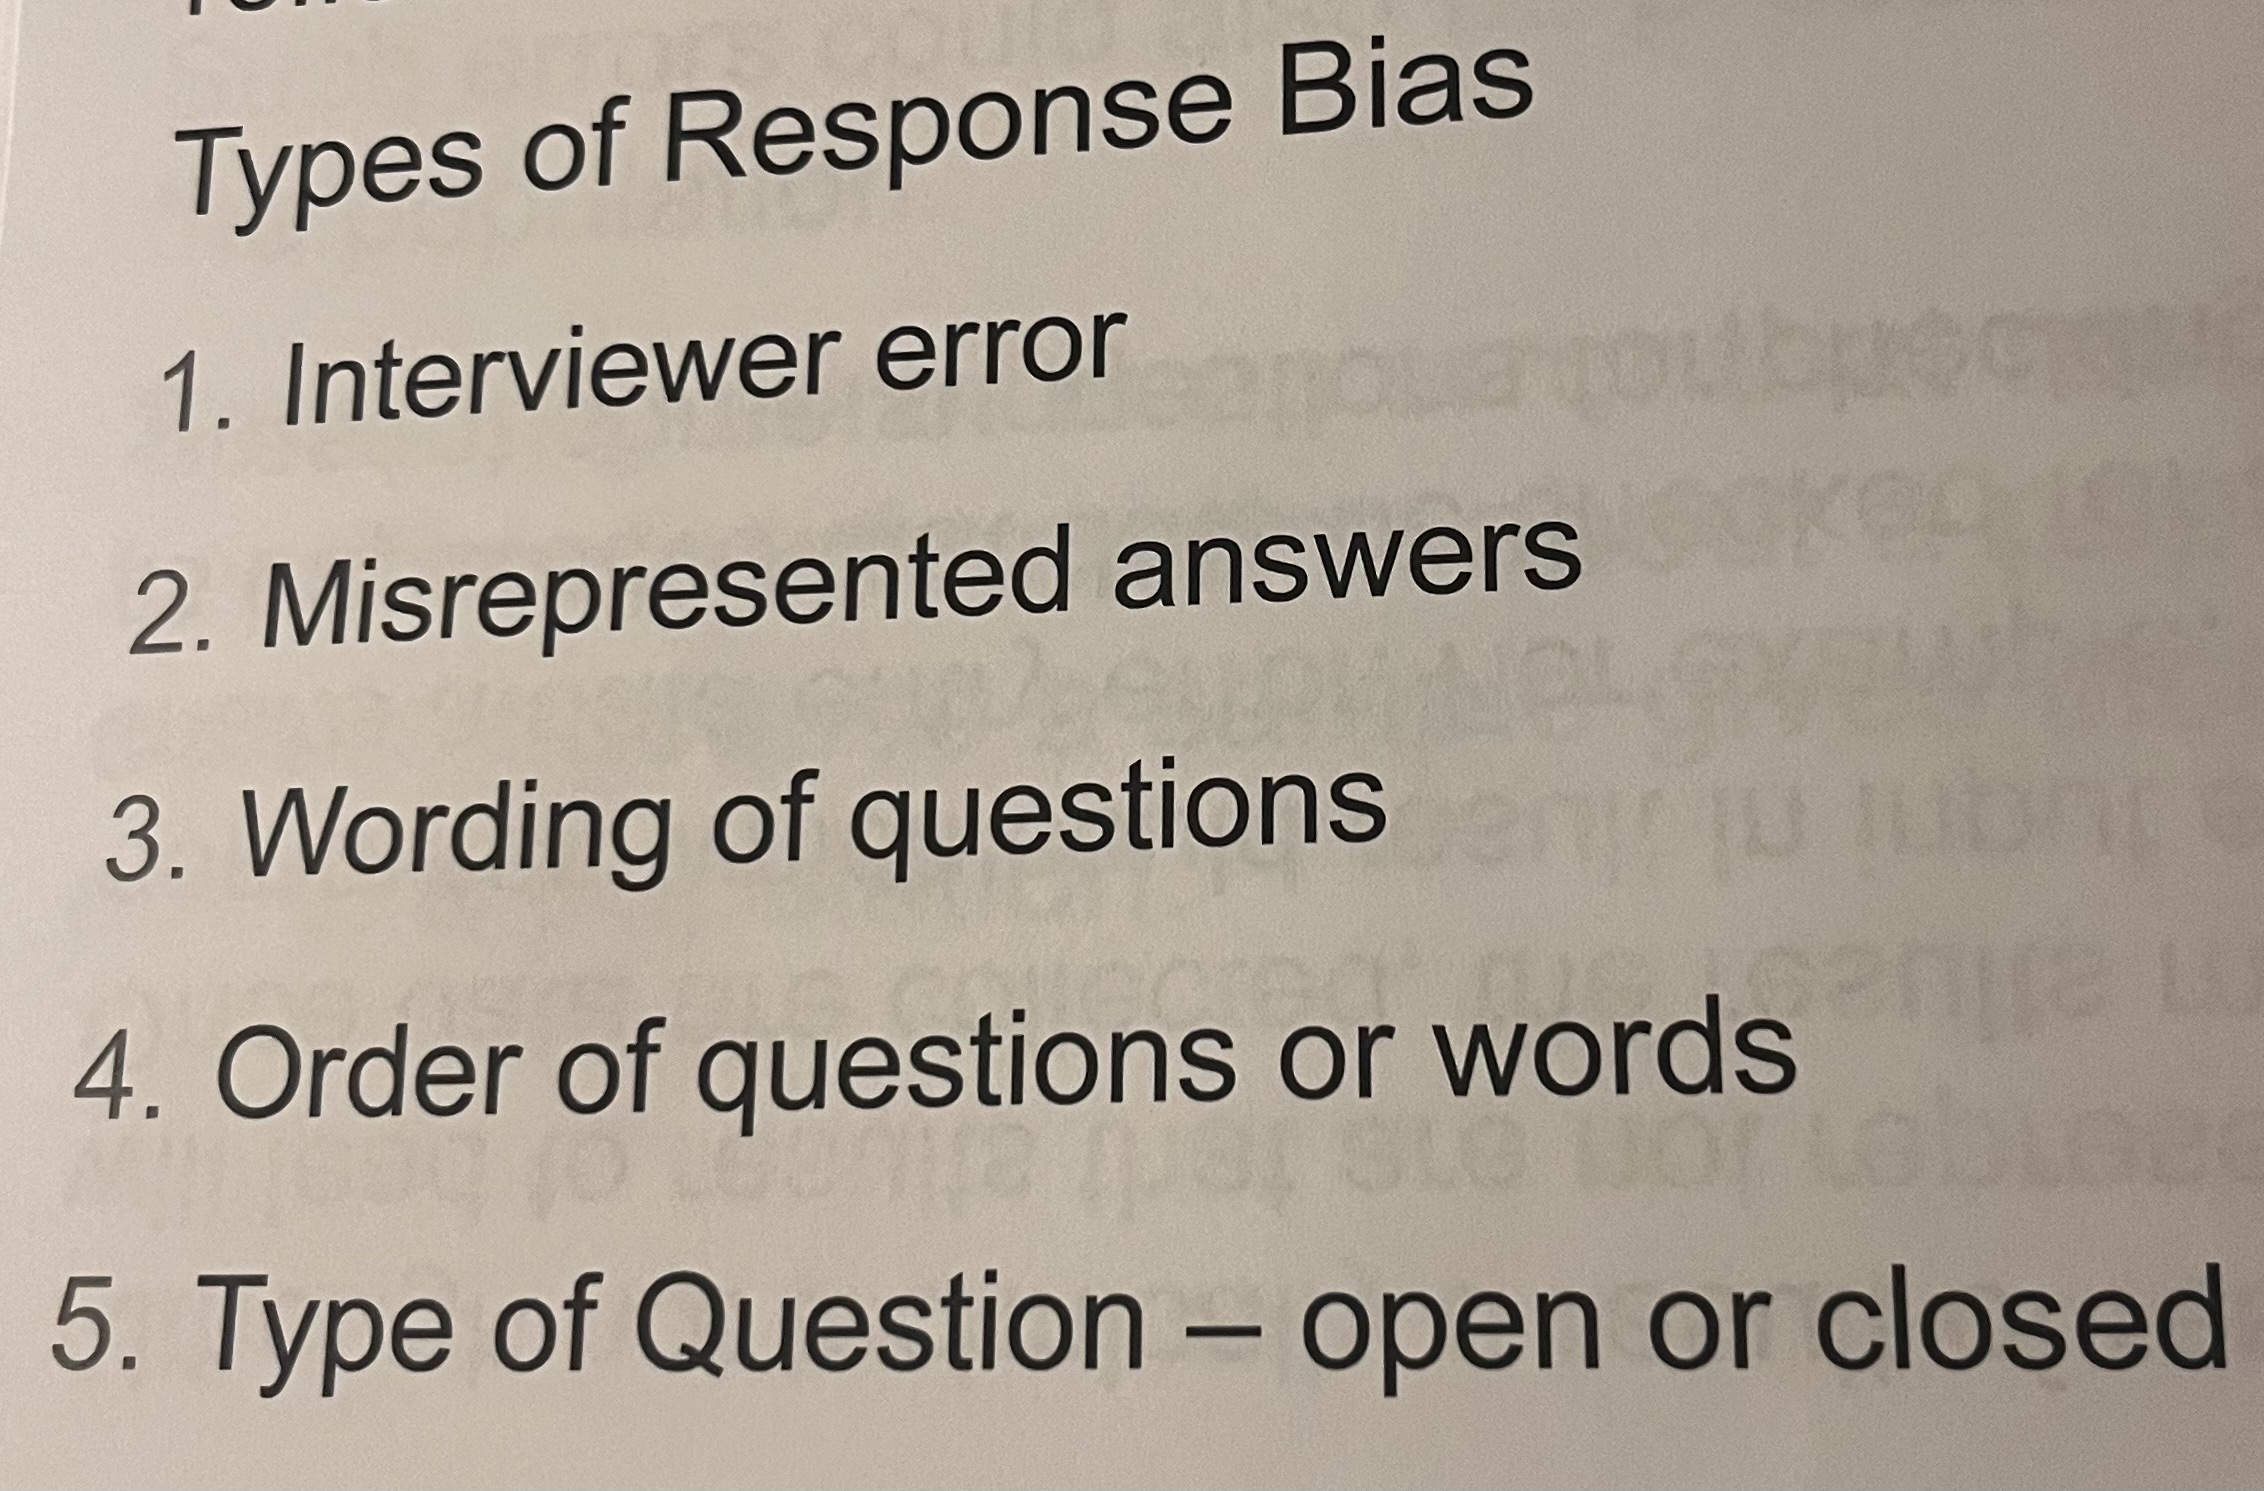
Data-Entry Error
(1.5)
subject could report incorrect data
data could be entered into a computer incorrectly
leads to results that are not representative of of the population
Nonsampling Error
(1.5)
errors as a result of:
sampling bias
nonresponse bias
response bias
data entry error
the population census itself
Sampling Error
(1.5)
errors as a result of:
using a sample to estimate population info
raw data
Data that is not organized
Ways to Organize Data
• Tables
• Graphs
• Numerical Summaries- mean, median, mode
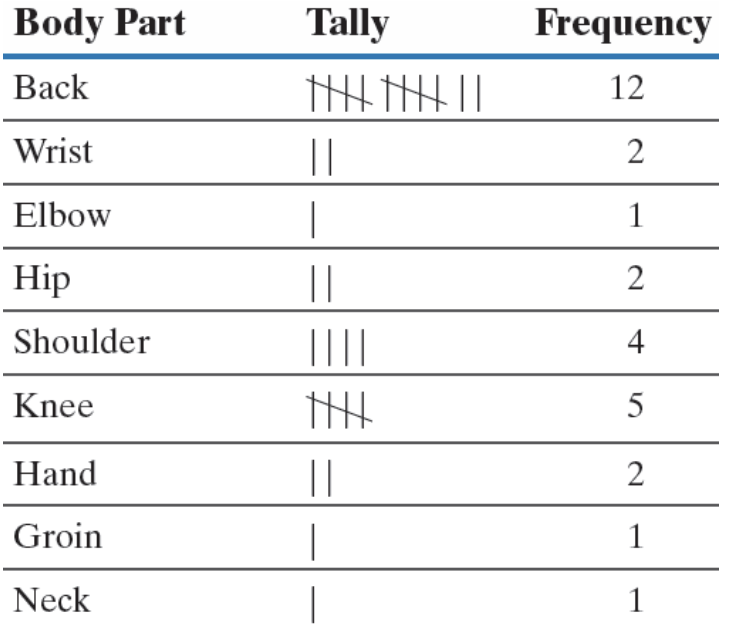
+++Frequency Distribution
lists each category of data and the
number of occurrences for each
Frequency Table
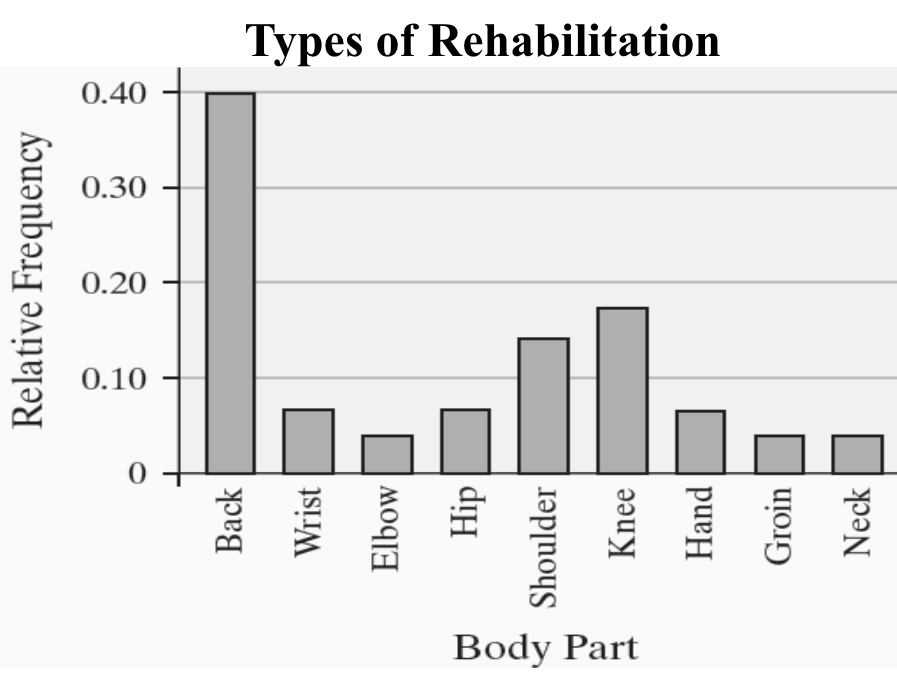
relative frequency
percent of
observations within a category
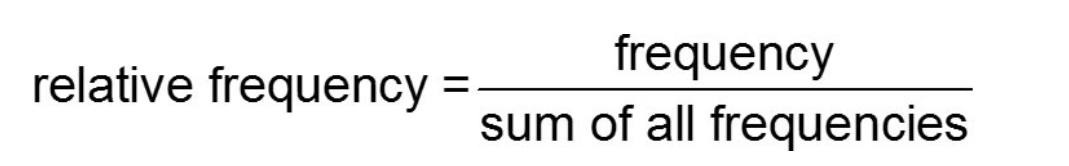
relative frequency distribution
lists each category of data with the
relative frequency
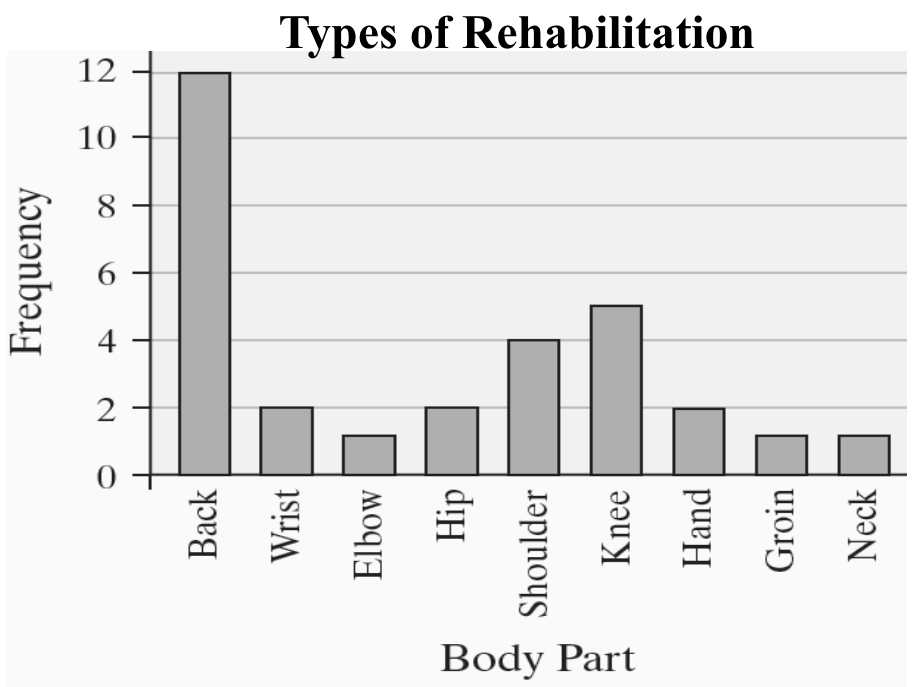
bar graph
-constructed by labeling each category of data
on either the horizontal or vertical axis
-frequency or
relative frequency of the category on the other axis
-Rectangles of equal width are drawn for each category
-height of each rectangle represents the category’s frequency/relative frequency.
Frequency Chart
Relative Frequency Chart
Pareto chart
-bar graph
-bars are drawn in
decreasing order of frequency or relative frequency