BIOL 300 Midterm 1
1/150
Earn XP
Description and Tags
up to and including lecture 10
Name | Mastery | Learn | Test | Matching | Spaced | Call with Kai |
|---|
No study sessions yet.
151 Terms
What is a Population?
The entire collection of individuals or units that a researcher is interested in studying
Example: All registered voters in a province
What is a Sample?
A subset of individuals or units that is selected from a population
Example: The 700 voters who were randomly chosen from a list of all registered voters in a province
What is a Parameter?
A quantity that describes a variable for an entire population (e.g., the true population mean). It is a constant, fixed value
What is an Estimate (or Statistic)?
A quantity calculated from a sample that is used to describe a variable of that sample (e.g., the sample mean). It's a random variable that changes with each different sample
What is the difference between an Explanatory and a Response variable?
The explanatory variable is the one you believe predicts or affects the response variable
Example: Researchers tested if reproductive effort (explanatory) affected the incidence of malaria (response) in birds
What are the properties of a good random sample?
It is sufficiently
large.Each individual has an
equal probability of being included.The selection of individuals is
independent.
What is Sampling Error?
The chance difference between a sample estimate and the true population parameter. This is a random difference, not a systematic one. Larger samples tend to have less sampling error.
What is Sampling Bias?
A systematic discrepancy where some parts of a population are over- or under-represented in the sample. This leads to an inaccurate estimate of the population parameter.
Example: Accidentally excluding small flowers from a sample because you couldn't see them properly.
What is a Categorical Variable?
A variable that places individuals into groups or classes20.
Nominal: Categories with no inherent order (e.g., province, genotype).
Ordinal: Categories with a natural order (e.g., red, orange, yellow)
What is a Numerical Variable?
A quantitative variable that is measured or counted.
Continuous: Can take any value within a range (e.g., height, weight).
Discrete: Can only take specific, separate values (e.g., number of limbs, number of offspring)
What is the purpose of a Bar Graph?
To display the frequency distribution of categorical data. Each bar represents a distinct category.
What is the purpose of a Histogram?
To display the frequency distribution of numerical data. It shows the number of observations falling within specified intervals ("bins"). The shape can be described as bell-shaped, skewed, uniform, or bimodal
What are Quantiles? (Median, Quartiles)
Values that divide a dataset into equal parts.
The Median is the 0.5 quantile that splits the data in half.
Quartiles are 0.25 quantiles that divide the data into four equal parts.
How do you visualize an association between two categorical variables?
Contingency Table: A table showing the frequencies of outcomes for both variables.
Grouped Bar Graph: Compares bar heights for one variable across the categories of another.
Mosaic Plot: Uses rectangular areas to represent the proportion of each category
How do you visualize an association between two numerical variables?
Scatter Plot: Shows the relationship between the two variables, where each point represents one individual's data for both measurements.
Line Graph: Connects data points to show trends, often over time.
Define the four main types of variables in statistics
Continuous Numerical: A variable that can take any real number value within a given range (e.g., height, distance to home).
Discrete Numerical: A variable that can only take specific, indivisible values, often integers (e.g., number of siblings, a random integer).
Nominal Categorical: A variable with categories that have no intrinsic order (e.g., transportation method, favorite color).
Ordinal Categorical: A variable with categories that have a natural order or ranking (e.g., "No experience," "A little experience," "Lots of experience").
What are the three main measures of location (central tendency) and what does each describe?
Mean: The average of the data , calculated by summing all values and dividing by the number of values. The mean is the "center of gravity" for the data.
Median: The middle measurement in a set of ordered data. For an even number of data points, it's the average of the two middle values. The median is robust to outliers.
Mode: The most frequent measurement in a dataset. A distribution can have multiple modes (e.g., bimodal for two modes).
What is the difference between a sample mean (Y) and a population mean (μ)?
The
Sample Mean (Y) is the average of a sample of size 'n' taken from a larger population. The formula is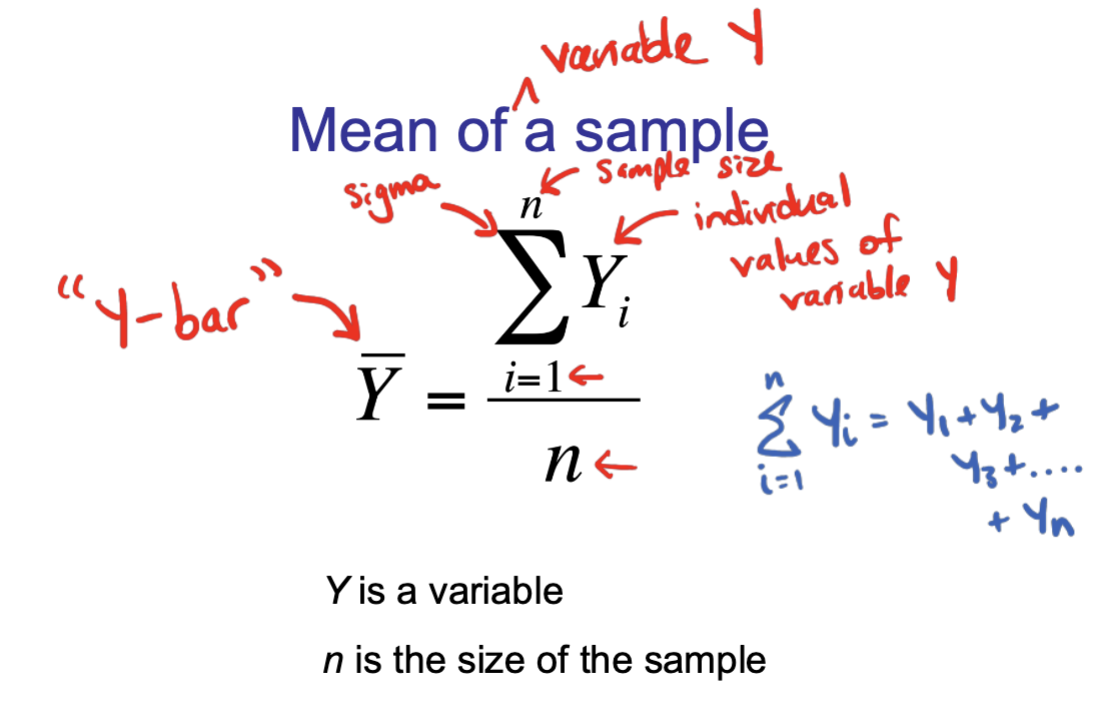
The
Population Mean (μ) is the true average of the entire population of size 'N'. The formula is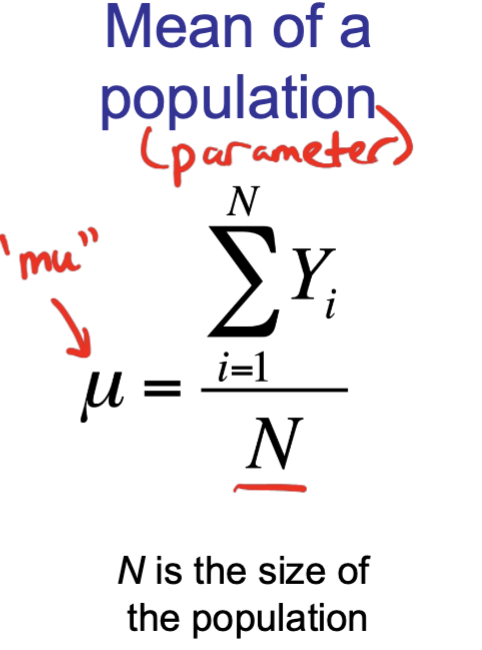
We use sample statistics (like
Y) to estimate population parameters (like μ).
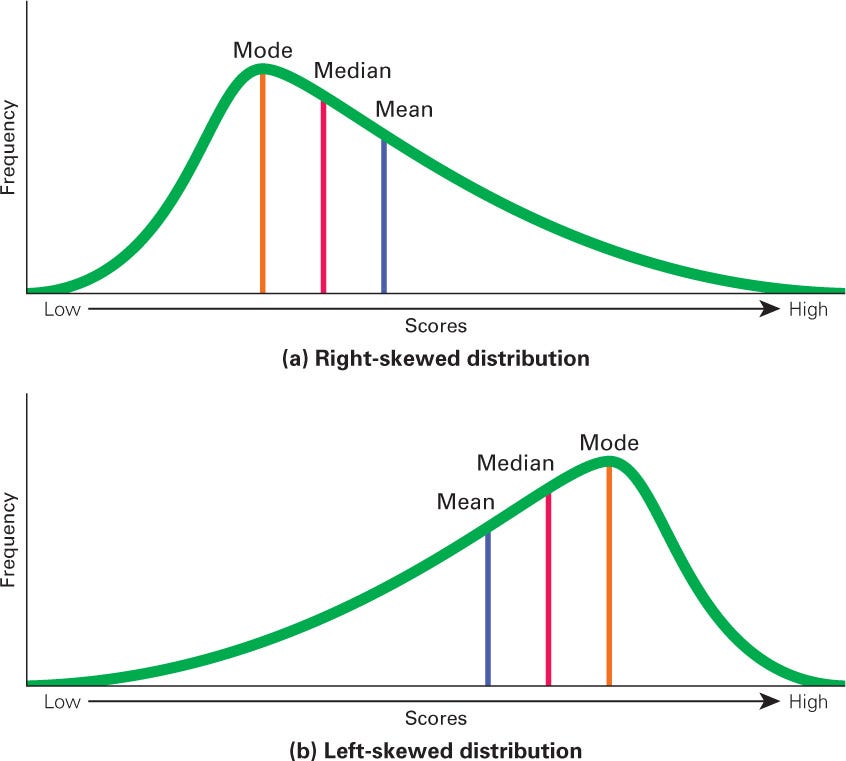
What is skew, and how does it affect the relationship between the mean and median in right-skewed and left-skewed distributions?
Skew is a measure of a distribution's asymmetry. The direction of the skew (left or right) refers to the direction of the long, pointy tail.
In a right-skewed distribution, extreme high values pull the mean to be greater than the median (e.g., household income).
In a left-skewed distribution, extreme low values pull the mean to be less than the median (e.g., retirement age).
What are the four main measures of width (spread)?
Range: The difference between the maximum and minimum values in a dataset. It is a poor and biased measure of width.
Interquartile Range (IQR): The range of the middle 50% of the data, calculated as the difference between the third and first quartiles.
Variance: The average of the squared deviations from the mean. It's a fundamental measure in statistics.
Standard Deviation: The positive square root of the variance. It is in the same units as the original data.
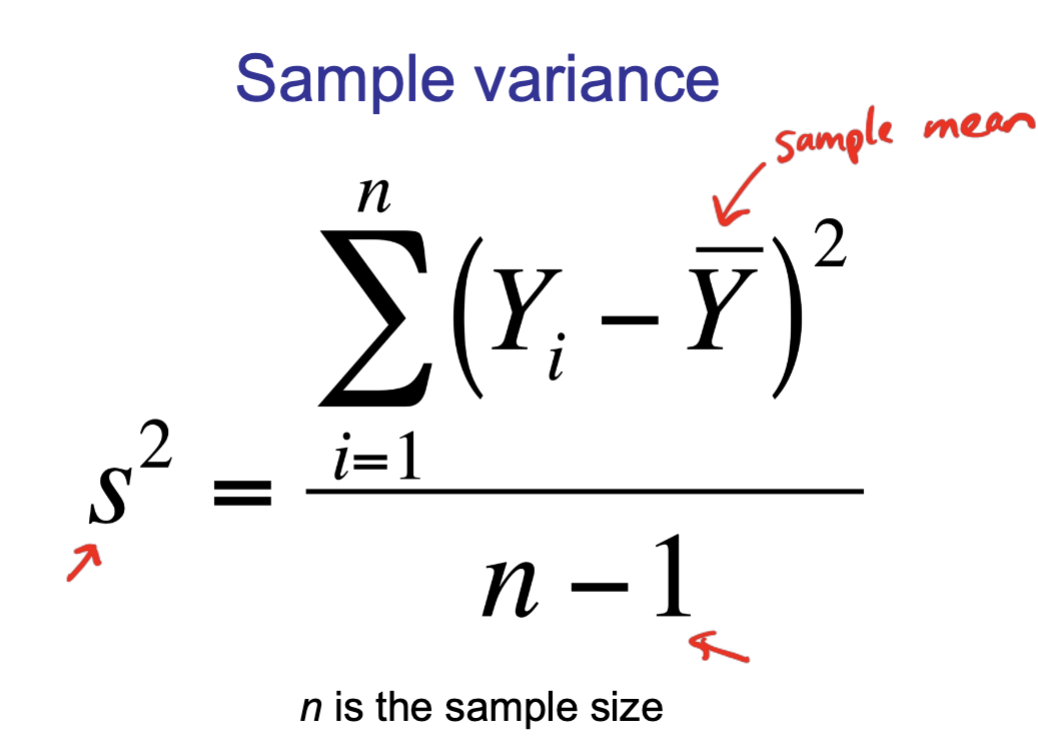
What is the key difference in the formulas for population variance (σ2) and sample variance (s2)?
The formula for
Population Variance (σ2) divides the sum of squared deviations by the total population size, N.σ2=N∑i=1N(Yi−μ)2
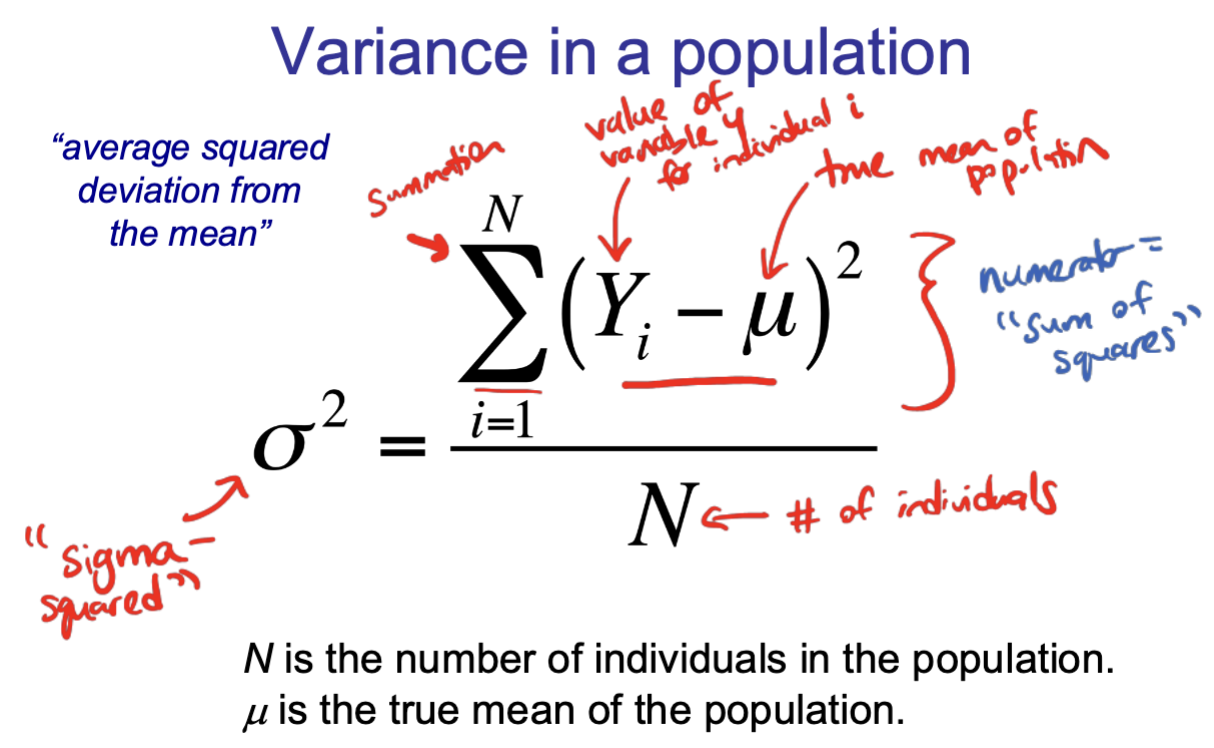
The formula for
Sample Variance (s2) divides the sum of squared deviations by the sample size minus one, n-1.s2=n−1∑(Yi−Y)2
For a bell-shaped distribution, what percentage of data falls within one and two standard deviations of the mean?
For a bell-shaped (normal) distribution:
Approximately
2/3 (or ~68%) of individuals are within one standard deviation of the mean.Approximately
95% of individuals are within two standard deviations of the mean.
What is the Coefficient of Variation (CV) and why is it useful?
The CV is a measure of relative variability that expresses the standard deviation as a percentage of the mean.
Formula: CV=100%Ys.
It's useful because it has no units, allowing you to compare the variability of traits measured in different units (e.g., comparing variability of body mass vs. lifespan)
How do the mean and variance of a dataset change when you add a constant or multiply by a constant?
Adding a constant (c):
The
mean changes by that constant (Mean[X+c]=Mean[X]+c).The
variance is unchanged (Var[X+c]=Var[X]).
Multiplying by a constant (c):
The
mean is multiplied by the constant (Mean[c∗X]=c∗Mean[X]).The
variance is multiplied by the constant squared (Var[c∗X]=c2∗Var[X]).
What are two common ways to measure the location (or center) of a dataset?
The mean (the average) and the median (the middle value)
What are four common ways to measure the spread (or width) of a dataset?
variance
standard deviation
interquartile range (IQR)
coefficient of variation (CV)
what is the coefficient of variation (CV) and why is it useful?
The CV is the ratio of the standard deviation to the mean (s/Y). It is useful because it has no units, allowing you to compare the variability of different datasets, even if they were measured in different units.
If you add a constant number to every value in a dataset, what happens to the mean and the variance?
The mean changes by that constant amount
The variance (and standard deviation) does not change at all
If you multiply every value in a dataset by a constant number, what happens to the mean and the variance?
The mean is multiplied by that constant
The variance is multiplied by the constant squared
What is the difference in notation between a sample mean and a population mean?
sample mean: Y ("Y-bar")
population mean: μ ("mu")
what is the difference in notation between a sample variance and a population variance?
Sample Variance: s2
Population Variance: σ2 ("sigma-squared")
what is a sampling distribution?
It's the distribution of an estimate (like the sample mean) that you would get by taking many, many random samples from the same population.
what happens to the spread of the sampling distribution of the mean as the sample size (n) increases?
the spread decreases. larger samples lead to more precise estimates that are closer to the true population mean.
how do you calculate the estimated standard error of the mean (SEY)?
You divide the sample standard deviation (s) by the square root of teh sample size (n)
Why can’t we usually know the true standard error?
because to calculate it, we would need to know the true population standard deviation (σ), which is almost always unknown.
what is 95% confidence interval?
a plausible range of values for a population parameter (like the mean), calculated from sample data
How can you quickly approximate a 95% confidence interval for a mean?
Take the sample mean and add and subtract two times the standard error Y±2SEY
What is the correct way to interpret a 95% confidence interval?
We are 95% confident that the true population mean lies within our calculated interval. This expresses confidence in the method, not a direct probability
what is pseudoreplication?
The error of treating measurements that are not independent (eg. multiple measurements from the same person) as if they are independent. This leads to a falsely small estimate of standard error
If a study takes 10 measurements each from 5 different climbers, what is the correct sample size (n) to use when calculating the standard error for the group of climbers?
The correct sample size is n=5 because there are only 5 independent individuals (climbers). You should average the 10 measurements for each climber first
What is a sampling distribution?
It is the distribution of all possible values of an estimate (like the sample mean, Y) you would get by taking an infinite number of samples from a population
what is the standard error of the mean?
It is the standard deviation of the sampling distribution of the mean. It tells you how much variation there is in the sample mean from sample to sample
why can’t we usually calculate the true standard error of the mean?
Because the true formula requires the population standard deviation (σ), which we almost never know
How do we estimate the standard error of the mean (SEY) using data from just one sample?
We use the sample standard deviation (s) instead of the population standard deviation (σ).
Why do areas with very small populations (like rural counties) often show up as having the highest and lowest rates of things like kidney cancer?
because estimates from small sample sizes have much more random variation (ie, a larger standard error), they are more likely to produce extreme results just by chance
what does it mean for two events to be mutually exclusive?
It means they cannot both happen at the same time. For example, when you roll a single die, the outcomes “rolling a 5” and “rolling a 3” are mutually exculsive.
If two events, A and B, are mutually exclusive, what is the probability of A and B occuring?
zero
Pr(A and B)=0.
In probability, what does the word “or” mean? (eg. Pr[A or B])
It means “at least one” of the events occurring. This includes the possibility that A happens, B happens or both happen
What is the general addition rule for finding the probability of A or B?
Pr[A or B]=Pr[A]+Pr[B]−Pr[A and B]. We subtract the “and” part to avoid double-counting the overlap.
what is the simple addition rule used only for mutually exclusive events?
If A and B are mutually exclusive, you can just add their probabilities: Pr[A or B]=Pr[A]+Pr[B].
What does it mean for two events to be independent?
It means the occurrence of one event gives you no information about whether the other event will occur. For example, the results of two separate dice rolls are independent.
what is the multiplication rule for finding the probability of two independent events, A and B, both happening?
You multiply their individual probabilities:
Pr[A and B]=Pr[A]×Pr[B].
For a continuous variable (like height or weight), what is the probability of getting any single, exact value?
zero. for continuous data, we can only find the probability of getting a value within a certain range, which is the area under the curve for that range.
What is a probability distribution?
a list or graph that describes the true relative frequency (or probability) of all possible outcomes for a random variable. The total probability for all outcomes must add up to 1
what is conditional probability?
It is the probability of an event happening, given that another event has already occured
How do you write the probability of A given B in probability notation?
Pr(A∣B). The vertical bar "|" means "given" or "conditioned on."
What is the key difference between independent and dependent events?
Independent: The outcome of one event does not affect the outcome of the other.
Dependent: The outcome of one event does affect the probability of the other.
what is the general multiplication rule for finding the probability of two events (A and B) both happening, especially if they are dependent?
Pr(A and B)=Pr(A)×Pr(B∣A). (The probability of A times the probability of B given A has happened).
what is the law of total probability used for? + formula
it is used to find the overall probability of an event by considering all the different ways it can happen. You add up probabilities of the event occurring under each different condition
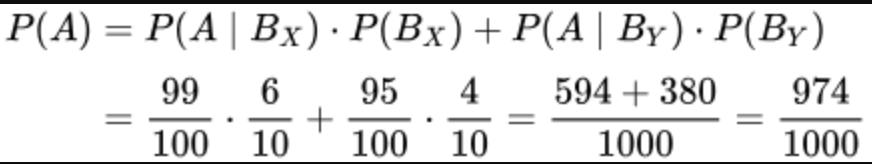
eg. to find probability of rain in any given day of the year
P(rain) = P(rain|winter)P(winter) + P(rain|spring)P(spring) + P(rain|summer)P(summer) + P(rain|fall)P(fall)
what is Bayes’ theorem used for?
it is used to flip a conditional probability. If you know the probability of a test being positive given someone has a disease (Pr(positive | disease)), you can use Bayes’ theorem to find the probability someone has the disease given they got a positive test result (Pr(disease | positive)).
what is the formula for Bayes’ theorem?
Pr(A∣B)=Pr(B)Pr(B∣A)×Pr(A)
In the trisomy 21 example, why was the probability of having the condition so low (~1.2%) even after a positive test?
because the condition itself is very rare (low initial probability) and the test has a false positive rate. The high number of false positives from the healthy population outweighs the true positives from the affected population.
What is a simple way to calculate the probability of “at least one” success in a series of independent trials?
calculate the probability of it never happening and subtract that from 1. Pr(at least one) = 1 - Pr(all failures)
if each attempt has a probability p of success, what is the probability that the first success occurs on the third try?
It means the first two attempts failed (1-p) and the third succeeded (p). You multiply the probabilities (1-p)x(1-p)xp
What is the difference between a scientific hypothesis and a statistical hypothesis?
scientific: a broad proposed explanation for something observed (eg. “red colouration in birds is attractive to mates”)
scientific: a specific, testable claim about a population parameter (eg. “the production of red-shirted wrestlers who win is 0.5”)
what is a null hypothesis (H0)?
a specific statement about a population parameter, often representing the “no effect” or “no difference” scenario. It is the hypothesis we aim to find evidence against.
what is an alternative hypothesis (HA)?
The hypothesis that includes all other possible outcomes not covered by the null hypothesis. It usually represents the interesting finding or the effect you are testing for.
what is a test statistic?
a single number calculated from your sample data that measures how well your data matches the null hypothesis
what is a null distribution?
The probability distribution of a test statistic, assuming the null hypothesis is true. It shows us all the possible results we could have gotten by chance if there were truly no effect.
how is a null distribution different from a sampling distribution?
A sampling distribution is based on a real population, while a null distribution is based on a hypothetical population where the null hypothesis is true
what is a p-value?
the probability of getting your observed data (or something even more extreme) if the null hypothesis were actually true
what is the significance level (α)?
A pre-determined threshold (usually 0.05) used to decide whether to reject the null hypothesis. If your p-value is less than or equal to α, the result is considered statistically significant
what is a Type I error?
Rejecting a true null hypothesis (a “false positive”). The probability of making a Type I error is equal to your chosen significance level (α)
what is a type II error?
failing to reject a false null hypothesis (a false negative). The probability of this error is denoted by β.
what is the power of a statistical test?
the probability that a test will correctly reject a false null hypothesis. Power is calculated as 1-β
what is the difference between a one-tailed and a two-tailed test?
two-tailed: you are testing for a difference in either direction (e.g., greater than OR less than the null value). This is the most common type
one tailed: you are only testing for a difference in one specific direction
why do we say “fail to reject the null hypothesis” instead of “accept the null hypothesis”?
because of a lack of evidence against the null hypothesis does not prove it is true. It might just mean our study did not have enough power to detect a real effect.
what is the relationship between a 95% confidence interval and a hypothesis test with α=0.05
If the value proposed by the null hypothesis falls outside the 95% confidence interval, you will reject the null hypothesis (and P <0.05. if the value is inside the interval, you will fail to reject it.
does statistical significance mean the result is biologically important?
Not necessarily. A very large study can find a statistically significant result that is too small to be biologically meaningful. Importance depends on the context and the size of the effect.
what are two common ways to measure the location of a dataset?
the mean and the median
what are four common ways to measure the spread (or width) of a dataset?
variance, standard deviation, interquartile range, coefficient of variation
what is the coefficient of variation and why is it useful?
The CV is the ratio of the standard deviation to the mean
it is useful because it has no units, allowing you to compare the variability of different datasets even if they were measured in different units
If you add a constant number to every value in a dataset, what happens to the mean and the variance?
the mean changes by the constant amount but the variance (and the standard deviation) does not change at all
if you multiply every value in a dataset by a constant number, what happens to the mean and variance?
The mean is multiplied by that constant
The variance is multiplied by the constant squared
What is the difference in notation between a sample mean and a population mean?
sample mean: Y (“Y-bar”)
population mean: u (“mu”)
what is the difference in notation between a sample variance and a population
Sample Variance: s2
Population Variance: σ2 ("sigma-squared")
what is conditional probability?
It is the probability of an event happening, given that another event has already occurred
How do you write “the probability of A given B” in probability notation?
Pr(A∣B). The vertical bar "|" means "given" or "conditioned on."
what is the key difference between independent and dependent event?
Independent: The outcome of one event does not affect the outcome of the other.
Dependent: The outcome of one event does affect the probability of the other.
what is the general multiplication rule for finding the probability of two events (A and B) both happening, especially if they are dependent?
Pr(A and B)=Pr(A)×Pr(B∣A). (The probability of A times the probability of B given A has happened).
what is the law of total probability used for?
It is used to find the overall probability of an event by considering all the different ways it can happen. You add up the probabilities of the event occurring under each event occurring under each different condition.
what is a null hypothesis?
A specific statement about a population, typically asserting no effect or no difference, which is the default assumption to be tested
what is a test statistic?
A value calculated from sample data used to measure how well the data agrees with the null hypothesis
what is a null distribution?
The probability distribution of a test statistic, assuming the null hypothesis is true.
What is a P-value?
The probability of obtaining the observed test statistic, or one more extreme, if the null hypothesis were true.
What is the significance level (α)?
A pre-determined threshold (often 0.05) for the P-value. If the P-value is less than or equal to α, we reject the null hypothesis.
What is a critical value?
A value from the null distribution that defines the boundary of the rejection region. If the test statistic is past this value, the null hypothesis is rejected.
What are the four main steps of hypothesis testing?
State the hypotheses.
Calculate the test statistic.
Determine the P-value (or find the critical value).
Draw conclusions.
What is a Type I error?
Rejecting a true null hypothesis. This is also known as a false positive.
What determines the probability of making a Type I error?
The significance level (α). If α=0.05, there is a 5% chance of making a Type I error.