Chapter 1 - Numbers in Tables and Graphs
1/25
There's no tags or description
Looks like no tags are added yet.
Name | Mastery | Learn | Test | Matching | Spaced |
|---|
No study sessions yet.
26 Terms
Statistics
A branch of mathematics that focuses on the organization, analysis, and interpretation of a group of numbers
Descriptive Statistics
A branch of statistics to summarize and describe a group of numbers from a research study
Inferential Statistics
A branch of statistics that uses results derived from a sample population to draw conclusions on a larger group of individuals.
Variables
Characteristics that can have different values (ie. level of stress, number of siblings, height)
Values
Possible number or category that a score can have (ie. 43, female, 6’2”)
Score
Particular person’s value on variable (ie. 43, female, 6’2”)
Numeric Variable (Quantitative)
A type of variable whose values are numbers (ie. age, height, temperature). These numbers tell you the degree or extent of what the variable measures.
Equal-Interval Variable
A variable in which the numbers stand for approximately equal amounts of what is being measured. (ie. difference in GPA, temperature in degrees Celsius)
Ratio Scale
An equal-interval variable is measured on a ratio scale if it has an absolute zero point, meaning that the value of zero on the variable indicates a complete absence of the variable. A statement about the difference in magnitude of the values can be made. (ie. distance, time, weight)
Rank-Order Variable
Numeric variable in which the values are ranks (ie. class standing, place finished in a race)
Nominal Variable
A variable with values that are categories or names (ie. gender, race, marital status). These variables have no particular numerical order.
Levels of Measurement
Classifications that describe the type of information within values assigned to variables (ie. nominal, ordinal, interval, ratio)
Discrete Variable
A variable that has specific values and that cannot have values between these specific values (ie. # of times you went to the dentist in the last 12 months)
Continuous Variable
A variable for which, in theory, there are an infinite number of values between any two values (ie. Answering “How old are you?” with 19.26)
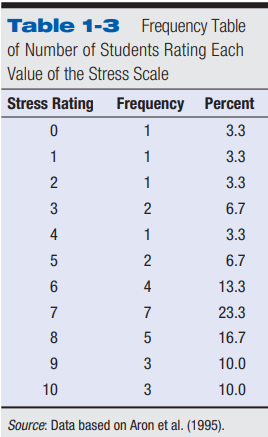
Frequency Table
An ordered listing of the frequency of each value in the group studied
Interval
Range of values in a grouped frequency table that are grouped together
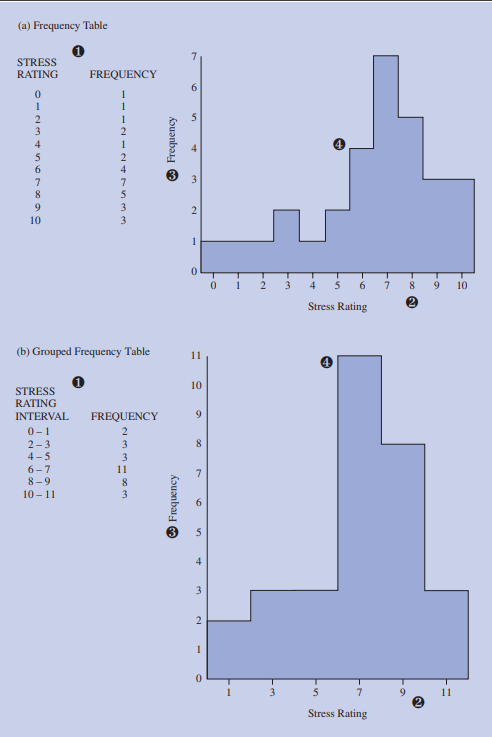
Grouped Frequency Table
A frequency table in which the frequency is given for an interval of values
Histogram
Barlike graph of a frequency distribution in which the values are plotted along the x-axis and the height of each bar is the frequency
Bar Graph
A histogram with nominal variables; the values are not in any particular order therefore a space is left between the bars.
Frequency Distribution
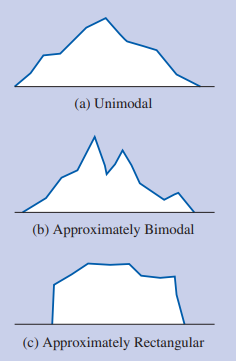
The pattern of frequencies over the various values; what a frequency table, histogram, or frequency polygon describes (ie. unimodal, bimodal, multimodal, rectangular)
Symmetrical Distribution
Distribution in which the pattern of frequencies on the left and right side are mirror images of each other
Skewed Distribution
Distribution in which the scores pile up on one side of the middle and are spread out on the other side; distribution that is not symmetrical.
Floor Effect
Situation in which many scores pile up at the low end of a distribution (creating skewness to the right) because it is not possible to have any lower score
Ceiling Effect
Situation in which many scores pile up at the high end of a distribution (creating skewness to the left) because it is not possible to have a higher score.
Normal Curve
Specific, mathematically-defined, bell-shaped frequency distribution that is symmetrical and unimodal; distributions observed in nature and in research commonly approximate it.
Kurtosis
How much the shapes of a distributions differs from a normal curve in terms of whether its curve in the middle is more peaked or flat than the normal curve.