CH4 - Correlation
1/7
There's no tags or description
Looks like no tags are added yet.
Name | Mastery | Learn | Test | Matching | Spaced | Call with Kai |
|---|
No analytics yet
Send a link to your students to track their progress
8 Terms
What is Bivariate Data?
Bivariate data refers to data that has pairs of values for two variables. It is often used on a scatter diagram to show results.
What is the Independent or Explanatory Variable?
It is the variable that the researcher controls and can manipulate (Often on the x axis).
What is the Dependent or Response Variable?
It is the variable that is measured by the researcher (Often on y axis).
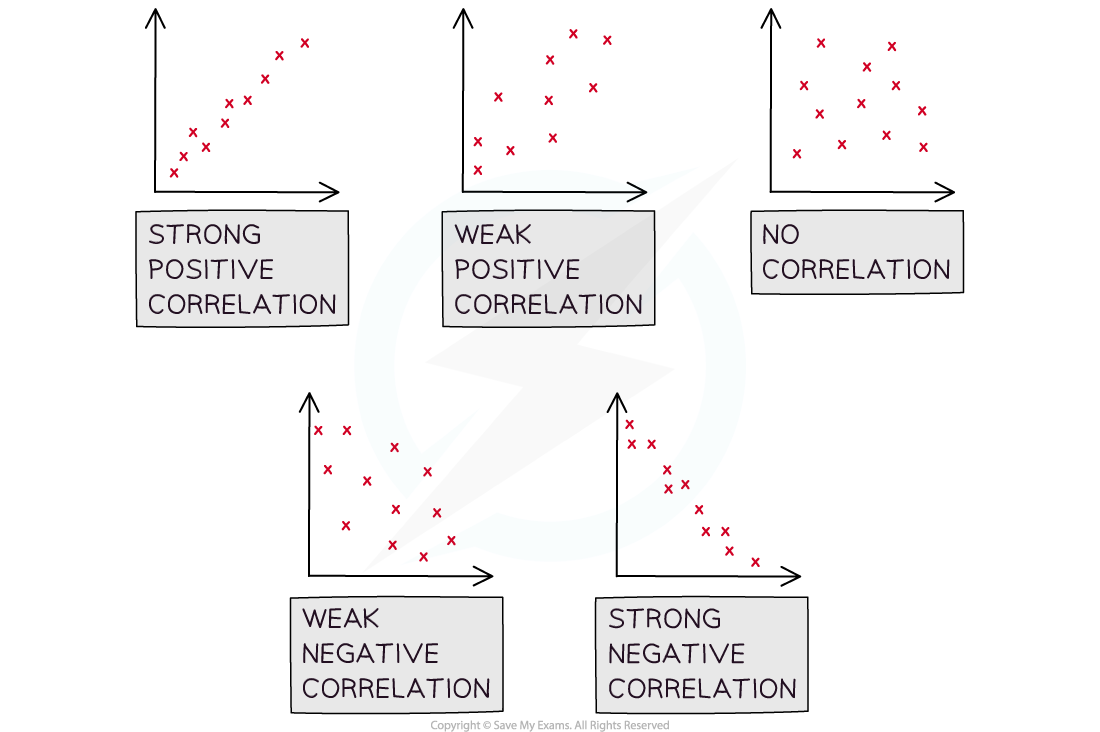
What is Correlation?
The nature of the linear relationship between two variables.
The 5 types are:
Strong Negative, Weak Negative, No Correlation, Weak Positive and Strong Positive.
What is a Casual Relationship?
A relationship where one variable directly affects another. It implies that changes in the independent variable result in changes in the dependent variable.
You should use common sense to determine whether there is a casual relationship or there is just correlation.
What is Linear Regression?
A statistical method used to model the relationship between a dependent variable and one or more independent variables by fitting a linear equation to observed data.
What is a Regression Line?
A regression line or least squares line is a line of best fit which can be drawn on a scatter plot to minimise the sum of the squares of the distances of each datapoint from the line.
Formula: y = a + bx
The coefficient b tells you the change in y per unit change in x.
For positively correlated data, b is positive and for negatively correlated data, b is negative.

How can you find the dependent variable with a known independent value?
You can substitute a known value of the independent variable into x and use the regression line to estimate the corresponding value of the dependent variable (Interpolation). This is only done in the range of data given. Extrapolation out of the data range gives a much less reliable estimate.
If you need to predict a value of x for a given value of y, you will need to use the regression line of x on y.