1B03 Intro to Microeconomics Midterm #1
1/74
Earn XP
Description and Tags
Chapters 1 - 4
Name | Mastery | Learn | Test | Matching | Spaced |
|---|
No study sessions yet.
75 Terms
What does economics study?
The study of human behaviour and choice
Economics asks the questions such as:
What choices do people make?
What factors influence those choices
What are the consequences of those choices for the person making them?
The 3 perspectives of Economics
Consumers
Managers
Government Policymakers
Assumptions about human behaviour
People are rational
People respond to incentives
People use cost-benefit analysis
People are rational (explanation)
People act on self-interest
Make decisions that they believe will make them happy/better off
People respond to incentives (explanation).
When an option becomes more attractive, people are more likely to select it
For example: If a Uni. offers a student a scholarship, they are more likely to select that offer compared to another uni that does not offer a scholarship.
People use cost-benefit analysis (explanation)
People compare marginal benefit (MB) and marginal cost (MC)
Marginal Benefit (MB)
The benefit you receive from making a decision
For example, eating a steak has nutritional value, making it healthy for your body
Marginal Cost (MC)
The cost you must pay for making a decision
For example, that same steak (that is nutritious and healthy) still costs money
Net benefit
Marginal Benefit - Marginal Cost
Consumers will consider the option with a positive net benefit
Positive Net Benefit: MB > MC
Negative Net Benefit: MB < MC
The economic problem
People have unlimited wants, but societies have limited resources
Societies face trade-offs
We must decide how to spend our resources (money, time and materials) to get as much as we can from the stuff we want the most
The 3 main economic questions
What goods/services will be produced?
How will the goods and services be produced?
Who will receive the goods and services produced?
3 Economic models/markets
Market Economy
Centrally-Planned economy (Command)
Mixed Economies
Market Economy Characteristics
Foster innovation and entrepreneurship
People are free to choose, saving them money on taxes that the government would allocate for running the economy
However, it generates a substantial amount of inequality
Resources are not allocated fairly society is underproduced
Country examples: United States, UK and Japan
Centrally-Planned Economy Characteristics
Govn. appointed central planners make decisions for the economy
Rationing reduces inequality.
If there’s an economic emergency, they are able to adjust and coordinate
However, there’s a lack of innovation (no profit motive, so they aren’t striving for innovation)
Production is usally not efficient
Country examples: Cuba and North Korea
Mixed Economy Characteristics
Combines both market economies and central planning
Private sector: Businesses owned by individuals
Government tends to influence and regulate them
Public sector: Government provides goods/services directly
Attempt to obtain the advantages of both free markets and central planning, while avoiding the disadvantages of either type
Country example: Canada and most developing countries
Positive analysis
Facts or logic —> Focused on what “is” and “could be”
More analytical and provides evidence (can be proven true or false)
Normative Analysis
Value judgements that are subjective and based on personal opinions
Cannot be proved true or false
Production Possibilities (PP)
The total quantity of goods/services our economy can produce
Since our resources are limited, need to be strategic with how our resources can be distributed across the production of multiple goods
Economic rational
How we specialize in some sectors, and import other goods
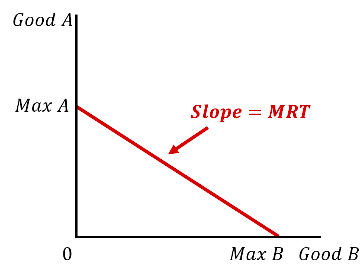
Example of PP graph
Any point beyond the PPF cannot be produced
Unemployment is an example of this as its a waste of resources
Opportunity Set: All combinations of Good A and Good B are possible with current resources

Opportunity Cost
The benefit that could be received from the next best alternative
Example: Spending time with friends on a Friday night in comparison to studying means you'll be less prepared for the test that could've been spent studying
Marginal Rate of Transformation (MRT)
The rate at which we can switch between good a and good b
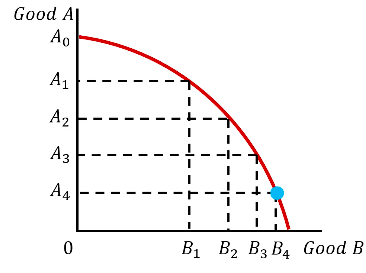
Diminishing Returns
The more resources devoted to an activity, the less production additional resources become
Could hit a point where adding further resources gives us no additional benefit
The presence of diminishing returns means the ppf becomes bowed instead of linear
Absolute Advantage
When one person, firm or country can produce more in total than another using the same resources
Comparative Advantage
When one person, firm or country has a lower opportunity cost of producing a good
Able to produce the good more efficiently than others
This is the basis of specialization and trade
Types of Markets
Output market
Factor markets
The labour market
The capital market
Output market
Firms produce good/services, which they provide to customers
Can be defined as
Broadly (classes of goods): Such as washing machines and refridgerators
Narrowly (Specific goods): Such as fast food burger places and seafood houses
Operate for profit
Types of customers; B2C, B2B or B2G
Factor Market - The Labour market
Households sell their time and efforts in exchange for salaries/wages
Firms use this time and effort as an input in the production process
Amt. of money earned depends on education level, skill and experience
Factor Market - The Capital Market
Households loan their savings to firms so that firms can purchase PPE
In return, firms pay interest and will repay the loan
Households also loan their savings to:
Other households that need the money to pay for purchases
Governments when they spend more than they collect in tax revenue
Supply and Demand Framework
Prices are determined by the action of action of:
Suppliers: Who offer goods and services
Consumers: Who wish to buy them
Quantitty demanded (QD)
The amt. of a good/service consumers are willing to buy at a given price
Law of Demand
An increase in price —> Reduces QD
A decrease in price —> Increases QD
Indirect relationship
-What effects cause the demand curve to be downward sloping
The substitution effect
The Income effect
Substitution effect:
When the price of one good rises, consumers switch and purchase another similar good
(Vice versa) When the price of one good falls, consumers will switch and buy this good instea
Income effect:
When the price of a good rises, consumers cannot afford to buy as much as before
When the price of a good falls, consumers can afford to buy more
Change in Quantity Demanded
There is movement along the curve due to a change in price
Ceteris Paribus
All else equal
Change that causes demand factors to shift right
Increase income
Increase in the price of a subsitute good
Deccrease in the price of a complementary good
An increased desire for the good
Increase in population
Reduciton in interest rates
Improved expectations about the future
Change that causes demand factors to shift left
Decreased incomes
A decrease in substitute goods
Increase in complementary goods
A decreased desire for the good
Increase in interest rates
Decrease in population
Worsening expectations about the future
Quantitty Supplied
The amount that a producer is willing and able to provide at a given price
Law of Supply
Increase in price —> Increase Qs
Decrease in price —> Decrease in Qs
Direct relationship
Why is the supply curve upward sloping?
As costs rise, firms produce more
Change in Quantity supplied
Whenever there’s a change in price, there’s movement on the curve
Producers will take advantage of this as it means they ar able to gain more profit

Factors that cause supply to shift rightward
Input prices decrease (costs are more affordable)
Production technology improves
Alternative cheaper inputs become avaliable
Interest rates delcine
Number of firms increases (total market supply increases_
Expectations about the future improve
Factors that cause supply to shift leftward
Input prices increases
Interest rates increase
Number of firms decreases
Expecations about the future worsen
Equilibrium price
Intersection of the supply and demand curve
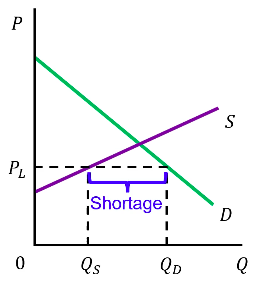
Shortage / Excess demand
When the current market price is too low
QS < QD
Firms will raise prices to expand production until they reach the eq point.
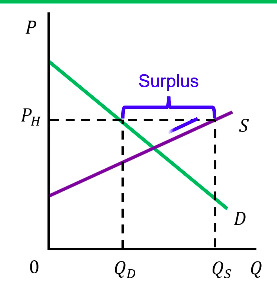
Surplus / Excess Supply
When the current market price is too high
QS > QD
Producers are making more than consumers actually want to buy
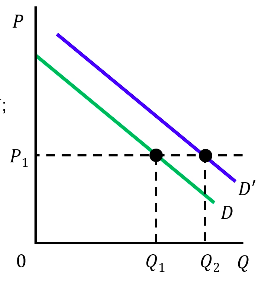
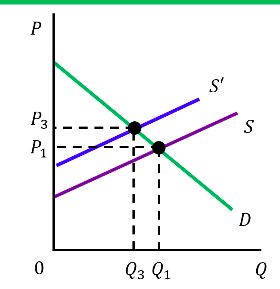
An increase in Demand
Any factor that causes demand to increase will cause the price to rise and will also cause the quantity sold to rise (for his graph, D is the same as D1 and D' = D2)

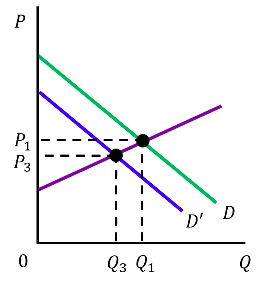
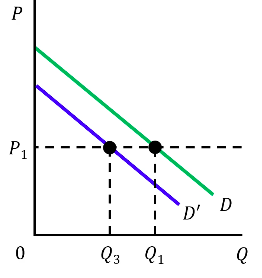
Any factor that causes demand to decrease will cause the price to fall and will also cause the quantity sold to fall (for his graph, D is the same as D1 and D' = D2)
Decrease in Demand
Increase in Supply
Any factor that causes supply to increase will cause the price to fall and will cause the quantity sold to rise (On his graph, S is the same as S1, and S' = S2)
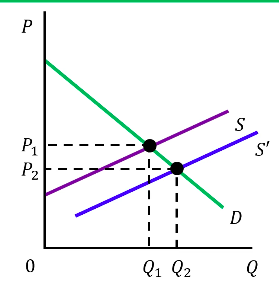
Decrease in Supply
Any factor that causes supply to decrease will cause the price to rise and will cause the quantity sold to fall
Consumer surplus
The difference between what consumers are willing to pay for a good and the price they actually pay
Perceived value - Price
You might be willing to pay $8 for a burger, but it actually costs $5 —→ The consumer surplus is $3
Where is the Consumer surplus located
Total area between the demand curve and the price line
Beneath demand, above eq

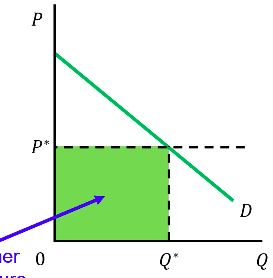
Total consumer expenditure
The amount that consumers pay in total for Q units
Calculated as: Price x Quantity
The green box is the Consumer expenditure
This also becomes producer revenue
Producer Surplus
The difference between the price producers are willing to accept (based on marginal cost) for a good/service compared to what they actually receive
Can be calculated by: Price - Marginal Cost of Producing the unit
Represents the extra money that producers earn above their cost to make units
Where is the producer surplus located?
Total area between the supply curve and the price line
Beneath the eq
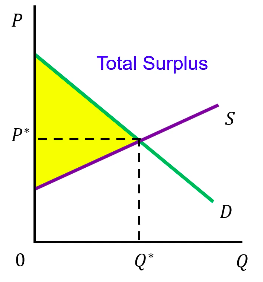
Total Surplus
Consumer surplus + Producer surplus
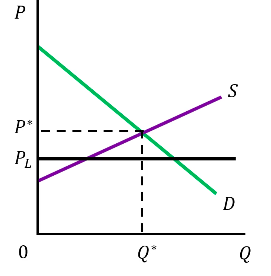
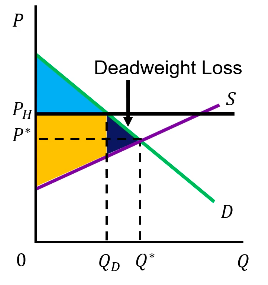
Price Floor
A minimum price set by the government
Allowed to be higher than the price floor, but cannot be less than the price flooor
Benefits producers
Producers surplus is larger and consumer surplus is smaller
Deadweight Loss
Reduction in total surplus
For example, in Ontario, the government imposes minimum prices on alcohol and tobacco products
This is due to the fact that these have serious health concerns, so the government wants you to buy less of these items
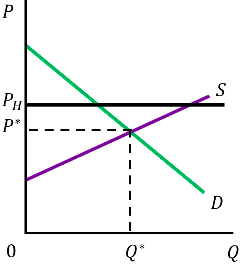
Price ceiling
Maximum price set by the government
Price is allowed to be lower than p.c but cannot be higher
Benefits consumers —> Consumer surplus is larger and producer surplus is smaller
Problems with price ceilings
Advanatge for some consumers, and disadvantage for others
Some consumers take advantage of this low price
For example: Rent Control
The artifically low price generates excess demand (shortage)
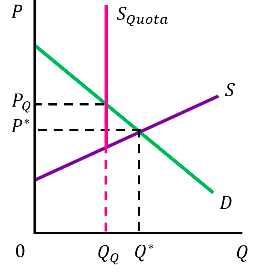
Quota
Maximum quantity set by the government
The amount producer is allowed to be lower than the quota, but cannot be higher than the quota
Benefits produers
Producer surplus is larger and consumer surplus is smaller
Generates a deadweight loss
For example: The government works with both egg farmers and dairy farmers to set quotas for eggs and milk
Even though the policy means higher prices for Canadian consumers, the government believes its worthwhile to ensure that farmers can earn enough money to continue farming
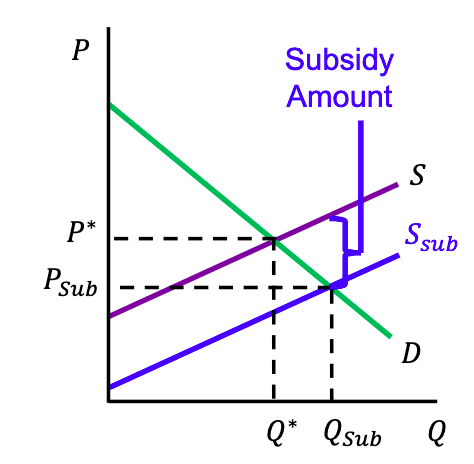
Subsidy
Payment made by the government to firms to cover a portion of the cost of production
Could be in the form of cash payments or tax rebates
Lower costs = increased production
Also lowers the price that consumers must pay
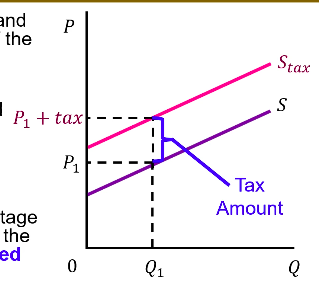
Sales Tax
Added to the price consumers pay
Firms need to cover their production costs
Unit tax
When the amt. of the tax is fixed and does not change with the underlying price
Fuel Taxes: A gasoline tax is a classic example, where a government charges a specific amount (e.g., cents or dollars) for every gallon or liter of fuel sold, regardless of the final price.
Value added tax / Valorem tax
When the amt. of the tax is a percentage of the price, and increases as the price increases
Best example: Harmonized Sales Tax (HST) = 13%
Effect of a tax
Since tax increases the price, consumers buy less
Since suppliers are producing a lower quantity, they charge a lower price
Consumer incidence of the tax
The change in the consumer price
Producer incidence of the tax
The change in the producer price
Tax amount
Consumer incidence + Producer incidence
Firms cut their prices to try and keep some customers
In a way, producers are helping the consumer by covering the tax by lowering the price
Welfare effect on tax
Tax causes the producer price to decline, and consumer price to rise, and the quantity to fall
Since consumers pay a higher price and buy less, consumer surplus shrinks
Since producers receive a lower price and sell less, producer surplus shrinks
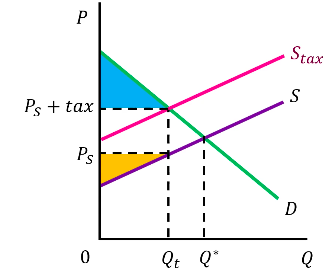
Government tax Revenue
Tax Revenue = Tax x Quantity sold
The government will use the additional income by improving the economy such as improving infrastructure and improving school education systems