Quantitative Research (1-20 activity)
1/19
There's no tags or description
Looks like no tags are added yet.
Name | Mastery | Learn | Test | Matching | Spaced |
|---|
No study sessions yet.
20 Terms
Skewness
It measures the deviation of the given distribution of a random variable from a symmetric distribution such as Normal Distribution
Asymmetrical Distribution
It occurs if irregular frequencies and the mean, median, and mode occur at different points.
Left or right
If the distribution is not symmetrical, the frequency distribution is skewed to the ____
Mesokurtic Distribution
The distribution is characterized by having a kurtosis value of 3
Symmetrical Distribution
It occurs when the values of variables appear at regular frequencies and often the mean, median, and mode of occur at the same point.
Positively Skewed
The mean and median is greater than the mode.
Kurtosis
It is a measure that describes how heavy the tails of a distribution differ from the tails of a normal distribution.
Pearson’s First Coefficient
It is used to measure the data distribution that exhibited heavy mode.
Pearson’s Second Coefficient
It is used to measure the data distribution with multiple modes.
Correlation
It is defined as a statistical association between two variables.
Scatterplot
It is a mathematical diagram using Cartesian coordinates to display values for typically two variables for a set of data.
Pearson’s Product-moment Correlation Coefficient
It is a correlational coefficient used in linear regression.
Kurtosis
It is a measure that describes how heavily the tails of a distribution differ from the tails of a normal distribution. It means positive Mesokurtic.
Pearson Correlation Coefficient
It is a statistical method that measures the similarity or correlation between two data objects by comparing their attributes and calculating a score ranging from -1 to +1.
Bowley Skewness
It uses the quartiles (Q1, Q2, and Q3) of the data to determine the direction and degree of skewness, nothing it resort to outliers.
Open-ended Frequency Distribution
It is a distribution with no boundary.
Kelly’s Measurement of Skewness
It is calculated using the 10th and 90th percentile, excluding 20% of the observations, and compares them to the 50th percentile (median).
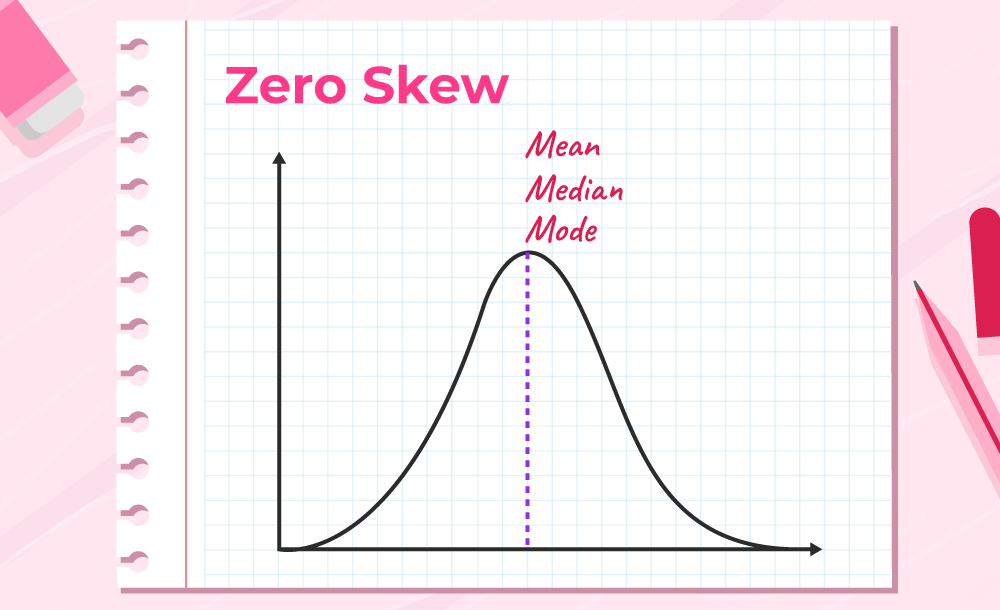
Illustrate the zero skew
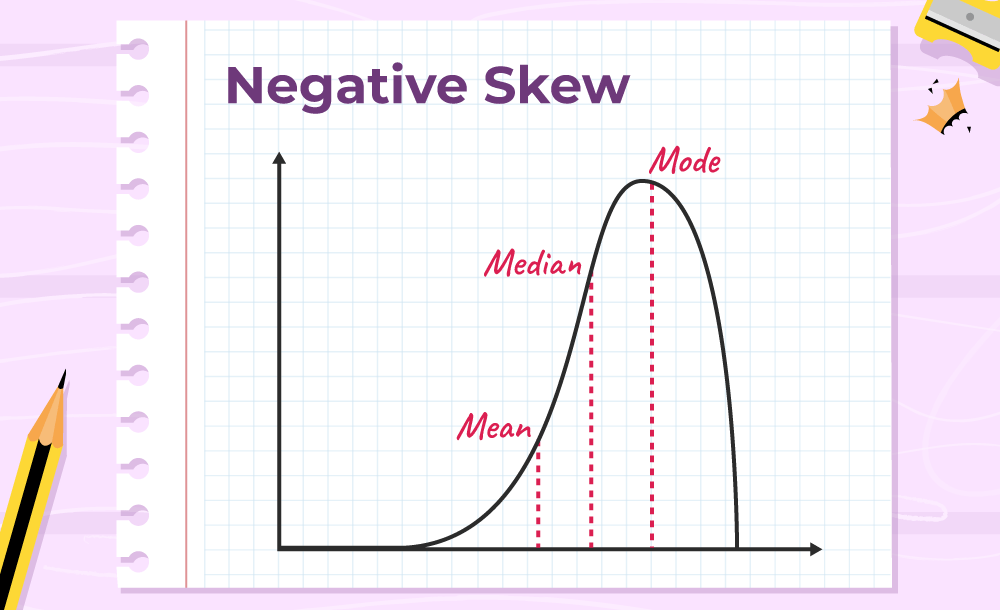
Illustrate the negative skew
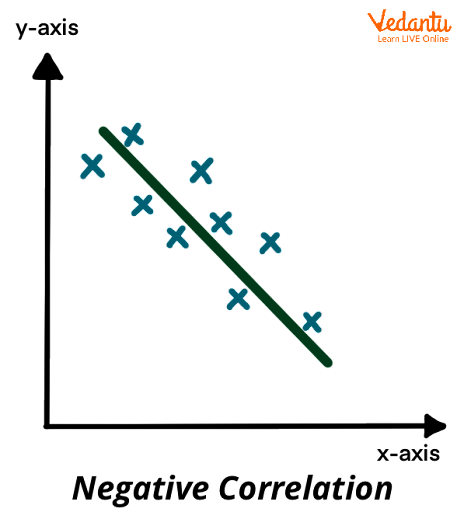
Illustrate the negative correlation